Índice
¿Cómo obtener un informe analítico de X (Twitter)? Plantilla y ejemplo
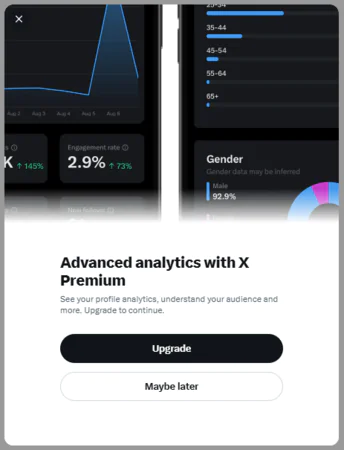
Crear un informe analítico de X (Twitter) puede ser difícil, ya que sólo puedes acceder a los datos analíticos si pagas una suscripción premium. E incluso entonces, ¡no hay opción de exportar los datos! Entonces, ¿cómo hacer un informe de Twitter? ¡Te mostraré exactamente cómo en este artículo!
En Informe analítico de X (Twitter) resume el rendimiento de tu cuenta de Twitter (ahora X). Dependiendo del objetivo de tu informe, puede incluir métricas de participación y otras métricas como el crecimiento de seguidores.
Un informe de este tipo es una forma eficaz de presentar los resultados y perfeccionar la estrategia.
Desde que Elon Musk se hizo cargo de Twitter, han cambiado muchas cosas (no sólo el nombre); por ejemplo, puedes ya no comprueban Análisis de Twitter gratis.
Este es un gran problema para las empresas y los particulares que confían en Twitter como plataforma clave.
Pero no te preocupes.
A continuación, te guiaré a través de 9 sencillos pasos para que puedas crear tu propio informe analítico de Twitter.
¿Qué es un informe analítico X (Twitter)?
Un informe de análisis de X (Twitter) es un documento fácil de entender o un panel interactivo que destaca el rendimiento de su cuenta de X (Twitter), Tweets o presencia de marca en esta plataforma.
Un buen informe debe presentar diferentes métricas (por ejemplo, tasa de participación, impresiones de Twitter, aumento de seguidores, etc.) y perspectivas procesables.
¿Por qué crear informes analíticos X (Twitter)?
Los informes analíticos de X (Twitter) se crean para:
Medir el impacto: Obtenga una comprensión más profunda del rendimiento de la campaña, el comportamiento de la audiencia o el rendimiento general.
Optimizar la estrategia: Evalúa tu rendimiento en X (Twitter). A partir de la información obtenida, optimiza tu estrategia de contenidos (si es necesario), crea contenidos que tengan más probabilidades de resonar entre tus seguidores y crea una comunidad comprometida.
Comunicar los resultados: Presenta tus análisis X (Twitter) a clientes y otras partes interesadas de forma clara y visualmente atractiva.
Apoyar la toma de decisiones: Estos informes le permiten tomar decisiones basadas en datos para mejorar su rendimiento.
¿Para quién son los informes analíticos de X (Twitter)?
Estos informes son para cualquiera que utilice X (Twitter) profesionalmenteincluyendo:
Gestores de redes sociales
Agencias
Empresas
Obtenga un desglose detallado de las métricas de su campaña.
X (Twitter) plantilla de informe analítico
Estos son X informes analíticos (Twitter) que he generado utilizando Brand24.
Los informes anteriores son sólo ejemplos, pero con Brand24, ¡puede generar un informe para su marca!
Brand24 es una Herramienta de escucha social con IA que rastrea e informa de sus resultados de marketing a través de múltiples fuentes, no sólo X (Twitter).
Entre las fuentes de datos para esta herramienta figuran:
Redes sociales, como Instagram, Facebook, X (Twitter), TikTok, YouTube, LinkedIn, Reddit, Bluesky, Telegram, Twitch, Pinterest
Sitios de noticias, blogs, podcasts, plataformas de vídeo y otros sitios web
Foros, sitios de reseñas y boletines informativos
¿Cómo se puede generar un informe para usted en Brand24?
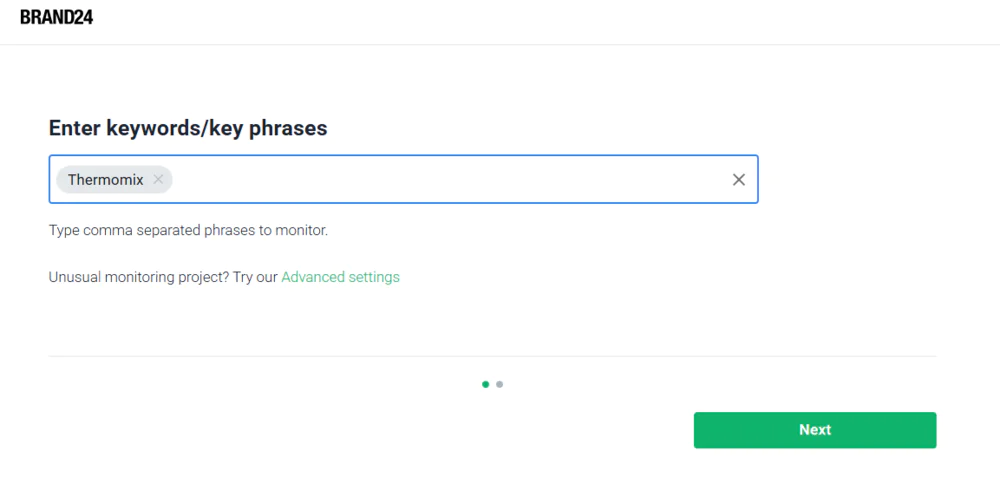
Configura un proyecto en Brand24 con el nombre de tu marca, producto o hashtag de marca 💻
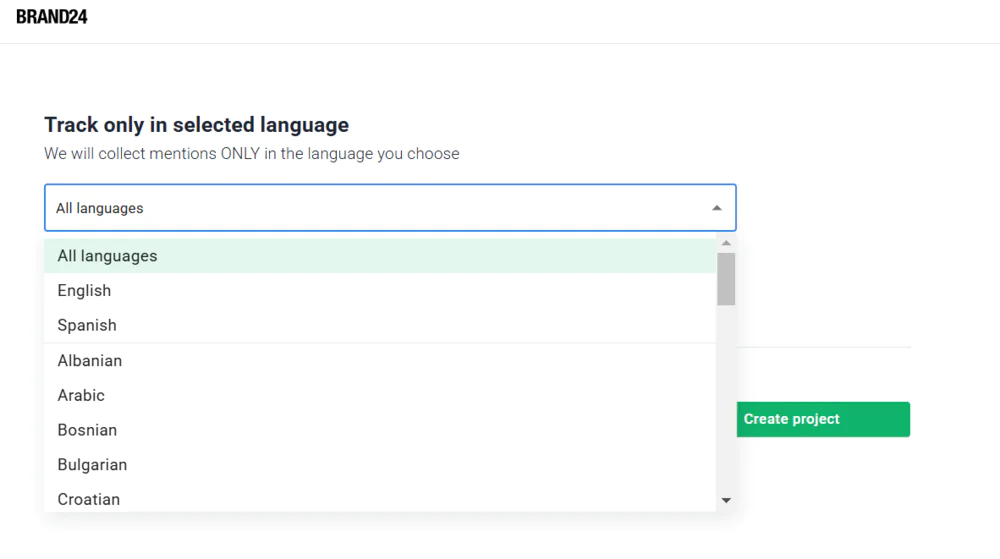
- Seleccione el idioma de la palabra clave reunida mentions 🌎
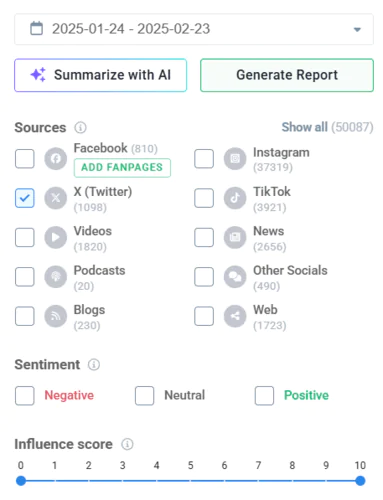
A la derecha, en la sección "Fuentes", elija la plataforma que desea rastrear - por ejemplo, X (Twitter) 𝕏
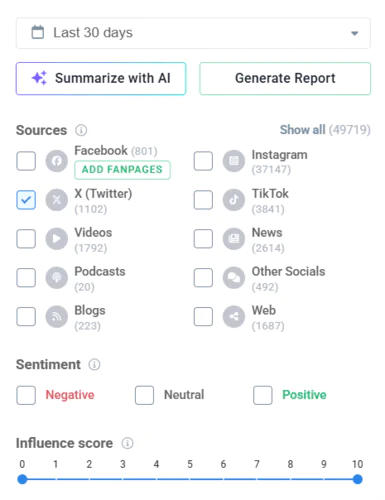
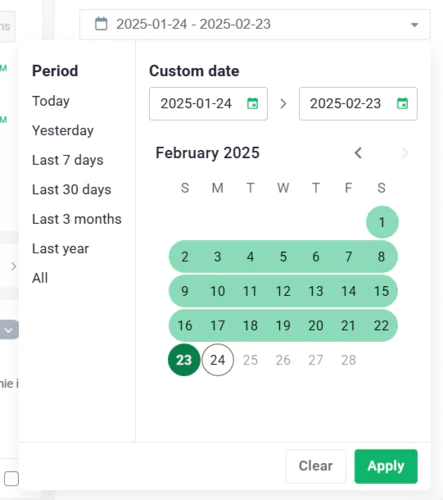
Seleccione el período del informe 📅
Haga clic en "Generar informe" ✅.
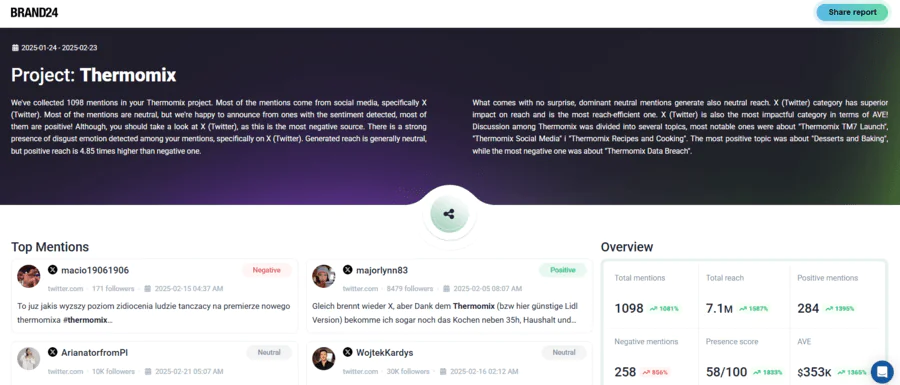
5 segundos y listo: aquí tienes tu bonito informe para compartir:
Éstas son algunas de las preguntas a las que pueden responder los informes analíticos X (Twitter) de Brand24:
- ¿Con qué frecuencia [nombre de la marca, producto, #] mentioned en X (Twitter)?
- ¿Cuántas personas [nombre de la marca, producto, #]-¿Tweets relacionados con el alcance?
- ¿Cuál es el sentimiento de [nombre de la marca, producto, #] en X (Twitter)?
- ¿Cómo afecta el sentimiento de [nombre de la marca, producto, #] en X (Twitter) en comparación con otras plataformas?
- Cuál es el AVE de los Tweets mentioning ¿[nombre de la marca, producto, #]?
- ¿Cuáles son los principales temas de debate relacionados con [nombre de la marca, producto, #]?
- Qué usuarios X (Twitter) tienen mayor alcance cuando mentioning [nombre de la marca, producto, #]?
- ¿Cuál es el mejor momento para tuitear sobre [nombre de la marca, producto, #]?
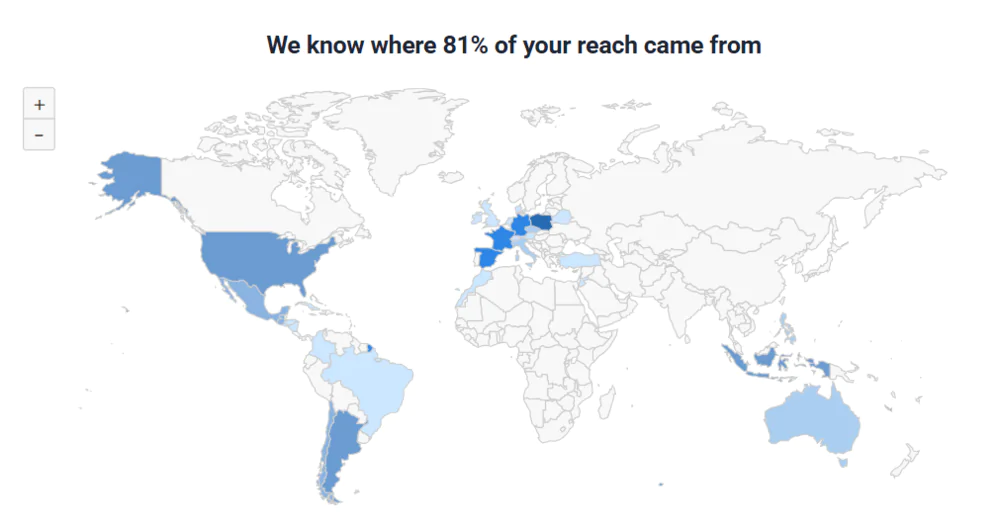
- ¿Cuál es la geolocalización de la audiencia alcanzada por [nombre de la marca, producto, #]-¿Tweets relacionados?
Obtenga todas las métricas clave en un solo informe
¿Cómo obtener un informe analítico de Twitter? 9 pasos
Te he enseñado a crear un informe, pero eso no es todo.
Hay otros pasos importantes que debes dar más allá de "crear".
Vamos a repasarlas:
01 Elija sus objetivos
Su informe debe tener un objetivo concreto: cuanto más específico, mejor.
Evite crear informes con objetivos demasiado amplios. Un objetivo bien definido hará que el informe tenga más sentido y sea más fácil de entender.
He aquí algunos ejemplos de objetivos que puede tener su informe de análisis X (Twitter):
✅ Medición del rendimiento de campañas X (Twitter) (por ejemplo, campaña de almuerzos de productos, campaña de hashtags)
✅ Evaluar la eficacia de los contenidos
✅ Analizar el comportamiento y los datos demográficos de la audiencia
Considere también a quién va dirigido el informe. Son profesionales con experiencia o no?
Es importante adaptar el documento a su nivel de conocimientos.
Si sabe que lo leerán personas ajenas al sector, añada explicaciones o comentarios sencillos para que todo resulte fácil de entender.
02 Elegir las métricas clave
El siguiente paso es seleccionar Métricas X (Twitter) que se ajusten al objetivo de su informe.
Sin embargo, hay algunos métricas de marketing que pueden incluirse en la mayoría de los informes de análisis de redes sociales:
Compromiso y tasa de compromiso
Impresiones
El volumen de menciones
Número de seguidores
Porcentaje de clics (CTR)
Aquí tienes las métricas básicas que puedes utilizar para cada objetivo que mentioned en el paso anterior:
Medición del rendimiento de campañas X (Twitter) ➡️ impresiones, tasa de compromiso, sentimiento, clics en enlaces, conversiones, volumen de mention, alcance en las redes sociales, nuevos seguidores conseguidos
Evaluación de la eficacia de los contenidos ➡️ Tweet engagements, sentimiento, clics en enlaces, Tweets con más impresiones, alcance en redes sociales, seguidores de Twitter ganados
Análisis del comportamiento y los datos demográficos de la audiencia ➡️ ubicación de la audiencia, desglose por edad y sexo, participación según la hora del día, aumento de seguidores a lo largo del tiempo
Genere un informe profesional para su empresa
03 Recuerde las visualizaciones de datos
Tenga en cuenta que un un buen informe NO se basa sólo en cifras brutas!
Los datos son mucho más fáciles de digerir cuando se presentan a través de visualizaciones. Elige las que mejor puedan representar tus datos:
Cuadros, gráficos y diagramas
Infografía
Imágenes y capturas de pantalla
Mapas y mapas térmicos
Vídeos cortos
04 Presentar ideas valiosas
Los datos brutos por sí solos no son útiles.
Hay que convertir esos datos en información práctica.
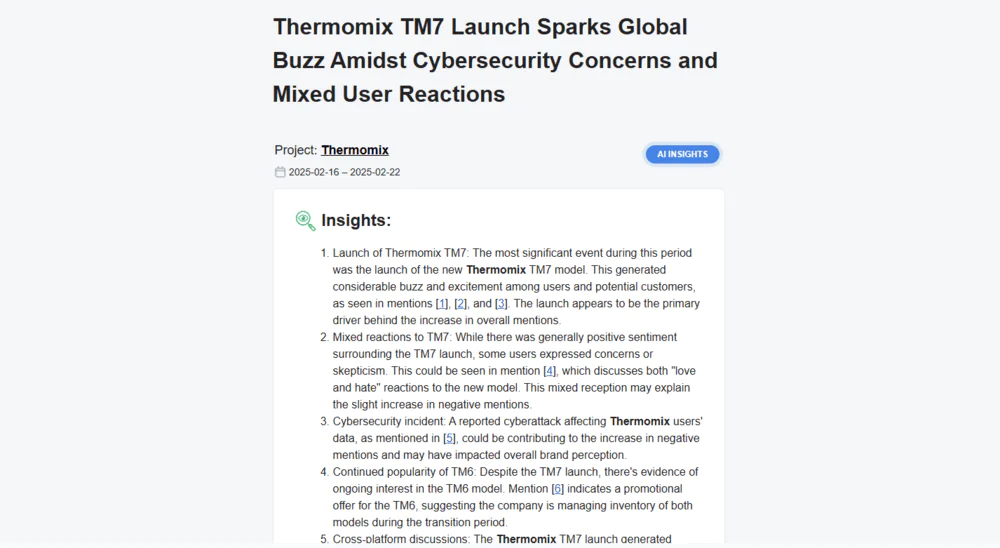
Veamos el reciente lanzamiento del nuevo modelo de Thermomix.
Aunque Thermomix no realizó una campaña especial de lanzamiento del producto en X (Twitter), creó tal expectación en la red que los usuarios de Twitter no pudieron ignorarlo.
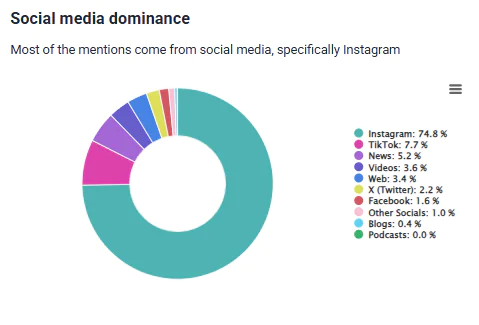
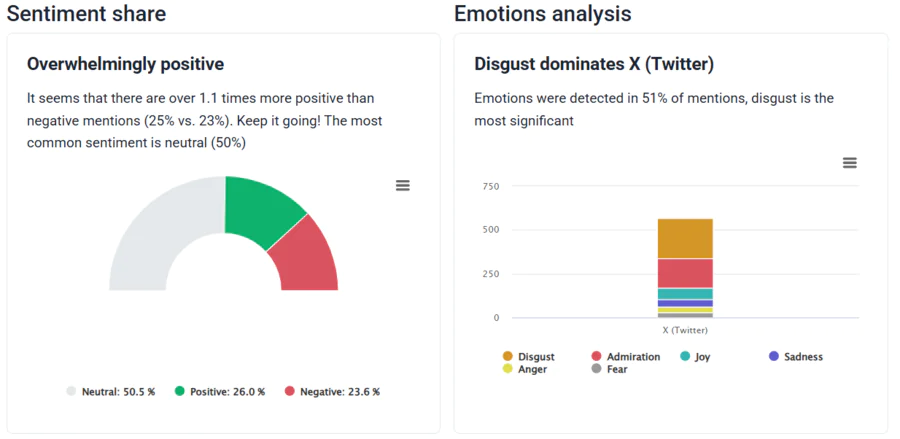
Según Brand24 Análisis de métricas de IA:
Instagram fue la principal fuente de mention (74,8% del total de mention), mientras que X (Twitter) fue la quinta fuente más importante de mentions (2.2%) a pesar de no haber campaña oficial.
50,5% de los mention en Twitter fueron neutrales, 26% fueron positivos y 23,6% fueron negativos. Esto significa que Thermomix generó más de 1,1 veces más mention positivos que negativoslo que indica un margen de mejora.
¿No es cierto que las percepciones te dicen mucho más?
Transforme los datos brutos en información clave: ¡preséntela en su informe!
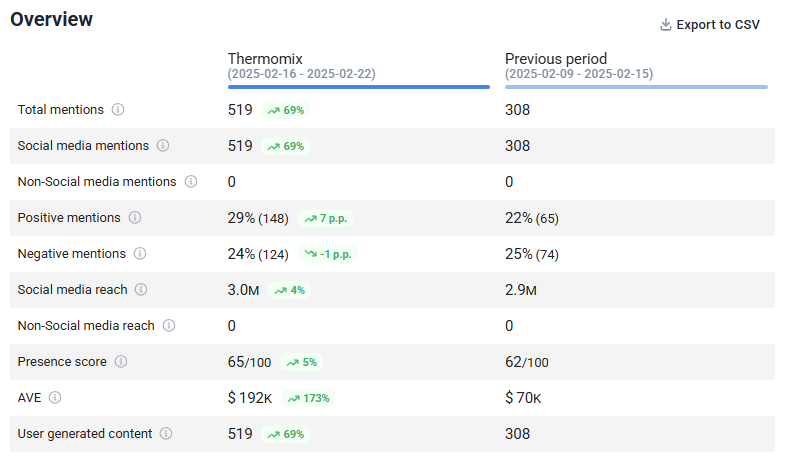
05 Comparar datos con periodos anteriores
Usted necesita un punto de referencia para comprender realmente la evolución de su rendimiento - si estás mejorando o quedándote atrás.
¿Cuál es esa referencia?
Su rendimiento en el pasado.
En pocas palabras, hay que comparar los datos actuales con los de un periodo anterior. Puede ser de año a año (YoY), de mes a mes (MoM), de semana a semana (WoW), o cualquier otra estrategia de comparación.
La buena noticia es que el Brand24 dispone de un Comparación de marcas que te permite comparar fácilmente tu rendimiento con tus resultados anteriores.
06 Comparar datos con los rivales
Además de comparar tu rendimiento a lo largo del tiempo, también es esencial compararlo con sus rivales.
Y Brand24 también puede hacerlo.
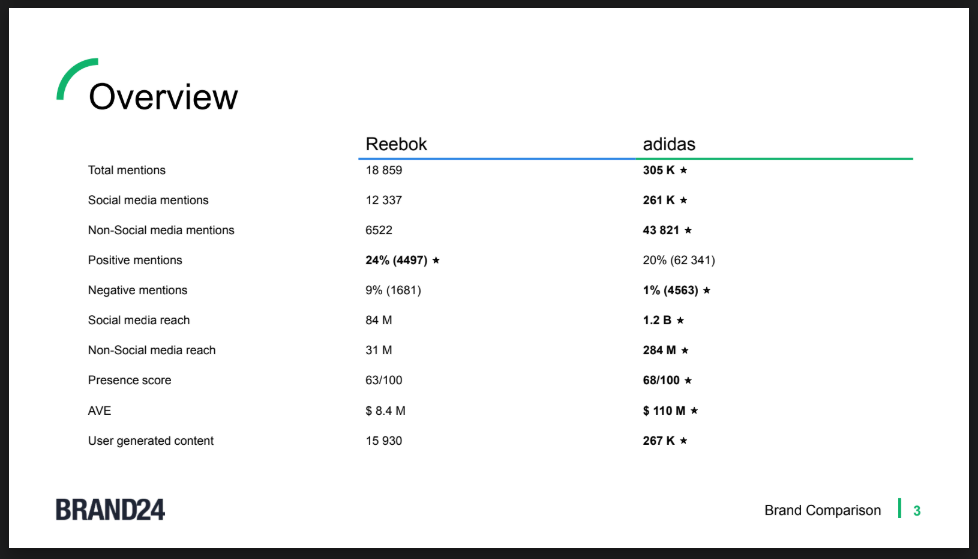
Creo que Thermomix es de primera categoría, pero al mismo tiempo, mucha gente opta por Monsieur Cuisine.
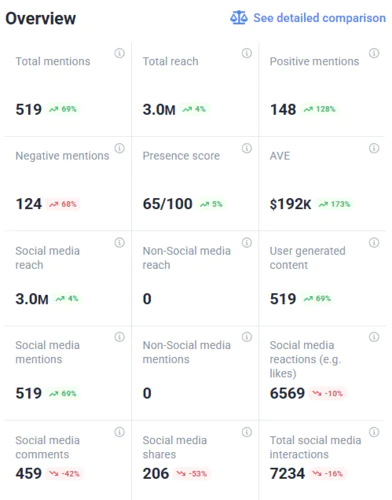
Así pues, comparemos su rendimiento global:
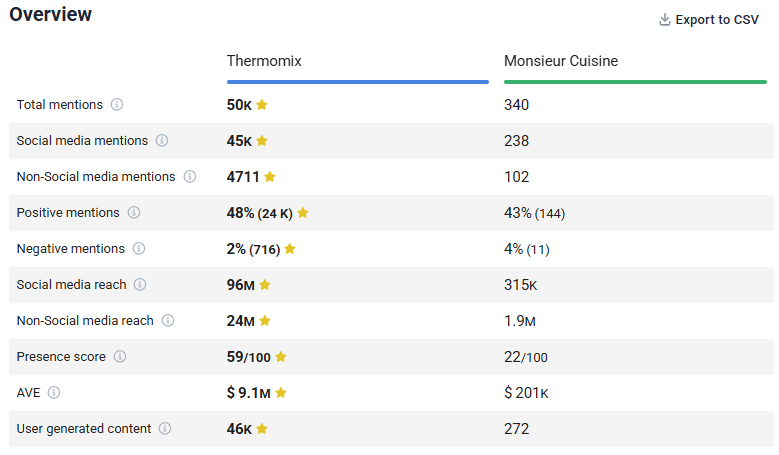
Como puedes ver, Thermomix es imbatible: ¡funciona mucho mejor en X (Twitter) y en las demás plataformas!
¿Qué le aporta la comparación con la competencia?
Lo primero y más importante, le muestra su posición en el mercado. Si profundiza en la comparación, también podrá:
Identifique sus puntos fuertes y débiles
Detecte las carencias de sus competidores y aproveche esas oportunidades.
Identificar las nuevas tendencias del mercado
Compare su rendimiento
07 Incluir planes y recomendaciones
Los informes no se limitan a presentar datos y perspectivas, sino que también deben recomendar acciones para el futuro.
Entonces, ¿cómo crear las mejores recomendaciones?
Por supuesto, utiliza tus conocimientos y experiencia. Pero también es útil apoyarse en una herramienta de IA que pueda generar esas recomendaciones.
Puedes intentar usar ChatGPT, pero sus sugerencias pueden ser demasiado generales.
Por suerte, Brand24 es el mejor cuando se trata de recomendaciones!
¿Por qué las recomendaciones de Brand24 son mejores que las generadas por ChatGPT?
Brand24 combina los conocimientos generales de ChatGPT con datos detallados que rastrea. Por eso le ofrece recomendaciones adaptadas específicamente a usted.
He aquí un ejemplo de recomendaciones generadas por ChatGPT para Thermomix:
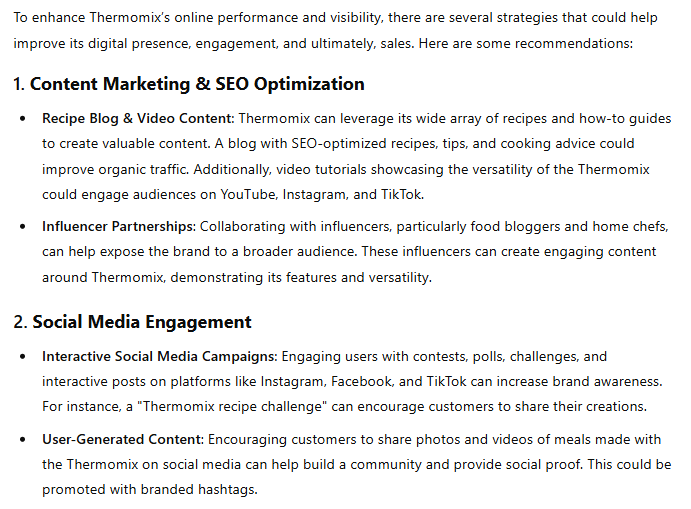
Y estas son las recomendaciones de Brand24:
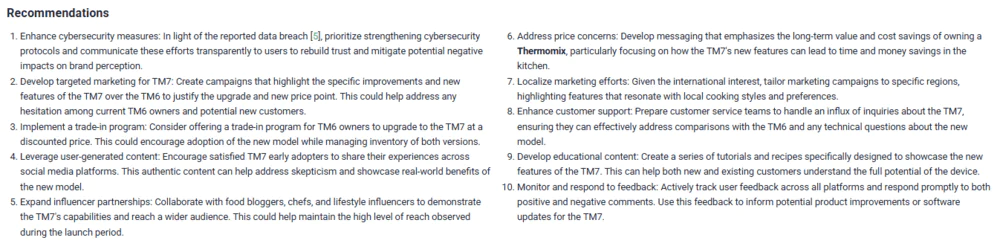
Ahora, ves que las recomendaciones generadas por Brand24 son más acertadas 👌
08 Añadir resumen
Todo buen informe debe incluir un resumen. ¿Por qué es importante?
Cuando alguien recoja su informe, deben ser capaces de captar rápidamente los puntos clave sin leer todo el documento.
Esto es especialmente útil cuando los informes se presentan a ejecutivos de alto nivel que no tienen tiempo de leer el extenso documento.
Un resumen bien redactado debe ser breve, ir al grano e incluir:
Visión general de cómo van las cosas, si se están cumpliendo los objetivos o se necesitan ajustes.
Los hallazgos, tendencias o patrones más significativos que ha observado
Recomendaciones basadas en su análisis
AI Asistente de marca puede resumir perfectamente los informes. Se trata de un chatbot en el que todo lo que tienes que hacer es proporcionarle la indicación correcta y él generará un resumen conciso:
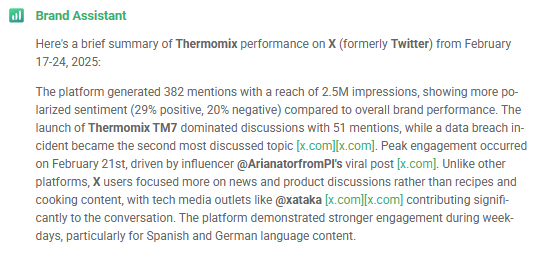
Para obtener este resumen, he utilizado esta indicación:
Escriba un resumen de 10 frases de [marca]en X (Twitter) en [periodo de tiempo]
Cree informes para mostrar fácilmente datos analíticos completos.
09 Automatice sus informes
Muchas herramientas permiten automatizar la elaboración de informes.
Cuando sus informes están automatizados, usted no tiene que preocuparse de enviarlos y (a veces) ¡incluso creándolos!
Con Brand24, informa se generan y envían automáticamente a su correo electrónico en el horario que usted elija.
No requiere ningún esfuerzo: ¡sólo hay que programarlo y olvidarse de él!
Buenas prácticas en los informes X (Twitter)
Hemos cubierto todos los pasos necesarios para crear informes eficaces.
Ahora es el momento de sumergirse en la pequeños detalles que harán que su informe sea aún mejor 💪
01 Adapte el informe a las vibraciones de su empresa
Como sabe, no todas las empresas son gigantes corporativos con un entorno rígido.
Cada empresa tiene su propia personalidad; si el informe es para uso interno, es más que bienvenido reflejarlo.
Si tu empresa tiene un ambiente más relajado y valora la atmósfera positiva, no dudes en incluir un meme divertido o un comentario jocoso.
Hará que el informe sea más agradable de leer y contribuirá a aligerar el ánimo del público durante la presentación.
Si no es así, entonces cíñete a la profesionalidad, por favor 🙏.
02 Simplicidad
Intente no complicar demasiado su informe: menos es más.
Este principio debe guiarle en todas las fases de creación de su informe.
Céntrate en los puntos clave y evita saturarlo con detalles innecesarios.
Un informe claro y conciso es mucho más impactante y eficaz.
03 Incorporar los datos de otras fuentes
Sí, ha leído bien, a veces merece la pena incluir datos de otros canales de marketing.
Por ejemplo, comparar su rendimiento en X (Twitter) con el de otras plataformas de medios sociales puede dar una visión más amplia de su presencia digital.
Sin embargo, los datos de otras fuentes no deben eclipsar tu enfoque principal. Asegúrate de que el informe se centra en los datos X (Twitter).
04 Elija el mejor formato
Elige el formato que mejor se adapte a la situación.
Por ejemplo:
El formato de presentación funciona bien si lo presentas a un equipo en una reunión. También puedes compartir el informe en PDF para consultarlo más tarde.
Si no vas a reunirte en persona y sólo quieres compartir los datos, opta por un panel de análisis interactivo. Así los demás podrán explorar los datos por su cuenta.
¡Obtén un análisis detallado del rendimiento de tu X (Twitter) con Brand24!
Conclusión
Crear un informe analítico de X (Twitter) puede ser todo un reto. Para que tu informe sea realmente valioso, necesitas:
✅ Seleccionar las métricas adecuadas que se alineen con el objetivo de su informe.
✅ Comparar resultados a lo largo del tiempo o frente a los competidores para tener un punto de referencia para evaluar si está obteniendo mejores resultados.
✅ Incluir ideas y recomendaciones basándose en los datos para futuras mejoras.
✅ Que sea claro y fácil de digerir empezando con un resumen, añadiendo gráficos y otros tipos de visualizaciones, y dando explicaciones cuando sea necesario.
En lugar de hacerlo todo solo, puede confiar en Herramientas de análisis de IA como Brand24. Pueden encargarse de todo el proceso por usted.
Reflexiones finales:
- El panel de análisis de X (Twitter) ya no es gratuito. Para realizar un seguimiento de las métricas clave, necesitas una suscripción premium o externa. X (Twitter) herramientas de análisis.
- Estas herramientas no sólo realizan un seguimiento de las métricas X (Twitter), sino que también generan informes para usted.
De este modo, no tendrá que perder tiempo averiguando cómo crear un informe analítico. Con un solo clic, obtendrás un informe listo para presentar a tu jefe, cliente o cualquier otra parte interesada.
Iniciar una prueba gratuita de 14 días de Brand24 ¡y crea tu informe analítico X (Twitter) con un solo clic! 📊

Artículo revisado por