Tabela de conteúdo
Como criar um relatório de mídia social? Modelos e exemplos gratuitos
Sente o peso de mostrar todos os esforços de mídia social? Criar um relatório de mídia social é uma das tarefas mais tediosas. Fazer malabarismos com campanhas de mídia social em várias plataformas... mas não precisa mais ser assim!
Está curioso para saber como criar um relatório de mídia social? O que incluir nele? E para não inundar você e seu público com muitas informações?
Neste artigo, mostrarei a você como tornar o processo de geração de relatórios mais agradável! Quais KPIs de mídia social devem ser escolhidos para as principais descobertas e como os modelos devem ser usados para transformá-los em relatórios mensais?
Resumo rápido
- Análise de mídia social é o processo de rastreamento, medição e análise de dados de mídia social. É a espinha dorsal de qualquer relatório eficaz de mídia social. Ela ajuda a identificar o que está funcionando, o que não está e por quê. Em vez de análise de mídia social, é apenas adivinhação.
- Coleta, visualização e apresentação de dados: Criar um relatório de mídia social não se trata apenas de coletar números, mas de colocá-los de uma forma que realmente simplifique o trabalho com eles. Afinal de contas, os números são a base de uma estratégia bem pensada!
- Insights, planos e recomendações: O segredo é transformar esses números e visualizações em percepções, conclusões, recomendações e planos claros. É isso que torna os relatórios essenciais para a ação.
O que é um relatório de mídia social?
Em resumo, o relatório de mídia social é um documento abrangente que coleta e analisa todas as informações essenciais sobre as atividades da marca em todos os canais de mídia social em um determinado período.
Gosto de pensar nisso como uma ferramenta de verificação de saúde.
Talvez eu esteja deixando de lado muitas coisas para fazer sem regularidade. O principal objetivo dos relatórios de mídia social é fornecer insights práticos que:
- Impulsione sua estratégia de mídia social
- Aumente o desempenho da sua mídia social
- E atingir suas metas de negócios
Veja aqui um exemplo de um relatório de mídia social gerado em apenas alguns segundos com o Brand24:
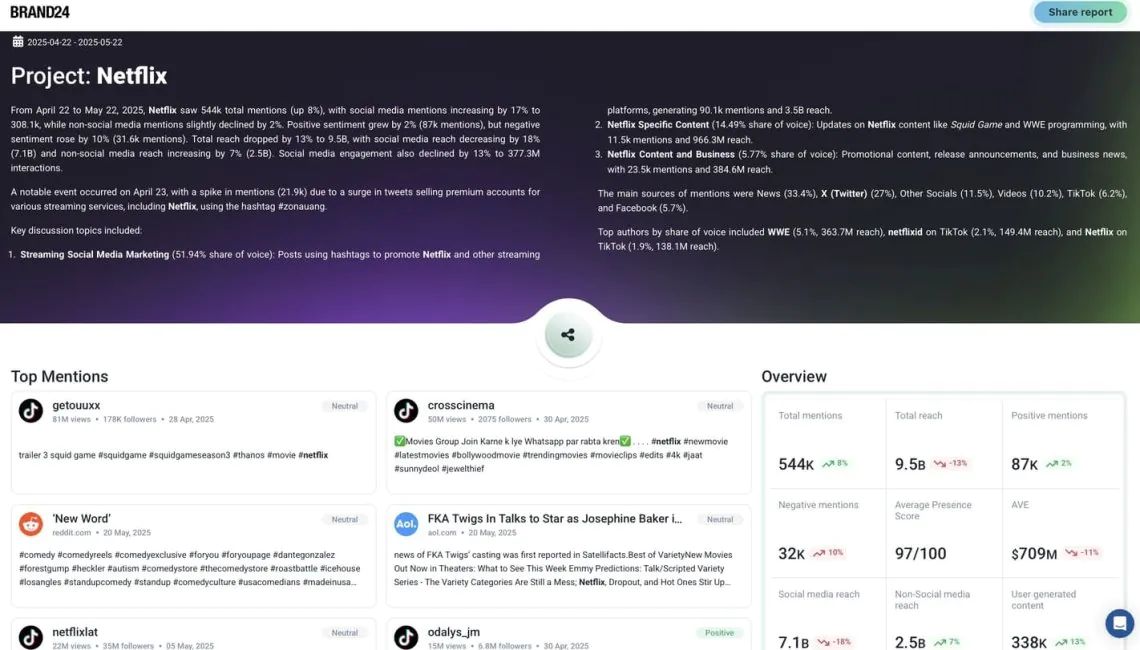
Há vários tipos de relatórios de mídia social disponíveis. As métricas e os insights específicos que você coleta dependerão de suas metas e do objetivo de sua estratégia de mídia social.
Este artigo abordará 8 etapas essenciais para criar um relatório de mídia social.
Independentemente de seus objetivos de mídia social, você encontrará dicas práticas, exemplos reais e modelos de relatórios de mídia social prontos para uso em várias plataformas. Eles são fáceis de personalizar e perfeitos para economizar tempo nos esforços de mídia social!
Crie relatórios personalizados para RP, marketing ou painéis de controle!
3 modelos de relatório de análise de mídia social para usar, personalizar ou se inspirar
Aqui estão três modelos prontos para uso que você pode baixar, personalizar para sua marca ou simplesmente usar como um ponto de partida inspirador:
📊 Clique e faça o download de modelos gratuitos:
⬇️ [Marketing] Exemplo de relatório
⬇️ [Marketing] Relatório em PDF
⬇️ [Marketing] Relatório de comparação de concorrentes
Aproveite e economize algumas horas de trabalho. Você mereceu!
Escuta social vai além das métricas de nível superficial. Ele captura conversas em tempo real em mídias sociais, sites de notícias, blogs e fóruns. Ajuda você a descobrir o sentimento do público, identificar tendências e monitorar os concorrentes de uma forma que as plataformas nativas não conseguem.
Ele fornece insights que nem sempre são visíveis à primeira vista, ajudando você a tomar decisões mais rápidas e inteligentes.
Saiba mais sobre a análise de listening social do Brand24 em tempo real estudos de caso de mídia social!
Como criar um relatório de mídia social? 8 etapas
01 Escolha suas metas
Uma meta de mídia social é o que você deseja alcançar por meio de seus esforços em diferentes plataformas.
Está procurando aumentar as conversões? Talvez você queira educar as pessoas sobre seu produto?
Ou simplesmente aumentar o reconhecimento da marca?
Sua meta de mídia social é ponto de partida para tudo o que você faz on-line. Ela orienta a sua estratégia social, molda o seu conteúdo e, por fim, ajuda a determinar o que vai para os seus relatórios de mídia social. Mas a questão é a seguinte: as metas só são úteis se forem definidas com sabedoria.
Para fazer isso, gosto de usar a técnica SMART. É uma maneira simples, mas eficaz, de definir metas claras, focadas e alcançáveis.
Defina metas SMART para os relatórios de mídia social:

- Específico: Defina claramente sua meta. Evite metas vagas como "melhorar nas mídias sociais". Em vez disso, diga: "aumentar o engajamento no Instagram".
- Mensurável: Anexe números às suas metas para acompanhar o sucesso, como "ganhar 500 novos seguidores" ou "aumentar a CTR em 10%".
- Atingível: Certifique-se de que sua meta seja realista com base em seus recursos e desempenho anterior.
- Relevante: Sua meta deve estar alinhada à sua estratégia de marketing e aos objetivos comerciais.
- Com prazo determinado: Defina um prazo claro, como "dentro de 30 dias" ou "até o final do segundo trimestre".
Aqui você pode encontrar exemplos de metas comerciais SMART:
Aumentar a taxa média de engajamento das postagens em 15% nos próximos 30 dias, otimizando o tempo de postagem e usando mais conteúdo de vídeo.
Aumentar o conhecimento da marca aumentando os seguidores do Instagram em 20% no próximo trimestre por meio de parcerias com influenciadores e Stories consistentes.
Gerar tráfego no site do Facebook em 25% nos próximos 60 dias, compartilhando o conteúdo do blog e usando links UTM para rastreamento.
02 Considere o público-alvo do relatório
Quando tenho meu objetivo, penso para quem estou preparando o relatório.
Dependendo disso, moldarei minha narrativa e comunicação e escolherei os indicadores necessários para apresentá-las. Usar o jargão de marketing é bom se eu estiver falando com uma equipe de marketing. Mas se o relatório for para outra equipe, é natural que eles não o entendam, e observações diferentes podem ser fundamentais.
Cabe a mim preparar um relatório de mídia social que seja claro e compreensível para meus principais interessados.
Como fazer isso?
Primeiro, perguntei a mim mesmo qual seria a mensagem principal para eles. O que eu quero alcançar com a apresentação deste relatório?
Em seguida, preparo um mapa dos tópicos que quero abordar nas plataformas de mídia social. Digamos que o primeiro rascunho molde a narrativa do relatório.
Então, posso ir além.
03 Escolha as principais métricas
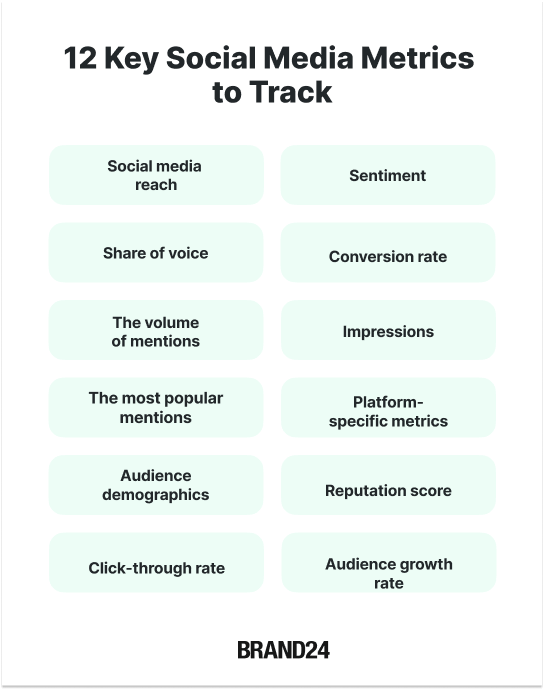
Conhecendo minha meta e meu público, posso selecionar indicadores-chave de desempenho.
Escolha apenas os indicadores que realmente influenciam sua meta. Nem todos os números são igualmente importantes em diferentes contextos. Por exemplo,
Se o relatório for sobre o lançamento de uma nova campanha, as métricas essenciais serão a taxa de cliques, o envolvimento, a conversão etc. Entretanto, se sua meta for aumentar o conhecimento da marca, priorize métricas como alcance, mentions e crescimento do público.
Como eu faço isso:
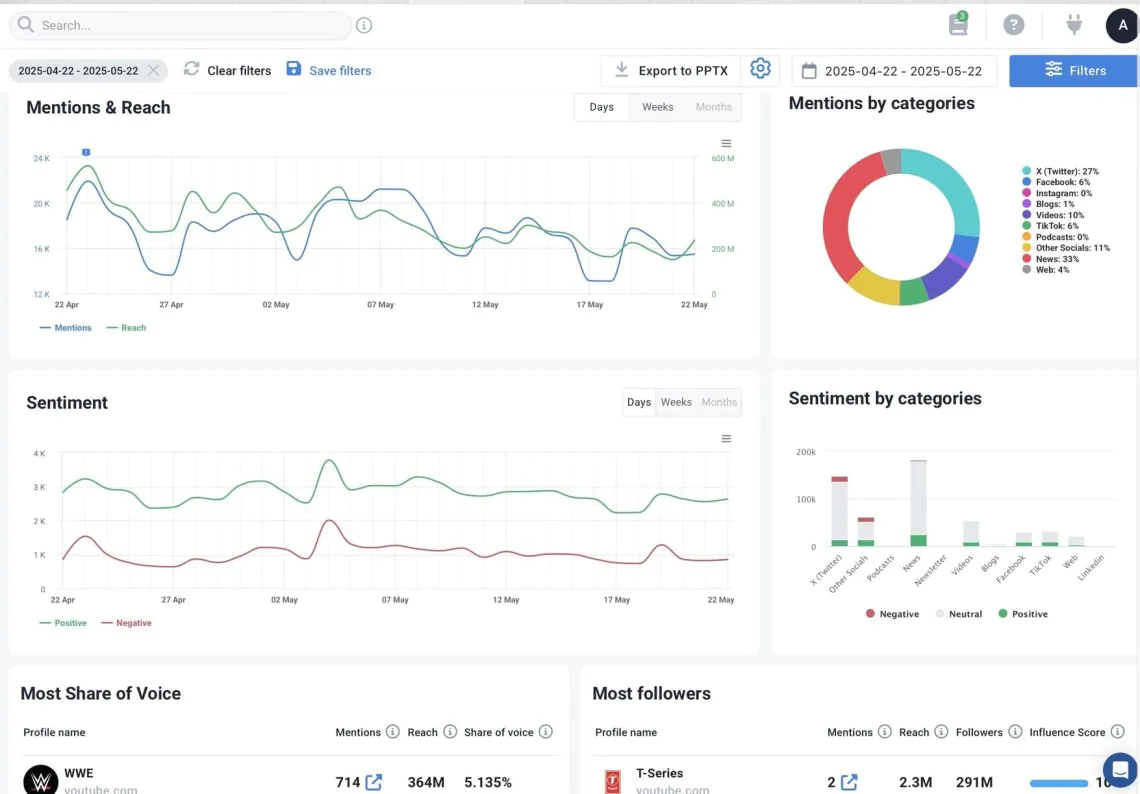
Uma boa ferramenta de geração de relatórios de mídia social deve facilitar a coleta de dados em várias plataformas e personalizar totalmente os períodos de geração de relatórios, quer você esteja preparando relatórios trimestrais, resumos mensais ou visões gerais anuais.
Gosto de usar várias ferramentas para capturar o escopo completo dos meus dados de desempenho.
Por exemplo, eu uso o Brand24 para monitorar o sentimento e os mentions e para alcançar os canais de mídia social. Ele é especialmente útil para capturar métricas específicas da plataforma e entender como as pessoas falam sobre minha marca.
Para avaliar como a mídia social impulsiona o tráfego e as conversões do site, recorro ao Google Analytics, onde também obtenho insights sobre os dados demográficos do público.
Em seguida, combino tudo no Looker Studio ou no Whatagraph, criando relatórios claros e bem estruturados que agregam valor real, sem perder o contexto.
Experimente a ferramenta Brand24. Crie relatórios de mídia social!
04 Lembre-se das visualizações de dados
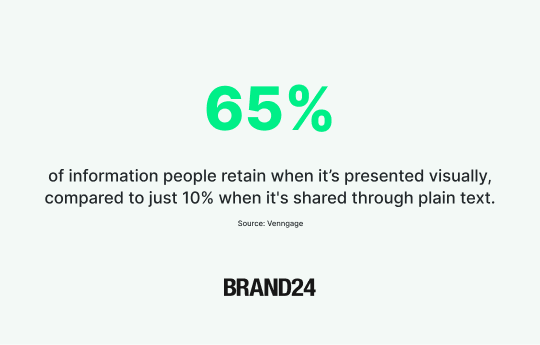
A visualização é a arma secreta de qualquer relatório eficaz de mídia social.
Os recursos visuais trazem clareza aos insights e ajudam a contar a história por trás dos números. São especialmente poderosos ao apresentar relatórios de mídia social para partes interessadas, clientes ou equipes multifuncionais.
Por quê?
Como eu faço isso:
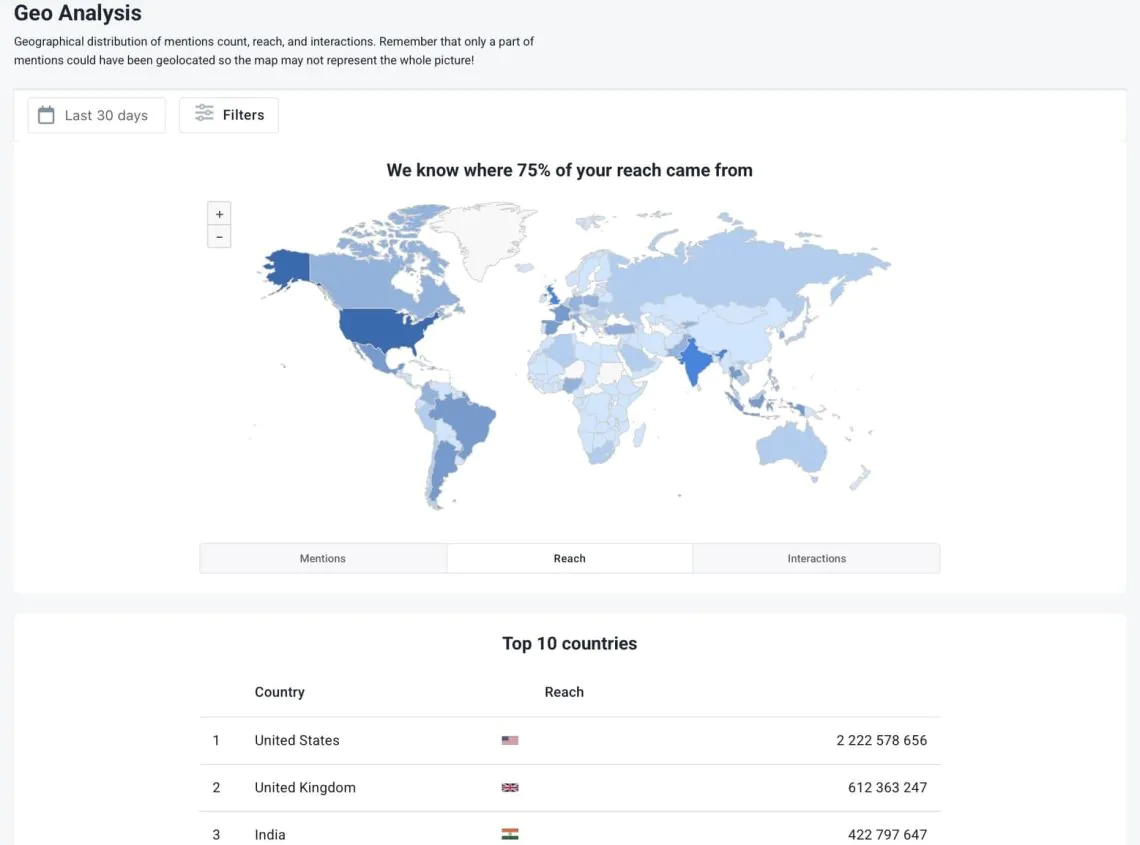
Escolhi um modelo de relatório de mídia social que oferece diferentes recursos visuais. É ainda melhor se a ferramenta oferecer uma opção fácil para personalizá-los e customizá-los. Simplesmente mudando as cores, você pode mostrar a identidade de sua marca.
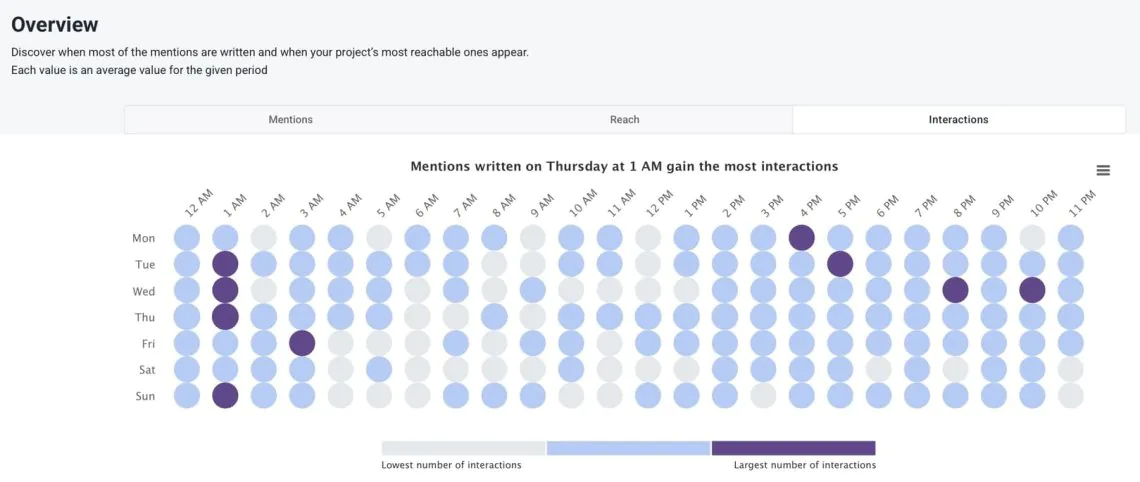
Experimente a ferramenta Brand24. Crie relatórios de mídia social!
Recursos visuais úteis para incluir no seu relatório de mídia social:
- Tabelas, gráficos e diagramas
- Infográficos
- Imagens e capturas de tela
- Mapas
05 Apresentar insights da campanha
Os dados brutos por si só não são úteis.
Você pode ter todos os dados e visualizações de mídia social à sua frente e ainda assim se perguntar: "O que isso significa para minha análise de mídia social?".
O verdadeiro objetivo de um relatório de mídia social não é apenas mostrar estatísticas, mas fornecer insights valiosos que moldarão toda a sua estratégia de conteúdo e orientarão suas futuras campanhas para mais conteúdo gerado pelo usuário.
Por exemplo, tenho certeza de que você ouviu falar do evento Netflix Tudum. Vamos verificar qual é o sentimento do público em relação a ele!

Filtre instantaneamente o ruído e concentre-se no que é importante para a campanha. Por exemplo, ao digitar "tudum" no Brand24, posso acessar todos os mentions em que essa palavra-chave aparece. Seja em postagens, comentários ou artigos.
Isso me permite:
- Entenda o contexto em que a marca está sendo discutida
- Descobrir tendências e preferências de longo prazo
- Acompanhe o sentimento explicitamente vinculado a esse termo
Obtenha os resultados de qualquer campanha de mídia social!
Vamos dar uma olhada mais profunda. Com a análise de emoções, você pode descobrir exatamente como as pessoas se sentem em relação à sua marca, quais são as emoções em torno do tópico direto em tempo real.
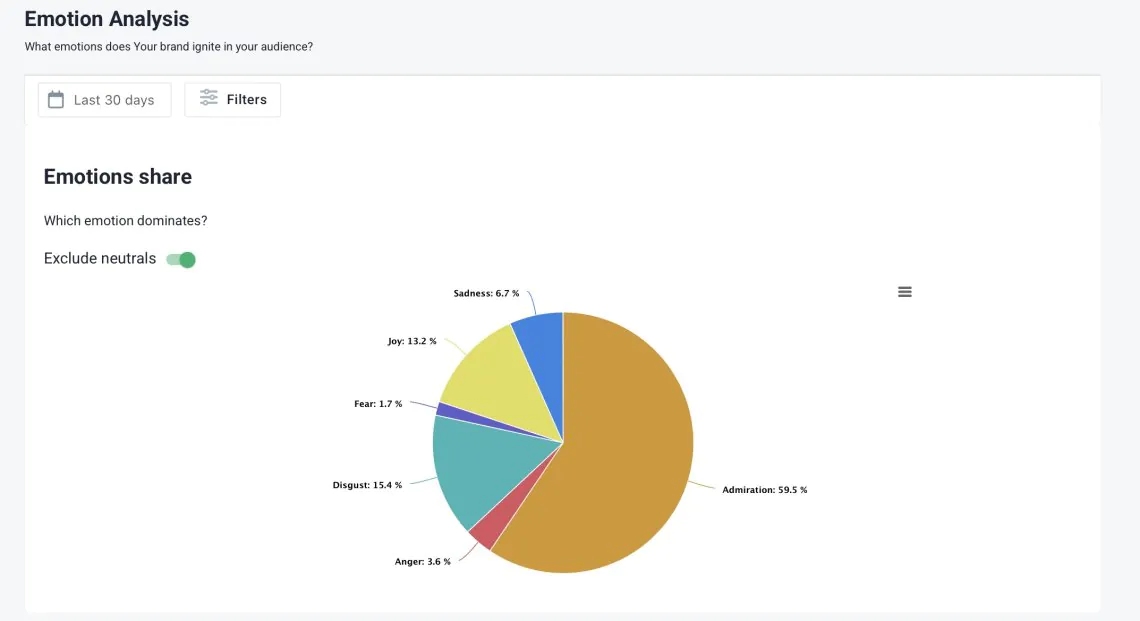
Veja o exemplo do gráfico: a cor laranja no gráfico de barras representa a emoção de admiração, enquanto a cor azul indica aversão.
Quando você vê o laranja começando a ultrapassar o azul, isso é um sinal positivo!
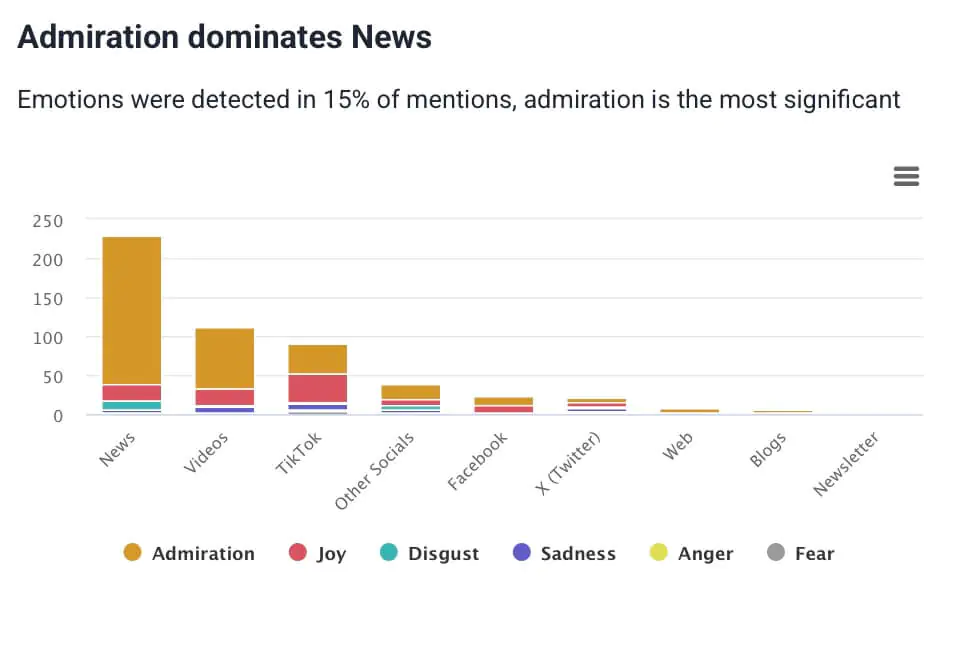
A análise desses mentions emocionais abre as portas para uma análise mais profunda e prática. percepções do cliente. Não se trata mais apenas de números.
Trata-se de entender como as pessoas se sentem em relação à sua marca ou ao seu novo produto e usar o feedback positivo e negativo para avançar de forma mais inteligente.
Descubra como seu público se sente!
06 Comparar dados com períodos anteriores
Muitos modelos de relatórios de mídia social ignoram as tendências de dados de períodos anteriores.
Sem uma referência temporal, é difícil avaliar se o desempenho da mídia social está melhorando ou diminuindo. Os números brutos podem parecer ótimos, mas não contam a história toda; O contexto é tudo.
É aí que Guia Comparação do Brand24 torna-se inestimável.
Com apenas alguns cliques, posso responder a perguntas críticas como:
- Meus esforços estão ganhando força?
- O desempenho dessa campanha é melhor do que o da anterior?
- Qual é o sentimento do público-alvo mês a mês?
Isso significa que posso separar rapidamente cada fase de uma campanha de mídia social e compará-las com apenas alguns cliques.
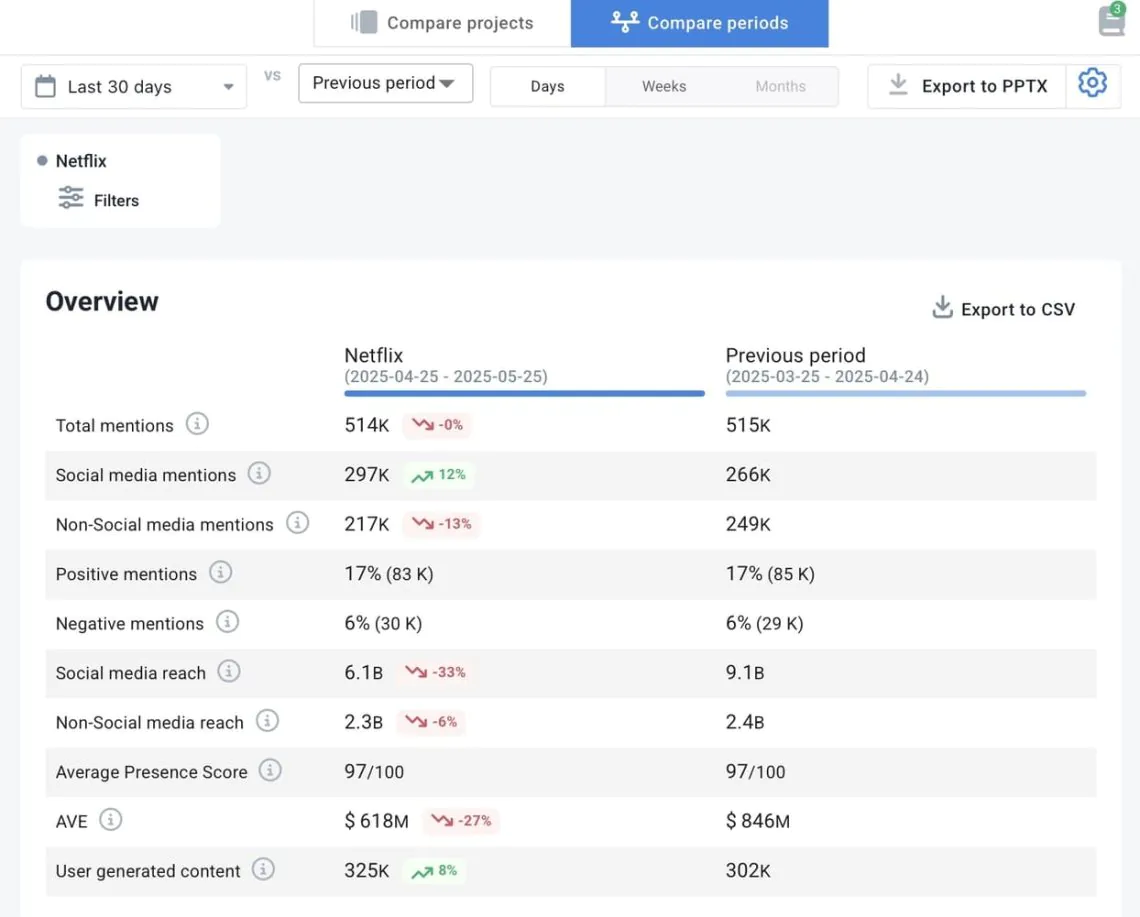
Comparei o desempenho da Netflix durante a campanha TUDUM com os 30 dias anteriores.
Os mentions de mídia social e o conteúdo gerado pelo usuário aumentaram, mostrando um forte envolvimento. Embora os mentions positivos e negativos tenham caído um pouco, isso é comum em campanhas de alto alcance.
Crie seus relatórios de mídia social!
07 Comparar dados com os de seus concorrentes
Acompanhar o desempenho da minha mídia social ao longo do tempo me dá uma visão clara do desempenho dos meus esforços de mídia social, mas, em algum momento, preciso diminuir o zoom e perguntar:
O que está acontecendo no setor?
Como está o desempenho dos meus concorrentes?
Há alguma nova tendência do setor que eu possa estar perdendo?
Pode parecer que meus resultados estão aumentando constantemente, e tudo parece ótimo. Mas se minha concorrência estiver crescendo duas vezes mais rápido, não estou ganhando, estou ficando para trás.
É nesse ponto que a análise competitiva se torna essencial.
Como eu faço isso?
Posso criar projetos para o nome da minha marca, reivindicações de campanhas de marketing específicas, hashtags ou até mesmo produtos individuais. Depende de minhas necessidades.
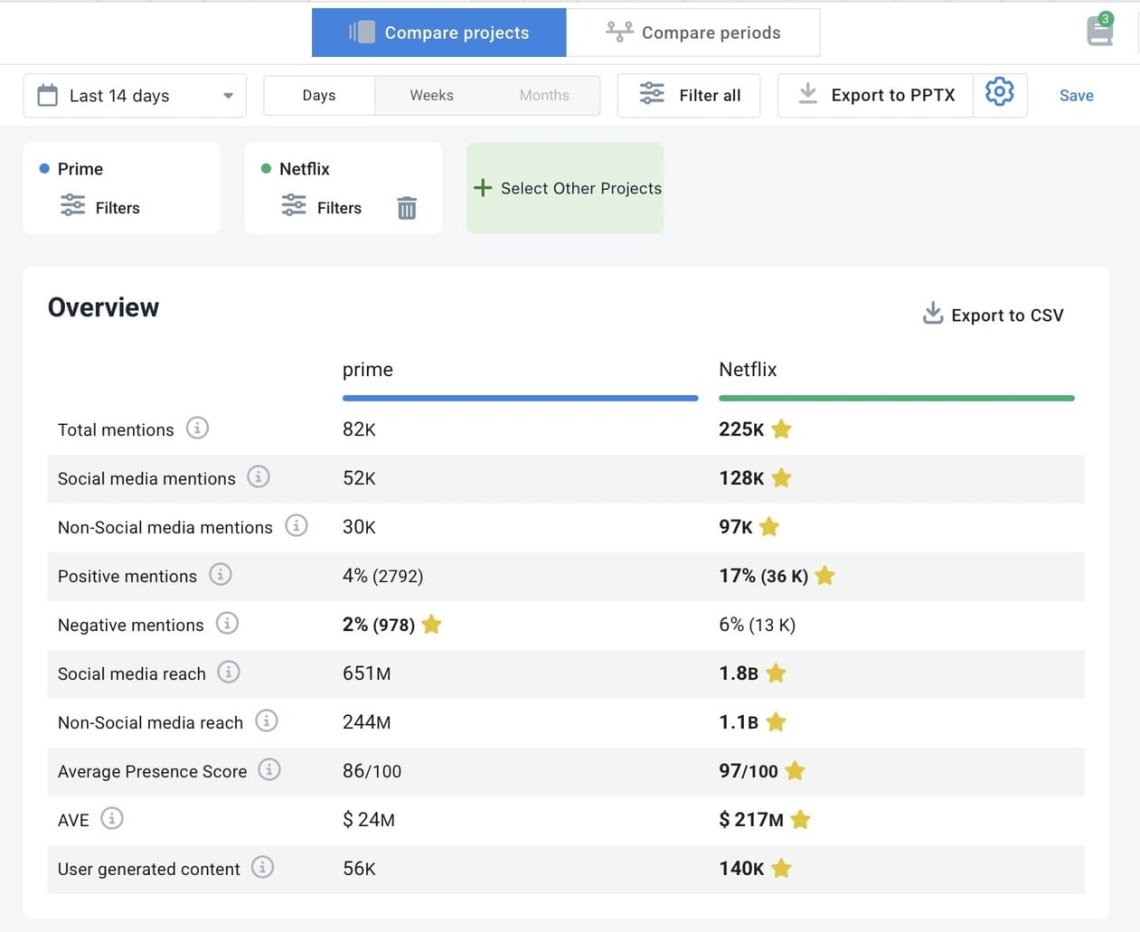
Em seguida, configuro projetos adicionais para cada concorrente que desejo monitorar.
Dessa forma, eu posso:
- Acompanhe seus desempenho da mídia social em tempo real
- Monitorar mentions, sentimento e alcance
- Compare tudo diretamente em um único painel
Ele me permite monitorar meus concorrentes de perto, o que é especialmente valioso para a análise da concorrência. Obtenho insights mais profundos sobre o público e identifico oportunidades de melhorar minha estratégia.
Veja como seus concorrentes estão se saindo!
08 Adicionar resumo
Essas etapas podem não parecer óbvias inicialmente, mas qual é o objetivo de um relatório de mídia social se ele não levar a uma ação?
O valor real vem do fato de tirar conclusões práticas e transformá-las em próximas etapas claras. Isso economiza o tempo das partes interessadas e destaca as principais conclusões e métricas de mídia social que realmente importam.
Um modelo de relatório de mídia social bem estruturado torna esse processo mais fácil e eficiente. Ele não se limita a resumir o passado e orientar o futuro, respondendo às seguintes perguntas:
- O que devo continuar fazendo?
- O que precisa ser mudado?
- Qual é a próxima melhor jogada?
Como eu faço isso:
Primeiro, reviso o documento inteiro para garantir que não perdi nenhuma informação valiosa.
Em seguida, abro um novo arquivo ou nota para escrever uma narrativa curta e direta que inclua:
- Principais conclusões
- Observações e identificação de tendências
- Sugestões ou ideias estratégicas
Em seguida, passo tudo pelo Assistente de marca para verificar se há lacunas. Um prompt rápido como "Me dê um resumo mensal" ou "Criar relatórios trimestrais" me ajuda a identificar qualquer coisa que eu tenha perdido.
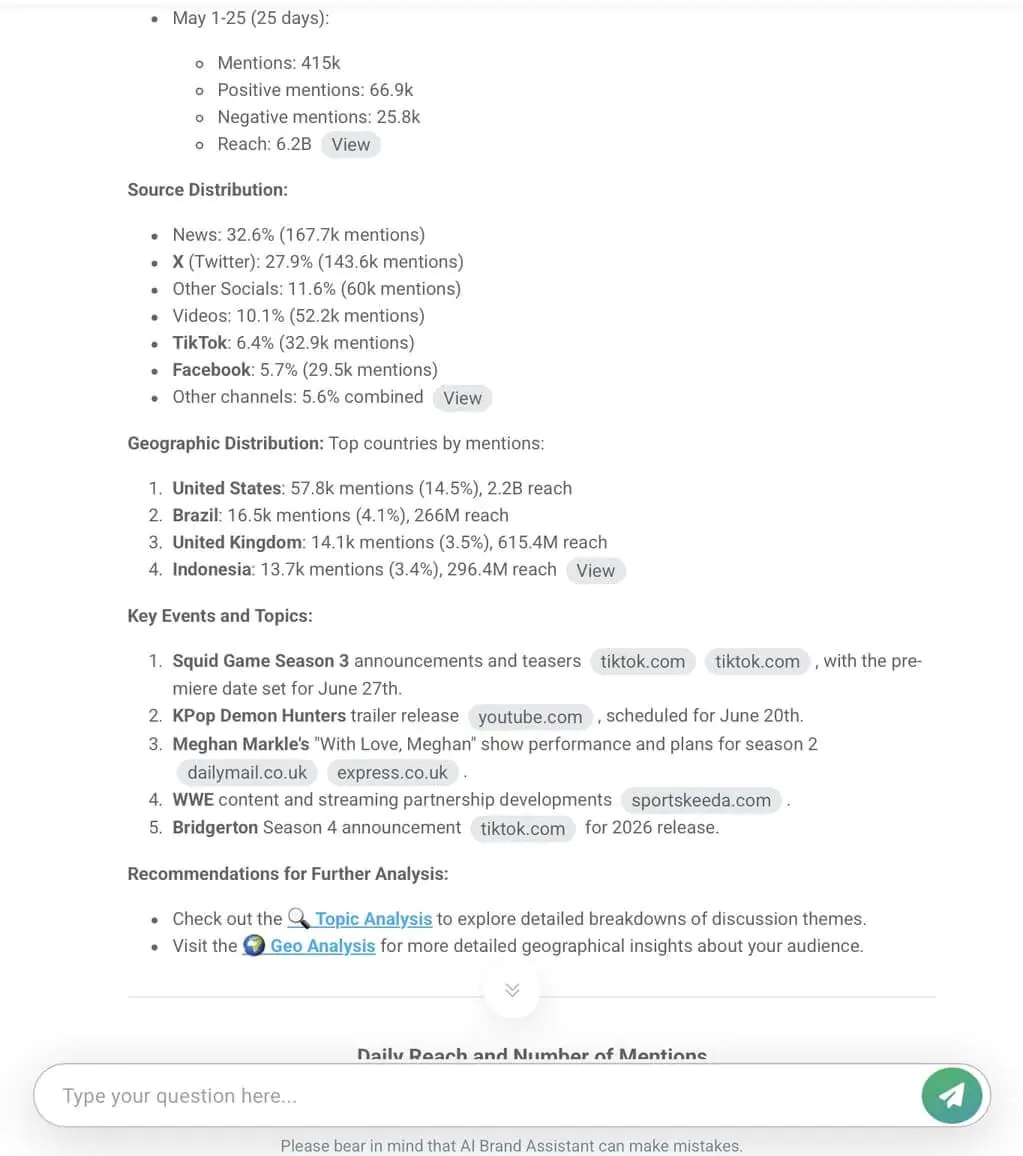
O Brand Assistant fornece respostas com base nos dados internos de seu projeto, não apenas no conhecimento geral. Isso o torna valioso para análise de desempenho, insights sobre o público e recomendações acionáveis.
Deixe a IA resumir a conversa sobre sua marca
Aqui está uma lista de solicitações de mídia social que você pode usar com Ferramentas de marketing com IA:
8 prompts de IA para relatórios de mídia social
- "Forneça um resumo do desempenho da mídia social da nossa marca nos últimos 7 dias no Instagram, Facebook e LinkedIn. Inclua o alcance total, a taxa de engajamento, as três principais publicações por plataforma e uma visão de uma linha para cada uma delas."
- "Liste as três publicações com o maior envolvimento na semana passada (curtidas, comentários, compartilhamentos). Explique o que provavelmente contribuiu para o sucesso delas: momento, formato, tópico ou visual?"
- "Quais hashtags geraram o maior alcance e engajamento em nossas publicações sociais no mês passado? Agrupe-as por plataforma e sugira 3 novas ideias de hashtag com base nas tendências."
- "Analise todos os mentions da marca do mês passado no Twitter, TikTok e Instagram. Forneça um detalhamento do sentimento (positivo/neutro/negativo) e sinalize quaisquer picos com contexto."
- "Faça um resumo dos comentários negativos ou temas de feedback mais comuns sobre nossa marca neste mês. Inclua exemplos de citações e sugira duas ações concretas para abordá-los."
- "Compare nossos KPIs de mídia social (alcance, impressões, taxa de engajamento, taxa de cliques) deste mês com o mês passado. Destaque o que melhorou, o que diminuiu e as causas prováveis."
- "Escreva um resumo conciso e visualmente amigável do nosso desempenho mensal nas mídias sociais. Use marcadores e emojis para torná-lo adequado para o Slack ou atualizações internas por e-mail."
- "Analise o Twitter e o TikTok em busca de tendências emergentes em nosso setor (por exemplo, bem-estar, tecnologia, moda). Liste três tópicos ou formatos emergentes que devemos considerar, com exemplos de postagens e dados de engajamento."
![Prompts de IA para mídias sociais: [lista completa]](https://brand24.com/blog/app/uploads/2023/05/AI-Prompts-social-media-report.jpeg)
Pergunte qualquer coisa ao seu assistente de marca!
Modelo e exemplos de relatório de mídia social
Os relatórios de mídia social são essenciais. Eles o ajudam a acompanhar o crescimento, avaliar o desempenho e alinhar sua estratégia. Mas vamos ser honestos: eles podem consumir muito tempo, especialmente quando várias partes interessadas aguardam atualizações.
É aí que um modelo sólido de relatório de mídia social faz toda a diferença. Abaixo estão exemplos importantes e modelos para download para economizar tempo, manter-se organizado e fornecer insights importantes.
Exemplo de análise competitiva
Sempre inclua insights detalhados sobre os concorrentes em seu relatório de mídia social.
Por quê? Porque seu desempenho só faz sentido quando visto dentro de um contexto.
Com os relatórios de concorrentes do Brand24, isso é fácil. Você obtém os principais KPIs, como alcance social, sentimento e compartilhamento de voz, logo de cara.
Meu recurso favorito é que posso personalizar um relatório adicionando meu logotipo e cores para mantê-lo consistente com o da empresa.
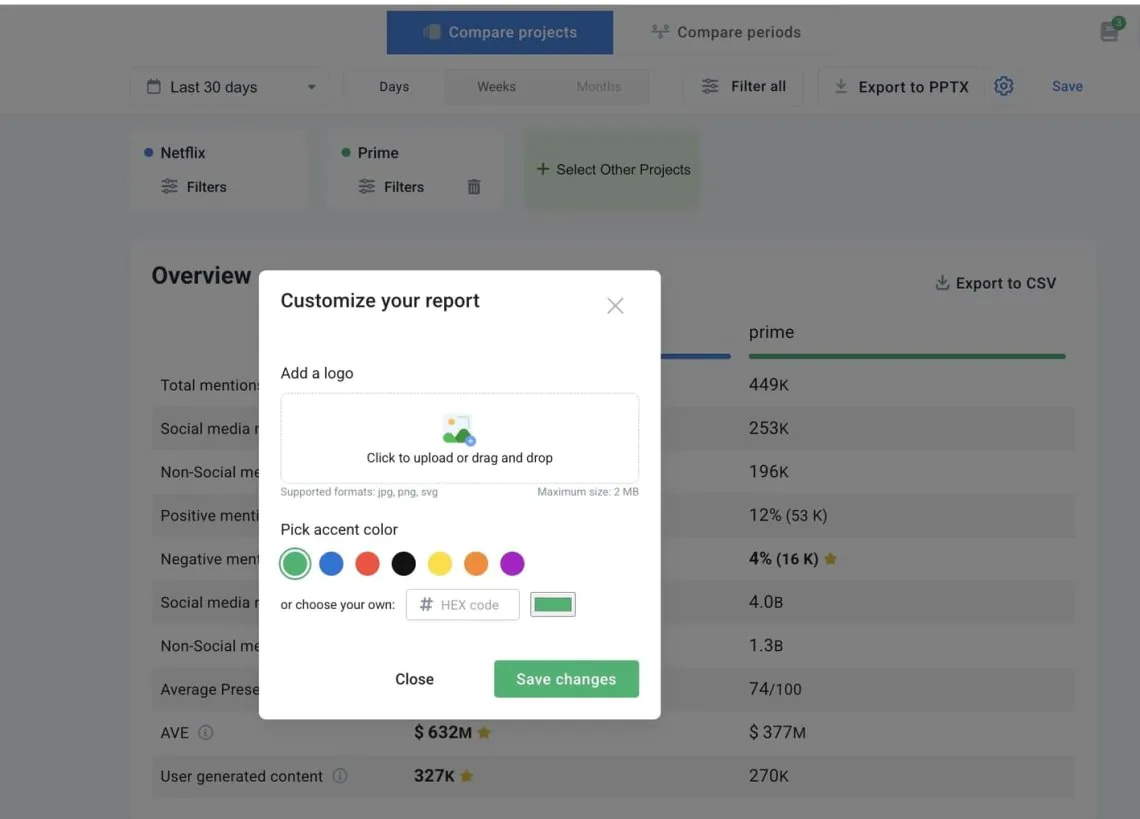
Personalize seu relatório de mídia social!
Relatórios de campanha
Os gerentes de mídia social sabem como é importante acompanhar novas campanhas, criar relatórios de mídia social e reunir dados de desempenho relevantes e percepções do público.
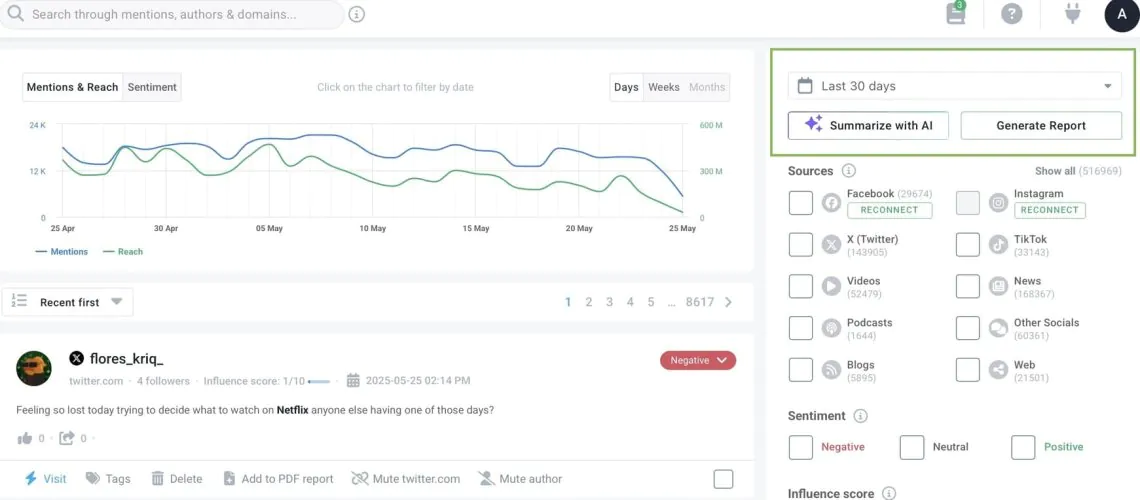
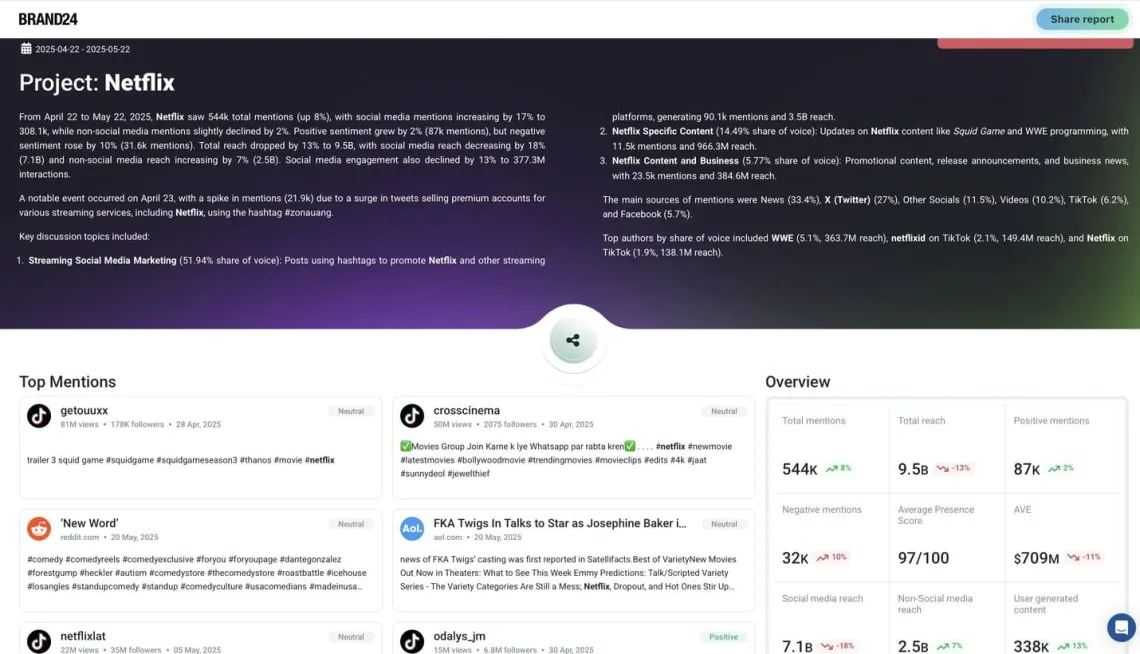
Com o painel principal do Brand24, você pode gerar relatórios QuickShare em segundos. Rápido, interativo e sem análises profundas que consomem muito tempo.
Basta clicar em "Generate Report" (Gerar relatório) à direita.
E explore instantaneamente dados detalhados de cada publicação de mídia social.
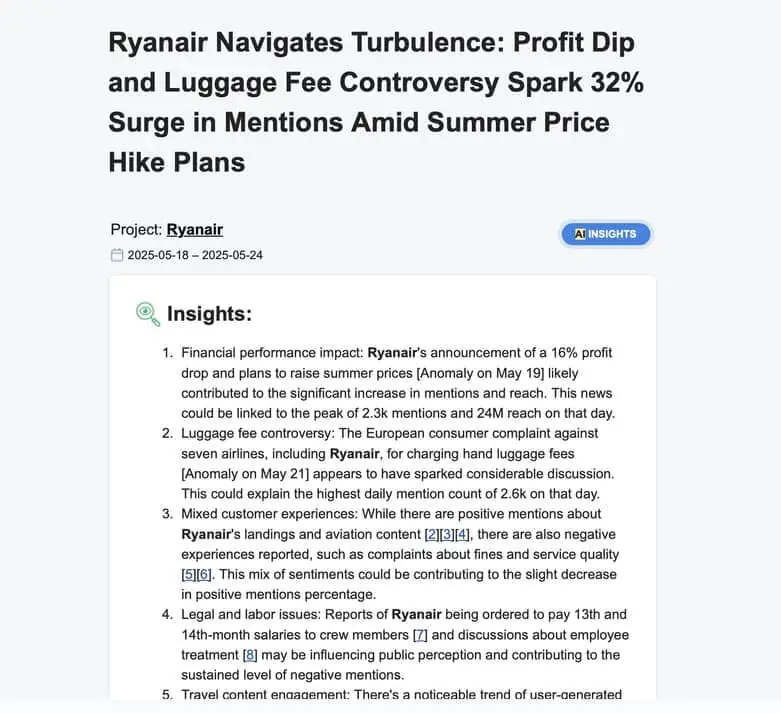
Você também pode configurar semanalmente relatórios abrangentes com tecnologia de IA, que são enviadas diretamente para sua caixa de entrada.
Eles fornecem insights importantes sobre o público, destacam tendências e fornecem recomendações acionáveis com base nos dados de desempenho mais relevantes.
É uma maneira inteligente de se manter à frente, sem perder uma única tendência.
Receba seus relatórios semanais automatizados de mídia social!
Relatórios específicos da plataforma
Cada plataforma de mídia social acompanha as métricas de engajamento de forma diferente; nem todas as campanhas são executadas em todos os canais. Por isso, é essencial ter uma ferramenta flexível de relatórios de mídia social que mantenha tudo no contexto.
Com o Brand24 Na guia Analysis, posso criar relatórios personalizados com com apenas alguns cliques. Posso filtrar por contas específicas de mídia social, período de relatório, autores, locais ou domínios externos.
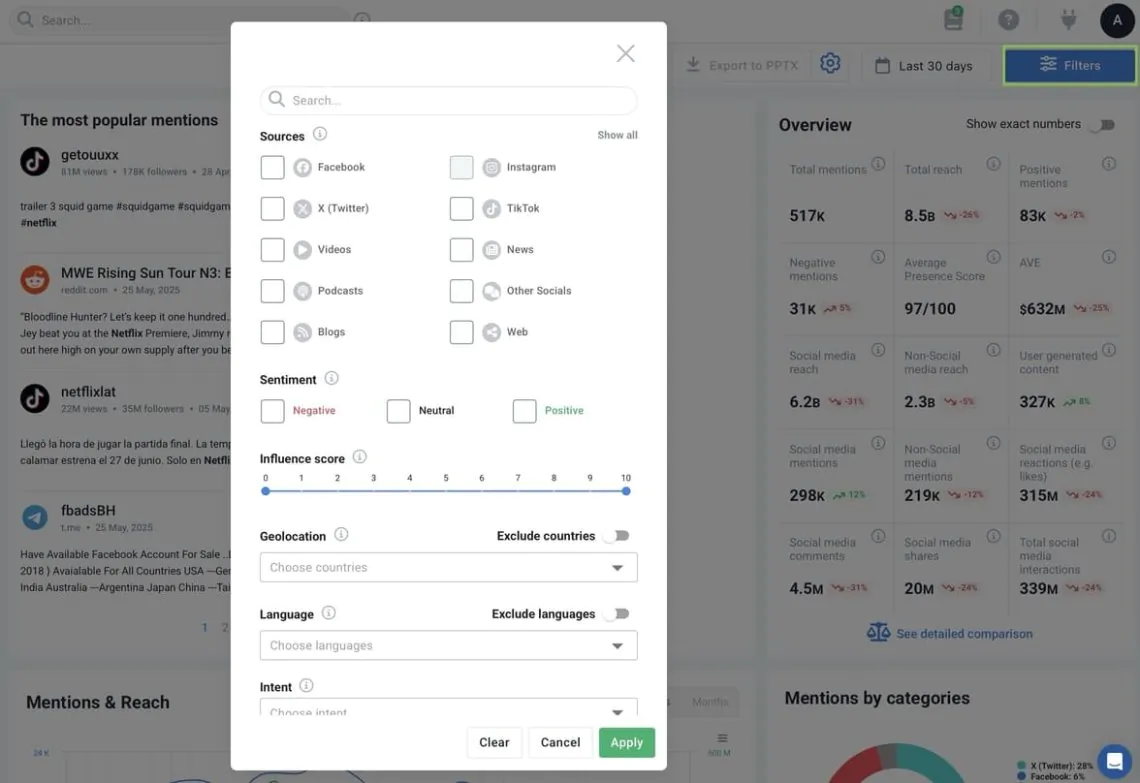
Ele é perfeito para rastrear métricas de desempenho, criar relatórios personalizados e comparar resultados entre vários canais de marketing e outros canais de marketing. Tudo em um só lugar.
Transforme os Mentions on-line em relatórios práticos!
Boas práticas para criar um relatório de mídia social
Aqui estão algumas dicas para fazer seu relatório de mídia social como um profissional!
01. Automatize seu relatório
Muitos ferramentas de relatórios de business intelligence permitem que você automatize partes do processo de geração de relatórios; use-os!
Seja extraindo dados, gerando gráficos ou criando modelos recorrentes, a automação facilita seu trabalho. Ela libera mais tempo para se concentrar no lado estratégico dos relatórios de mídia social.
Abaixo, você pode ver como automatizar as notificações para enviá-las diretamente à sua equipe ou ao Slack:
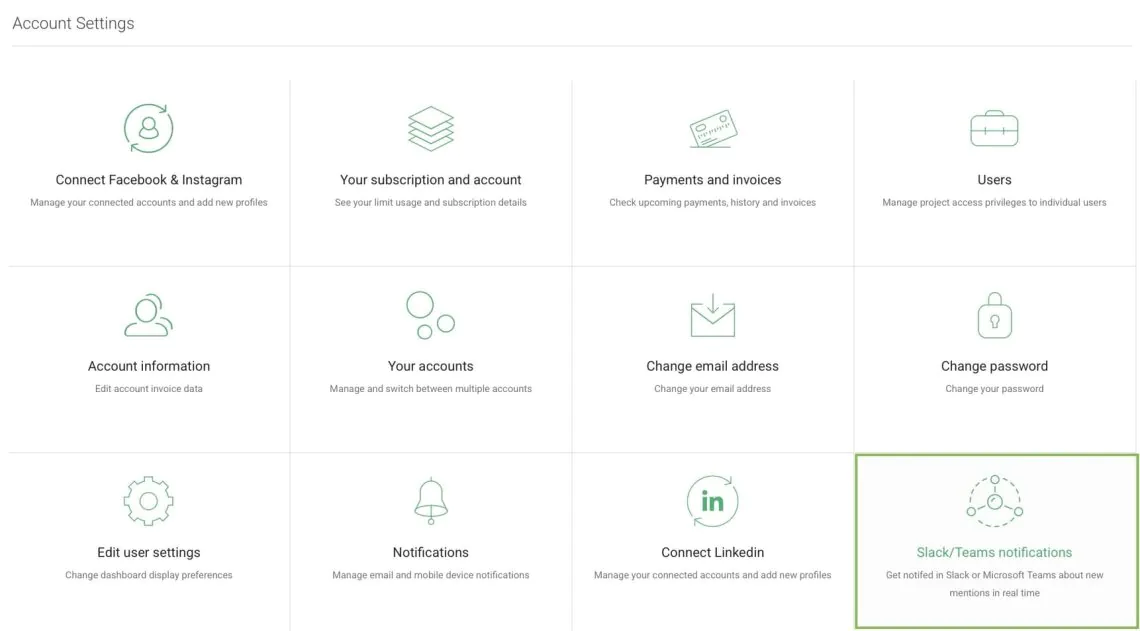
Fique por dentro do que está acontecendo com sua marca!
02. Personalize seu relatório
Os modelos de relatórios de mídia social são um ponto de partida fantástico, mas não são sagrados.
Se algo não se adequar às suas necessidades, altere-o. Adicione métricas que sejam importantes para você. Altere a estrutura. Abandone uma seção se ela não agregar valor.
Não tenha medo de personalizá-lo!
03. Make little breaks
Adicionar pequenas pausas em seus relatórios ajudará a manter o público-alvo concentrado. Não os sobrecarregue com muitas informações de uma só vez!
Você pode incluir itens como:
- Imagens engraçadas ou memes
- As postagens de mídia social ou vídeos curtos com melhor desempenho
- Comentários ou depoimentos de usuários


