Does your company make use of data? 97% of $50MM companies invest in business analytics, and you should, too! There’s no need to invest gigantic amounts of money; just start by using business analytics tools. They’ll drive your decision-making process.
Business analytics tools are software solutions that collect and analyze both quantitative and qualitative data, turning it into actionable insights. They include a wide range of software. However, they all play a crucial role in supporting decision-making, enhancing operational efficiency, deepening customer insights, and driving business growth.
No matter your industry, business analytics is your key to success.
Now, let’s dive into the top tools that can help you get there!
What are business analytical tools?
Business analytical tools (also known as business intelligence tools, business intelligence solutions, business analysis tools, or data analytics tools) provide data aggregation, data mining, forecasting, and visualization.
Thanks to them, you can:
Collect and analyze real-time data for faster and smarter decisions
Gain a comprehensive view of different areas in your organization
Identify weaknesses of your business
Solve urgent problems before they escalate
Forecast future trends
Business analysts commonly use these tools.
However, they’re widely adopted not only by companies with dedicated departments but also by those without.
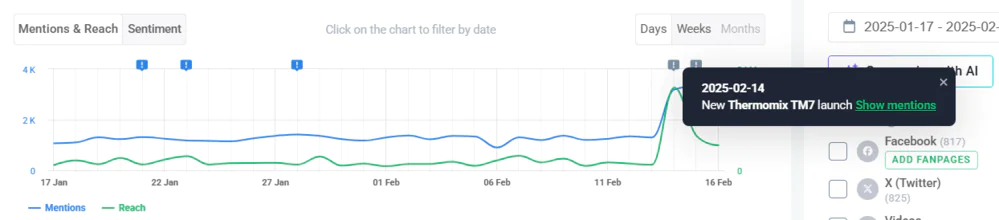
For example, it quickly explains unusual spikes in mentions and reach!
Did you notice that the internet is buzzing about Thermomix? 3,185 mentions reached almost 20 MILLION people in one day!
You don’t have to be Sherlock Holmes anymore to find the cause!
The Anomaly Detector says this is due to the new Thermomix TM7 launch.
Brand24: Anomaly Detector – business analysis for Thermomix
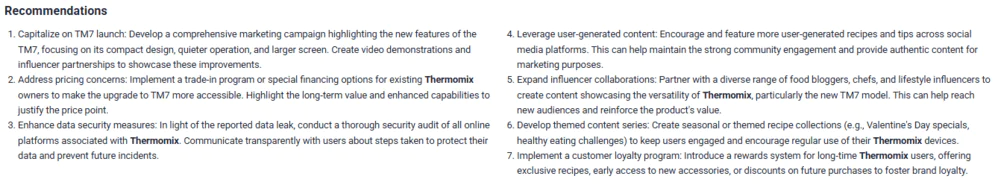
Moreover, Brand24 can extract valuable insights from big data sets, identify trends, and provide tailored recommendations.
Brand24: AI Insights – recommendations for Thermomix
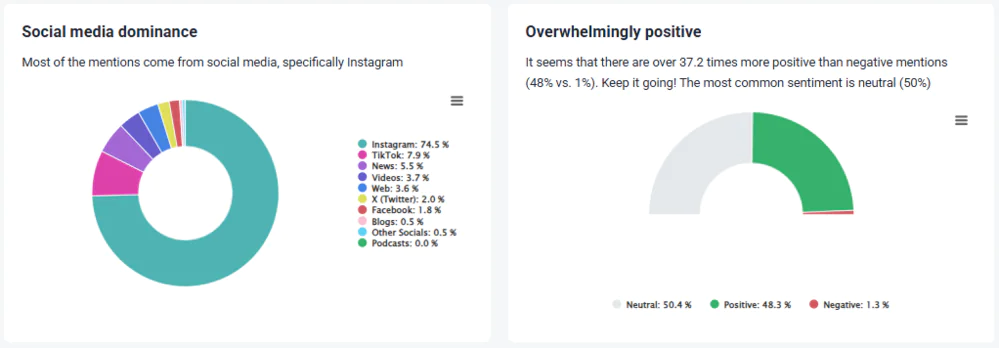
Brand24, in its Metrics Analysis, provides a neat summary of your data!
Also, thanks to this feature, you don’t have to go through all the dashboards to find what you want. Everything is in one place with ready-to-use insights.
Brand24: Metrics Analysis – source dominance and the most common sentiment of Thermomix
✨ Key features:
Advanced data analysis
AI-powered features: Sentiment Analysis, Emotion Analysis, Topic Analysis, AI Insights, Metrics Analysis, Intents Analysis, Anomaly Detector, AI Brand Assitant
Customizable reports
Multiple data sources
Real-time alerts
Interactive dashboards
💁 Who is it for:
It’s a solution for enterprise-scale analytics, perfect for businesses monitoring their online presence and customer feedback. But also agencies managing multiple clients.
💪 Pros:
Many AI features
Dynamic and easy-to-adjust visualizations
👎 Cons:
Brand24 is unable to provide historical data. Data aggregation begins the moment you start monitoring a specific keyword.
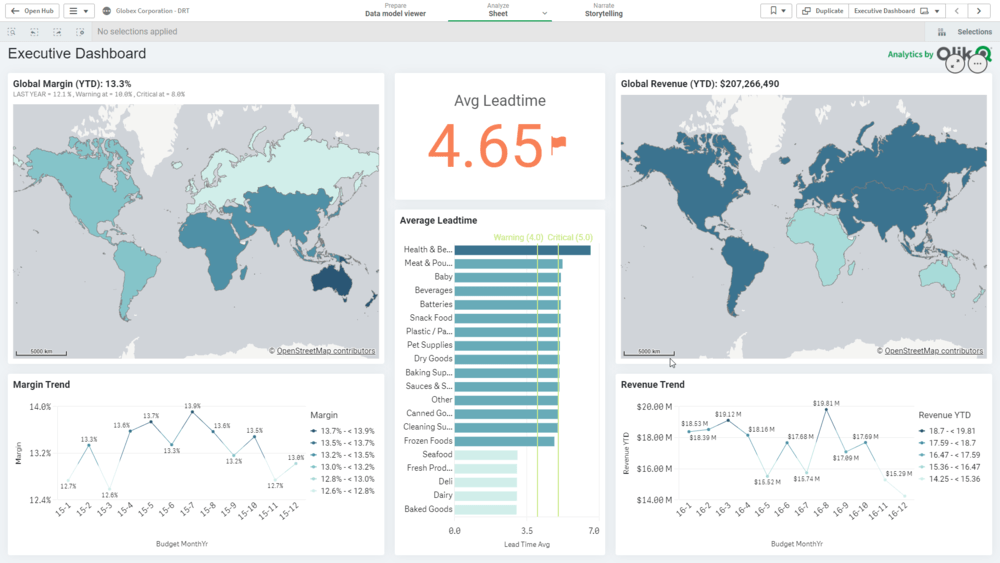
Qlik Sense is considered to be the best data science platform.
Thanks to ML (machine learning) and AI, Qlik Sense provides excellent opportunities for any user regardless of skill level – it creates and prepares data, offers advanced predictive analytics, and automatically generates key insights.
You can connect and combine data from hundreds of sources, including Dropbox, Azure, Google Cloud, and Microsoft Excel.
✨ Key features:
Search and conversational analytics capabilities
Interactive dashboards
Automated AI-generated insights
💁 Who is it for:
It’s for large companies (such as retailers, pharmaceutical companies, tech companies, finance companies, etc.) to perform in-depth analyses of vast amounts of data. For example, track sales performance and manage inventory.
💪 Pros:
Easy collaboration through the hub
👎 Cons:
Experts are needed to implement it.
Qlik Sense
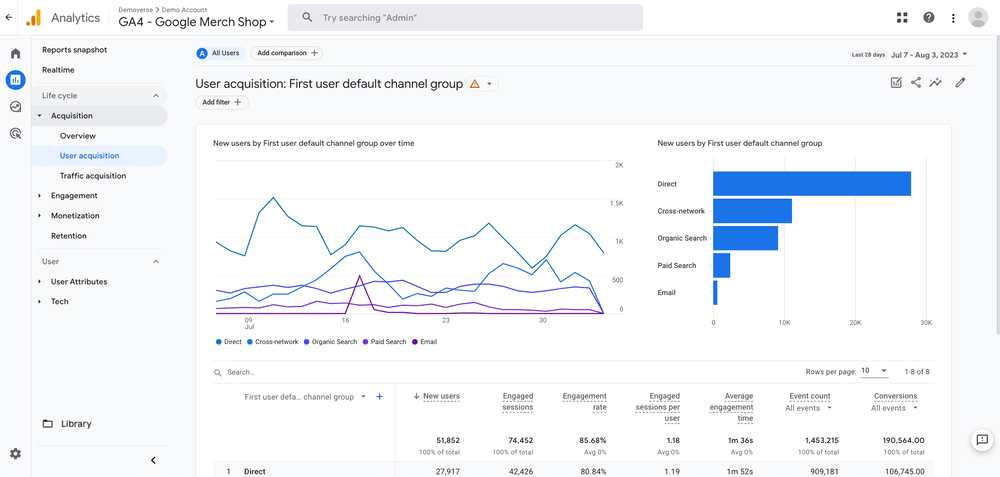
03 Google Analytics
I’m sure you are familiar with Google Analytics – it’s classified as business analytics software.
It gathers and analyzes real-time data about user behavior on your website or app.
This free tool lets you see where visitors come from, from what device, and how long they stay with you.
It reports in real-time and provides drag-and-drop, easy-to-read charts.
✨ Key features:
Predictive capabilities
In-depth website performance insights
Real-time reports
💁 Who is it for:
It is ideal for marketers and website owners who want to understand their website and app performance.
💪 Pros:
Seamless integration with other Google solutions
👎 Cons:
While this tool is powerful, it may not be enough if you need to analyze data beyond your website.
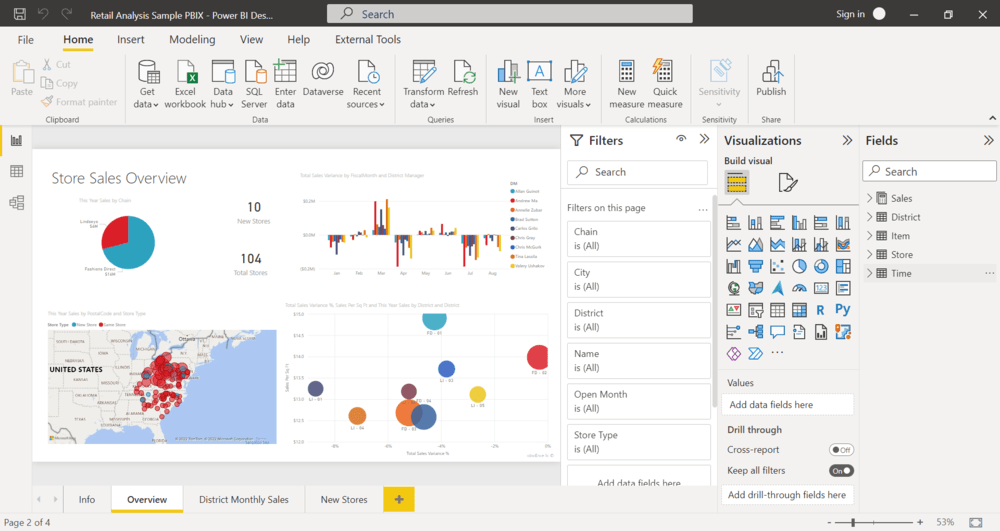
Microsoft Power BI is one of the best-known business analytics tools, if not the most famous. As the name itself says, it’s a Microsoft product.
What can you do with this business intelligence tool?
You can quickly combine data from different sources, create visualizations, and gain interactive insights.
Microsoft Powe allows you to create business analytics reports like a PRO and easily understand the data!
✨ Key features:
Automated analytics
AI features like image recognition and text analysis
Quick, meaningful insights
💁 Who is it for:
I recommend this tool to large companies that manage massive data volumes and those associated with the Microsoft ecosystem.
💪 Pros:
Seamless integration with other Microsoft products
Mobile app available
👎 Cons:
IMO, the data mining progress of this tool takes a little bit too long compared to its alternatives.
Microsoft Power BI
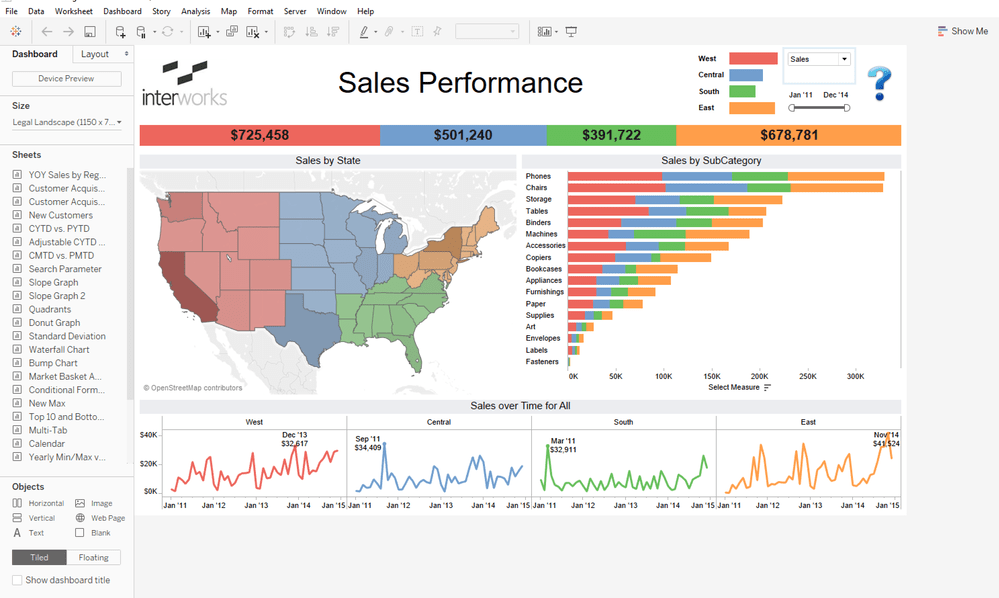
05 Tableau
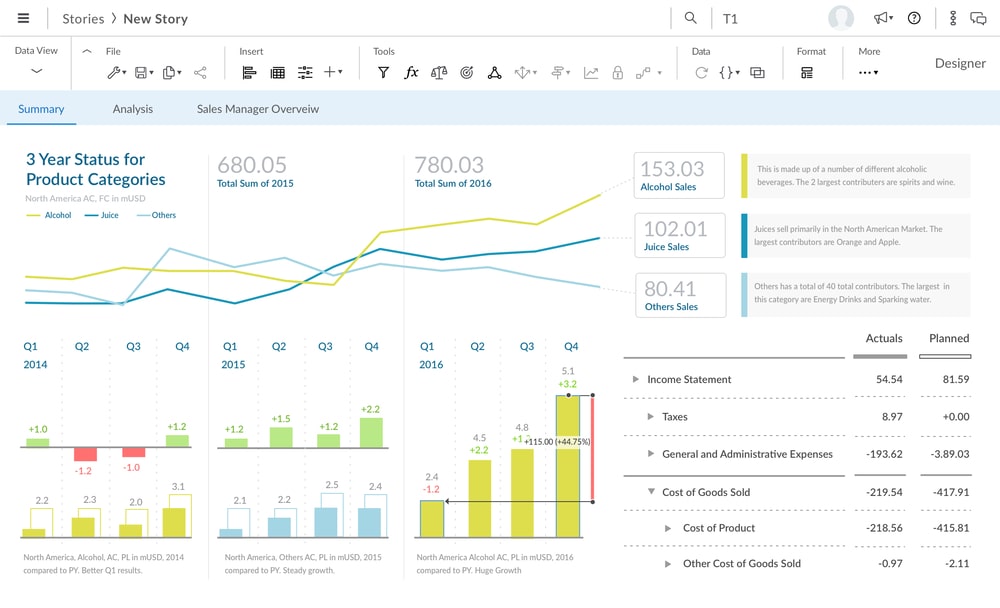
Tableau is a business intelligence system that transforms raw data into powerful visualizations.
This tool can be integrated with platforms such as Google Analytics or Salesforce. Joining multiple data sources is very easy!
Statistical analysis in this tool enables the prediction of patterns based on current and historical data.
✨ Key features:
Statistical analysis
Limitless data exploration
Connection to multiple sources
💁 Who is it for:
It’s well-suited for business analysts, data science specialists, and decision-makers in various industries looking for data management and exploration through interactive visualizations.
💪 Pros:
High-quality data visualizations
Interactive and intuitive interface
👎 Cons:
The enterprise version of this tool turns out to be more expensive than its alternatives.
Tableau
Use business analysis to take your organization to the next level!
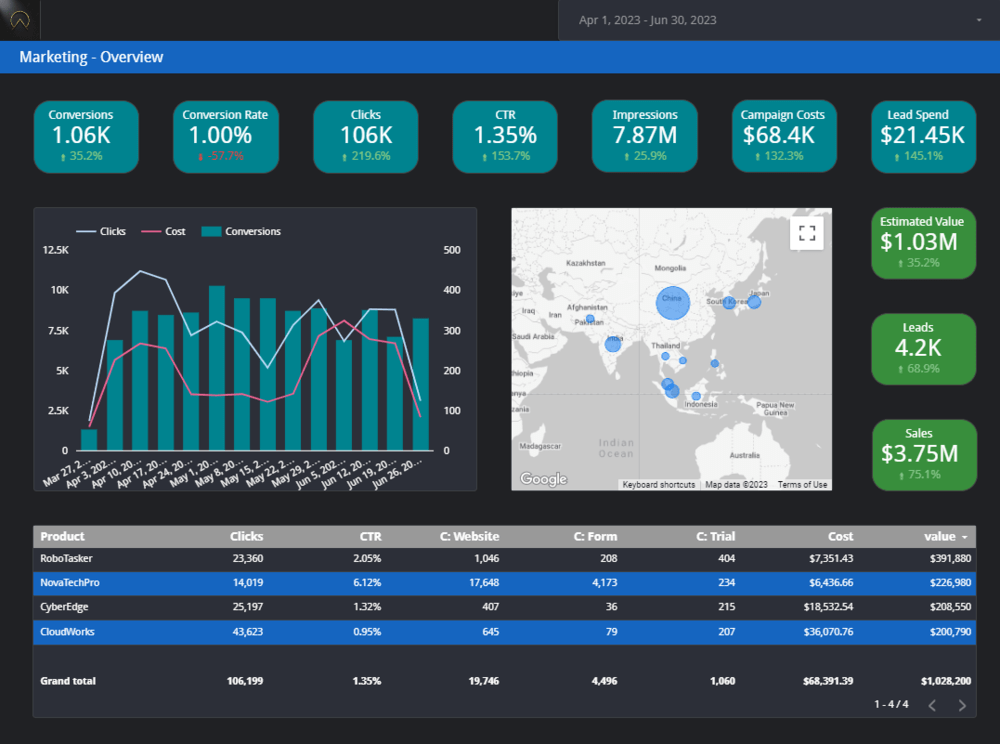
Looker Studio is another analytics software. Until 2022, it was called Google Data Studio.
It’s a simple solution that combines data from various services such as Google Analytics, Google Ads, YouTube, Google Search Console, or Firebase.
Thanks to it, you can easily track the results of your marketing and sales campaigns and monitor customer behavior on a website or app.
Looker Studio is free!
✨ Key features:
Data mining
Configurable data visualization
Reporting
💁 Who is it for:
Because it’s free, it’s excellent for micro-businesses, startups, and all other companies with limited budgets who want to make data-driven decisions in marketing.
💪 Pros:
Very easy to use
Built-in sample reports
👎 Cons:
Sometimes, it tends to freeze if you work on reports containing large datasets.
Looker Studio
07 Zoho Analytics
Zoho Analytics is classified as a group of business intelligence tools designed for robust insights. It’s available in both online and on-premise versions.
In Zoho Analytics, you can merge data from different sources and departments of your company.
The tool is easy to use, so you can effortlessly create cross-functional reports and dashboards.
It also provides in-depth CRM (Customer Relationship Management) analytics in a separate tool called Zoho CRM.
✨ Key features:
Unified business analytics
Analyze data from different sources
Drag-and-drop interface
💁 Who is it for:
It’s a tool that can be used across various departments but is particularly tailored for sales and marketing professionals.
💪 Pros:
Wide range of APIs
Mobile app available
👎 Cons:
Some features don’t work as expected. For example, adding a new filter requires resetting all the existing ones.
Zoho Analytics
Looking for the best business analytics tool for marketing? Try it now!
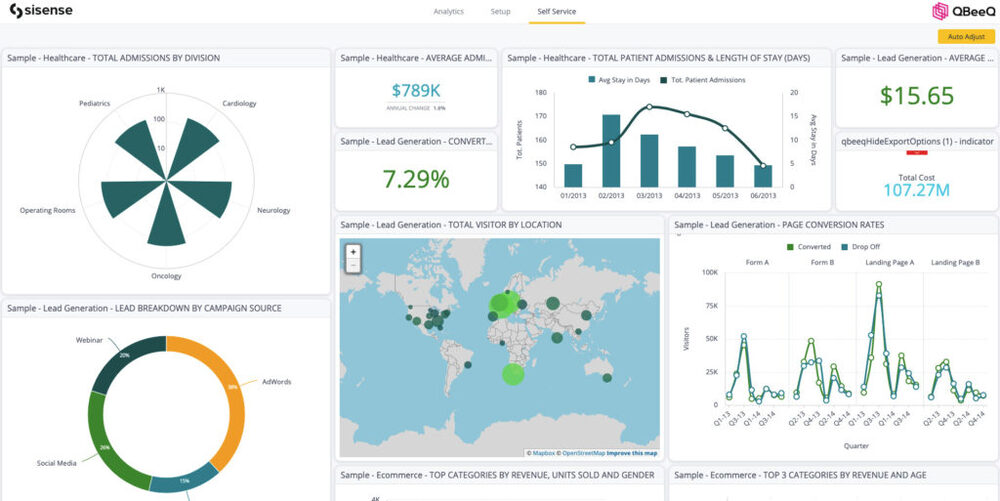
Sisense is a cloud analytics platform designed to perform extensive analysis and visualizations. Its many advanced features transform raw data to uncover actionable insights.
Sisense can easily forecast trends and patterns based on the data provided.
Professionals (data analysts and data scientists) consider Sisense a high-speed business analytics tool.
✨ Key features:
AI-powered big data analytics
Data visualization
Self-service reporting
💁 Who is it for:
It’s a perfect solution for companies in medium-scale industries requiring enterprise resource planning.
💪 Pros:
Seamless integration
👎 Cons:
Sisense has few learning resources, and there aren’t many online, which can be tough for users.
Sisense
09 Domo
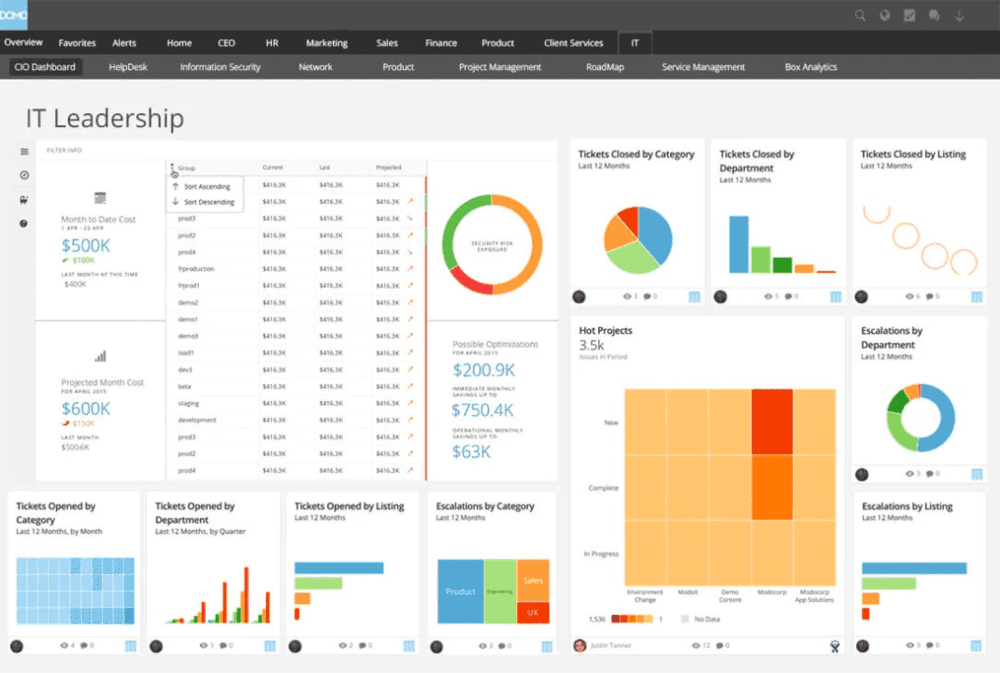
Domo is a comprehensive cloud-based business analytics platform.
This business analytics tool is a good fit for most analytics use cases, such as solid visualizations, marketing and sales analytics, and financial analytics.
It also provides direct access to business data via any device and without relying on the IT department.
What’s more, Domo offers an exceptional mobile app experience!
✨ Key features:
Data preparation and data mining
Advanced data analytics
Drag-and-drop interface
Real-time collaboration
💁 Who is it for:
It’s perfect for different teams in enterprise-level businesses.
💪 Pros:
Wide range of connectors and integrations
Exceptional mobile app
👎 Cons:
Domo launches new features quite often. You may have a hard time keeping up with it.
Domo
Start data mining – process raw data into valuable insights!
SAP Analytics Cloud is a leading cloud analytics platform and the most advanced tool mentioned in this article.
It uses machine learning algorithms to uncover hidden patterns and forecast future outcomes. This enables it to predict market changes and effectively minimize risks.
Furthermore, this tool offers integrated planning and budgeting features. It streamlines financial planning processes and improves decision-making accuracy, which is useful in big enterprises.
✨ Key features:
Ad-hoc analyses and planning
High-quality data visualization
💁 Who is it for:
SAP Analytics Cloud is perfect for businesses already using SAP’s enterprise resource planning (ERP) tools. Ideal for ideal for advanced business analysts.
💪 Pros:
Connection to various on-premise and cloud data sources
Seamless integration with SAP systems
👎 Cons:
As it is a very advanced tool, the implementation is complex. If you decide to use SAP Analytics Cloud, expertise may be required.
SAP Analytics Cloud
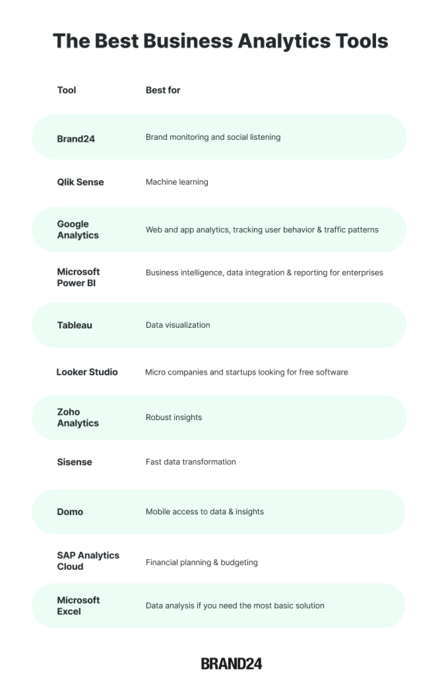
11 Microsoft Excel
You may wonder what Excel is doing here…
Microsoft Excel is one of the statistical tools. Compared to the other analytics tools presented here, it’s elementary but enough for some people.
As you may know, Excel is not automated and does not provide advanced analytics features (for example, it doesn’t predict future trends).
You can use it to organize data and create visualizations in various forms, such as scatter and radar charts.
✨ Key features:
Data preparation and organization
Mathematical, statistical, financial, and logical operations
What-if analysis
💁 Who is it for:
For anyone who needs to create charts or graphs to organize and visualize data for everyday use.
💪 Pros:
Easy sorting and filtering
Most people already know Excel, so you don’t have to invest your time to learn it
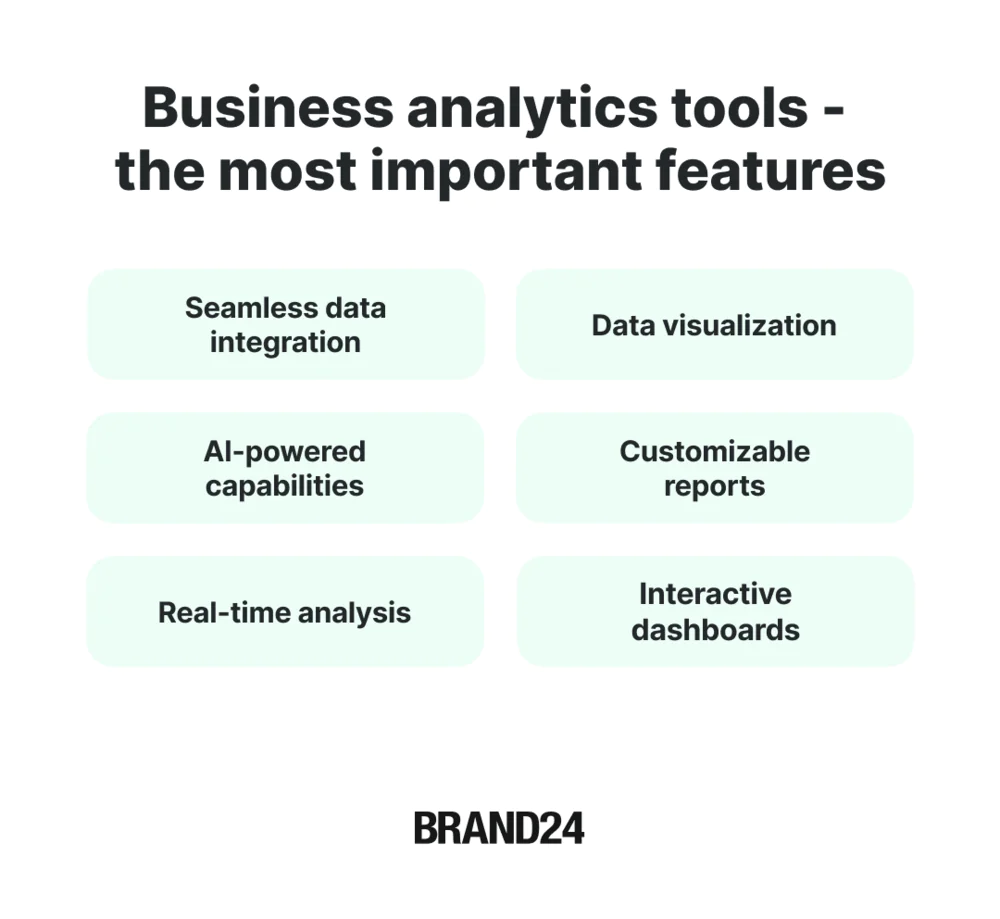
What are the most important features of a business analytics tool?
The most important features of the best business analytics tool are:
01 Seamless data integration
Any reliable tool should be able to integrate data from different sources and business systems. Comprehensive data integration ensures a holistic view of your business.
Always check if the tools integrate with different business systems and sources you need.
02 AI-powered capabilities
Advanced business analytics tools leverage AI for pattern recognition, future trend forecasting, anomaly detection, and predictive analysis.
If the tool is not AI-powered, it’s not worth trying!
03 Real-time analysis
The best tool must analyze data in real-time. Any delay in the analysis is not acceptable.
In today’s fast-paced world, you need immediate access to critical metrics and trends to stay competitive and make timely decisions. It keeps you ahead!
04 Data visualization
A wide range of data visualizations helps to understand data.
Good visualization is the key to effective insights. Whether through charts, graphs, or heatmaps, the proper visual representation allows you to spot trends and identify patterns.
05 Customizable reports
The tool should generate business analytics reports you can easily customize for your needs.
For example, when presenting a report to your boss, you won’t have to search for the information you need in a maze of unnecessary details. You’ll show him a report with what interests him.
06 Interactive dashboards
Essential! They make data reading easy, and you can customize the view for your needs, for example, by selecting the metrics you want or applying filters.
Beyond tools: human-led analysis
Brand24 and most business analytics tools help you collect and visualize data. But what if your team needs help interpreting that data strategically?
You know, beyond dashboards and charts.
All the business analytics tools we talked about above are powerful. They collect data. They show trends. They help you answer some critical questions.
But data alone doesn’t always make decisions easier.
Insights24 is a strategichuman-led analytics service, not just another software platform. It takes data (including Brand24 outputs) and transforms it into clear business recommendations. Unlike tools alone, Insights24 delivers custom analysis, deep trend interpretation, and strategic reports tailored to your goals.
These reports are ideal for executive decision-making, competitor benchmarking, and campaign evaluation.
Tools give you the data, but Insights24 helps you understand what that data means and what to do next.
Insights24 helps teams answer critical questions like: Why is my competitor growing faster than me? Which product feature will actually increase retention? Where should I invest next quarter’s budget?
So, if your organization is ready to move from raw data to real strategic direction, Insights24 is the partner to call.
Conclusion
A company without data is like a car without fuel – it stands still.
That’s why collecting and analyzing data is crucial! Complex data allows you to make decisions that will drive your business.
Discover our client’s success story — read the case study.
Which business analytics software should you choose? It depends on your specific needs.
Final thoughts:
To make data-driven decisions, you need the right business analytics tool.
One analytics platform can combine data from various sources, giving you a more comprehensive view.
Whether monitoring your brand online, analyzing your website, or integrating resource data, there’s a business analytics tool for every purpose and company size.
An essential aspect of the tool is prescriptive analytics; it recommends what needs to be done to achieve the desired results.
Before buying a tool, it is worth starting a free trial to be fully convinced.
Data analysis? You can do it without being a data expert; use business analytics tools 👉 Try Brand24 for free! 👈