Feature Update: PDF Reports
Brand24 has a few ways to export data from your projects and make use of it outside the tool. One of them, PDF reports, have just got a huge facelift. But there’s more than the facelift – there’s more data.
PDF reports have always been of massive value to a great deal of our dear customers. They’ve been using reports to present data about online presence to their customers, their team leaders and share results within teams.
The update we’ve just rolled out is a boost both to the contents and the design of the report. Here’s what’s new:
- New design
- Way, way, way more pieces of data
- Customizable contents
- Optional features
- How to create your report
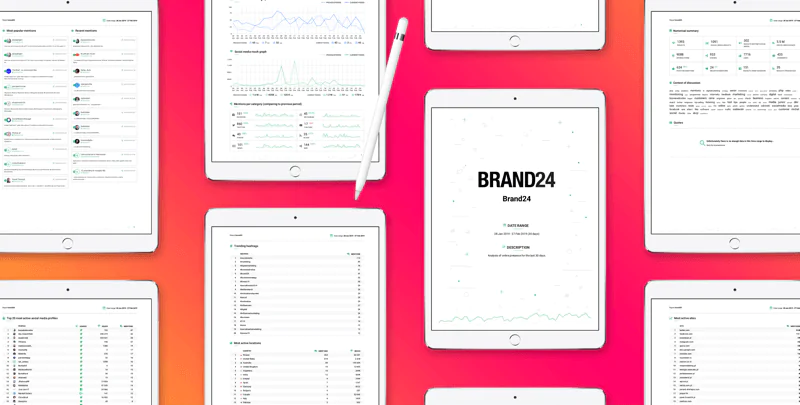
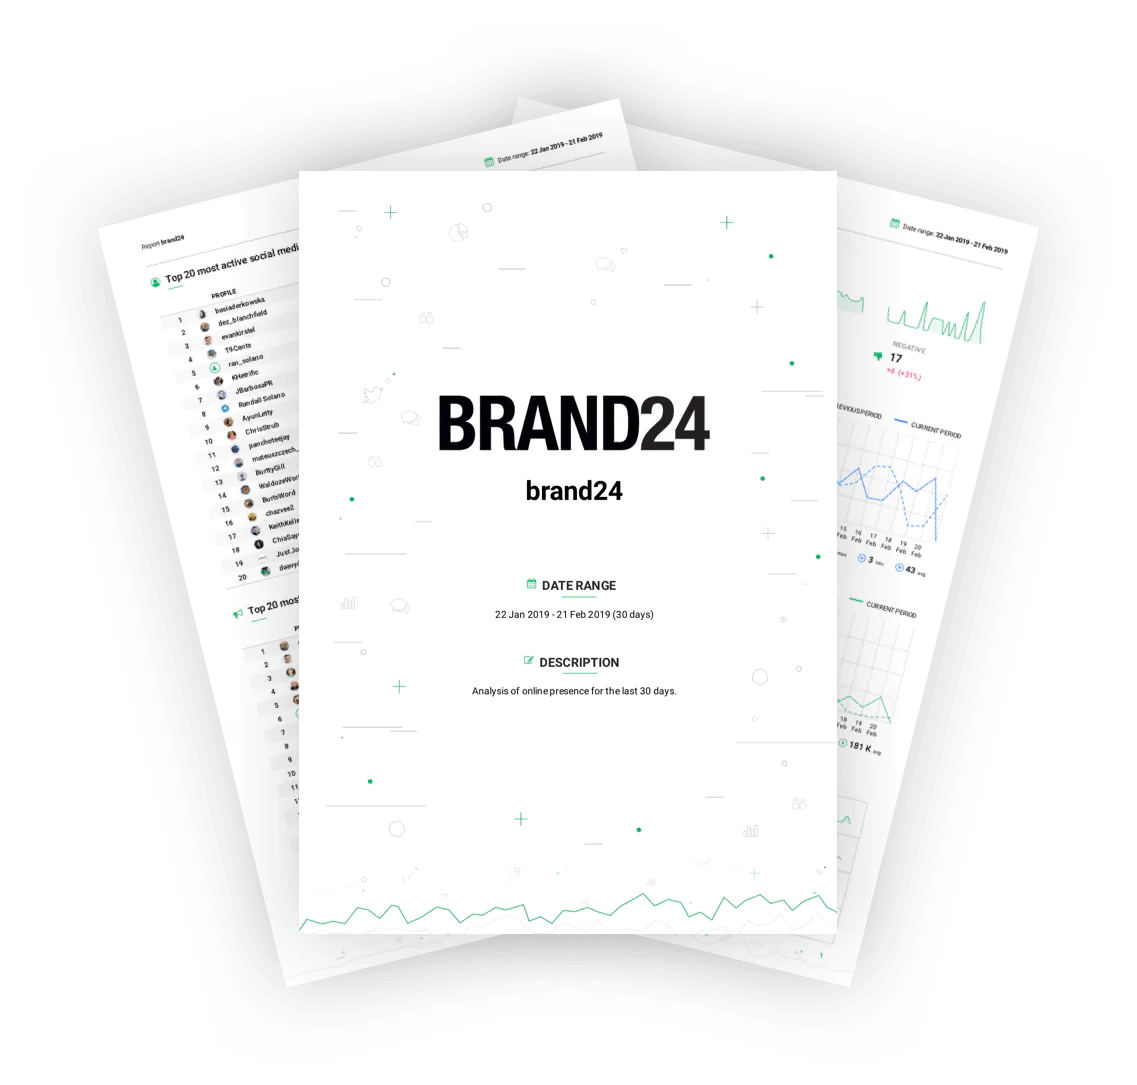
New design
PDF reports got a brand new look. Here you have it in all its beauty:
Way more pieces of data
Let’s move to with what’s most important – data.
From now on, your PDF report can present virtually all pieces of data Brand24 tracks. We’re talking here about data points such as:
- Volume of mentions
- Volume of interactions
- Sentiment analysis
- Social media reach
- Volume of mentions per category
- Quotes
- Most active profiles
- Most influential profiles
- Most active sites
- Most influential sites
- Most popular mentions
- Recent mentions
- Project comparison
- Context of discussion
- Trending hashtags
- Numerical summary
All above pieces of data have been described right here: How to track social media analytics.
Customizable contents
Brand24 is a complex tool that finds applications within various realms of digital marketing. Every user finds value in different pieces of data the tool offers. There are people who might need sentiment analysis but might not necessarily need, for example, interactions.
With that in mind, with new PDF reports, you choose what data your report will contain – to do so, simply flip the switch next to the data point you want in your report.

Optional features
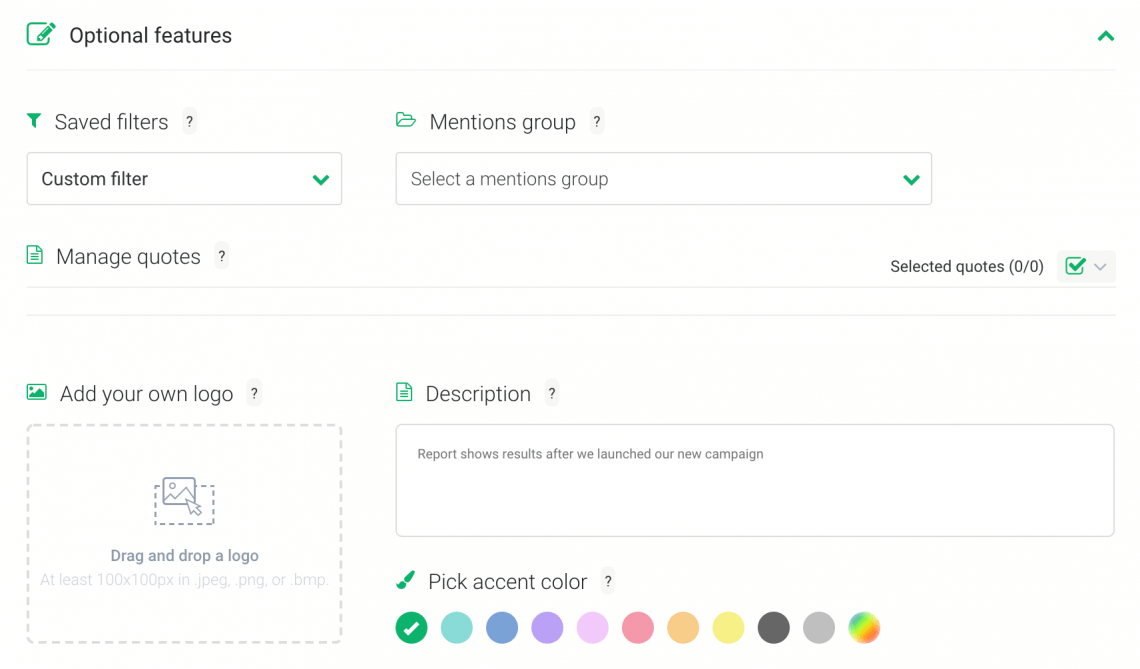
There’s even more options to adjust your report, including:
- Filters
- Groups
- Quotes
- Logo
- Description
- Accent color
Create your report
It takes just a few clicks to create a data-packed report about keywords you monitor. To create one, please log in.
If you’re new to Brand24, learn more what Brand24 is, create your free account and first project.
Once you’re in, here’s what to do to generate your report.
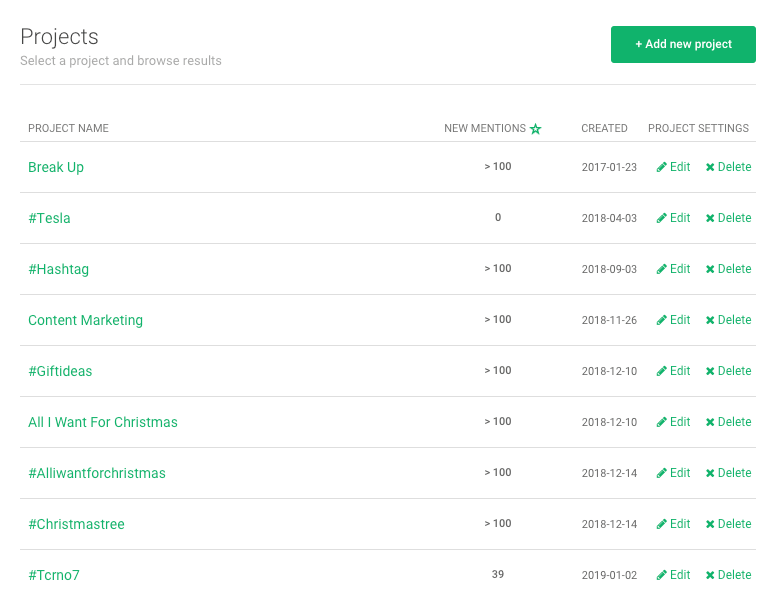
1. Choose your project
Go to your projects and choose the one you’d like to generate a report about.
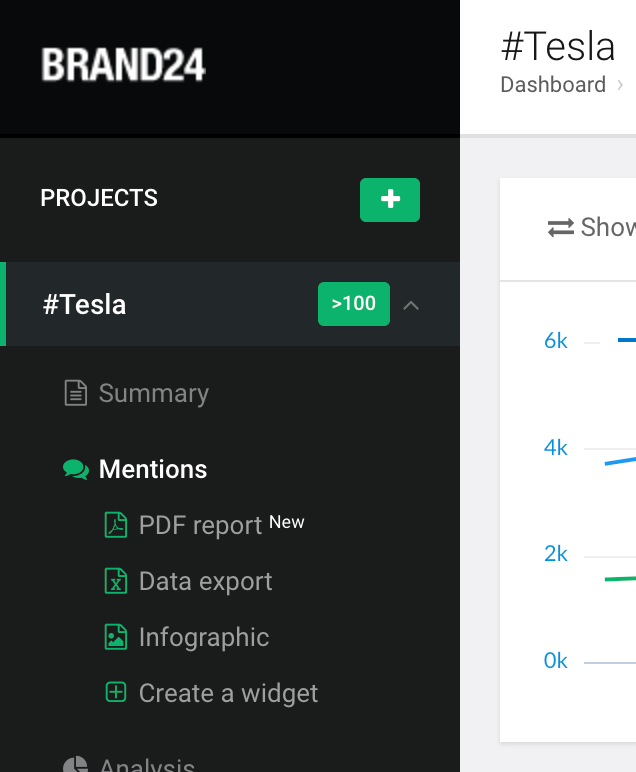
2. Go to the PDF report creator
While inside the Mentions tab, go to PDF report.
3. Choose time span
Choose time period you’d like to generate your report for.
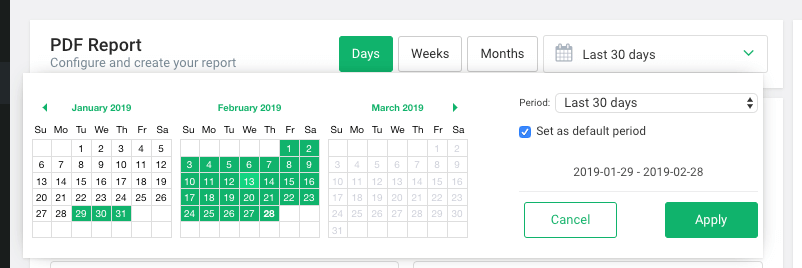
Important: Remember social media monitoring tools, in general, gather little historical data. Therefore, it’s best to operate on dates after you created your project.
4. Choose report content
Here you get to choose relevant pieces of data that matter for you or someone you generate the report for.
Tick modules you want to present in your report.
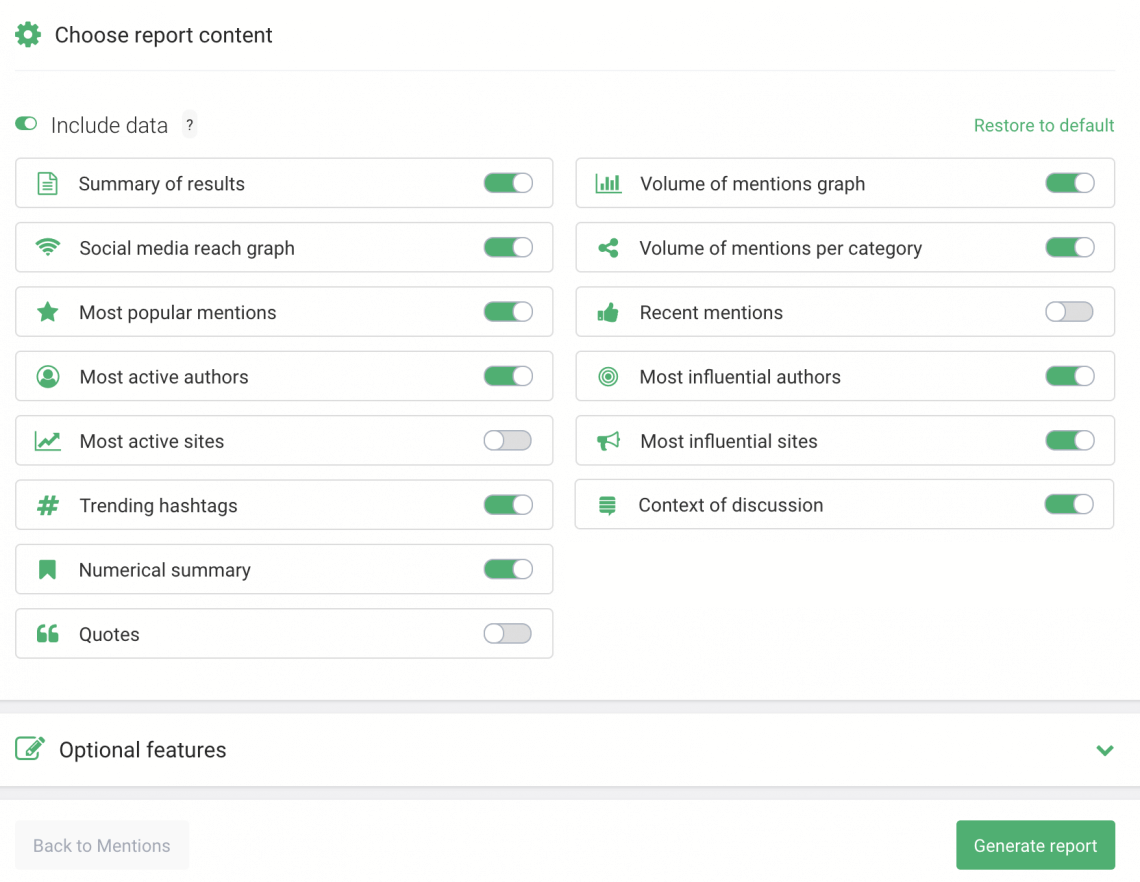
All above pieces of data have been described in How to track social media analytics using Brand24: analysis tab.
5. Optional: Choose filters
The new PDF report creator offers the opportunity to present your data through filters you created earlier.
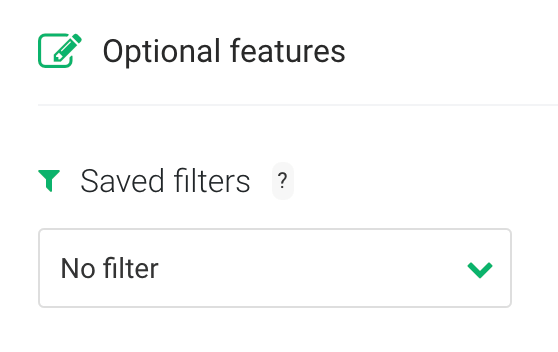
Filters are the way to narrow down your mentions to specific data. Here’s more about Filters.
6. Optional: Choose groups
If you feel like it, the PDF report can present only data about mentions gathered in particular groups you established earlier.

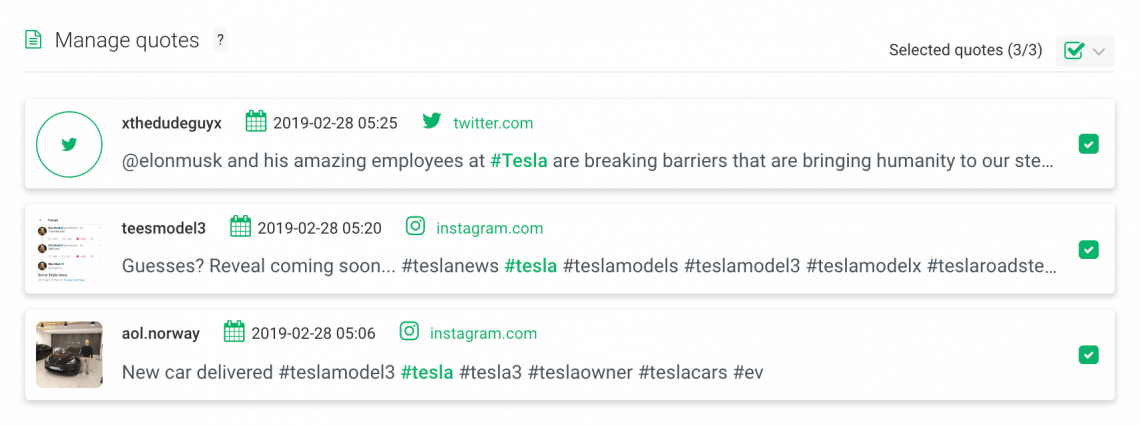
7. Optional: Choose quotes
Putting quotes in your report might come in handy if you want to present, for example, particularly valuable pieces of feedback, comments, reviews and other mentions.
Adding quotes, however, doesn’t happen in the report creator. To add quotes to your report, go to Mentions tab, find your mention and click Add to PDF Report.

Then, the chosen mentions will show up in the PDF report creator where you can add them to your report.
8. Optional: Add logo
You can hone the report’s branding by uploading a company logo which will appear on the front page of your report.
9. Optional: Add description
Description can say a few words what the report is about, contain conclusions, or other important notes and comments to the reader.

10. Optional: Pick accent color
To match the report’s design with company’s branding and colors, you can choose the accent color.

There you have it!
If you have any questions or suggestions about new PDF reports, don’t hesitate to contact our legendary Customer Success team!
Top Reads
Brand Monitoring: Tools & Guide for 2026
Brand Awareness Strategy [The Ultimate Guide for 2026]
The Best AI Hashtag Tracker and Other Hashtag Tracking Tools [2026]
Social Media Reach: How to Measure & Improve It in 2026?
X (Twitter) Analytics Tools: The 10 Best to Try in 2026
Sentiment Analysis: What is it & Why do You Need it in 2026?
Share of Voice: Definition, Calculation, Tools [2026 Guide]
Brand Reputation Management: 6 Expert Tips for 2026
Social Media Analysis: Complete Guide for 2026
How to See How Many Times a Hashtag Was Used on X (Twitter)
Start Social Listening!
Get the Brand24 trial and start social listening like a PRO.
