Table of contents
2M Marketers

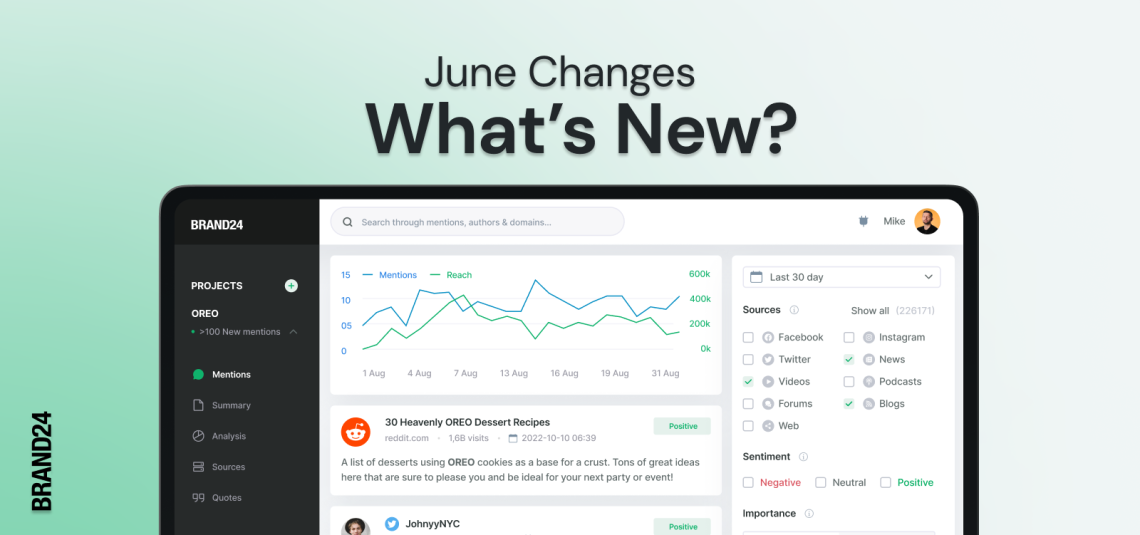
Let’s explore the exciting developments and advancements that took place in June. From AI-driven Reports to additional languages available in the panel, let’s dive into the latest updates that may be useful for you and your company!
Contents:
AI Reports
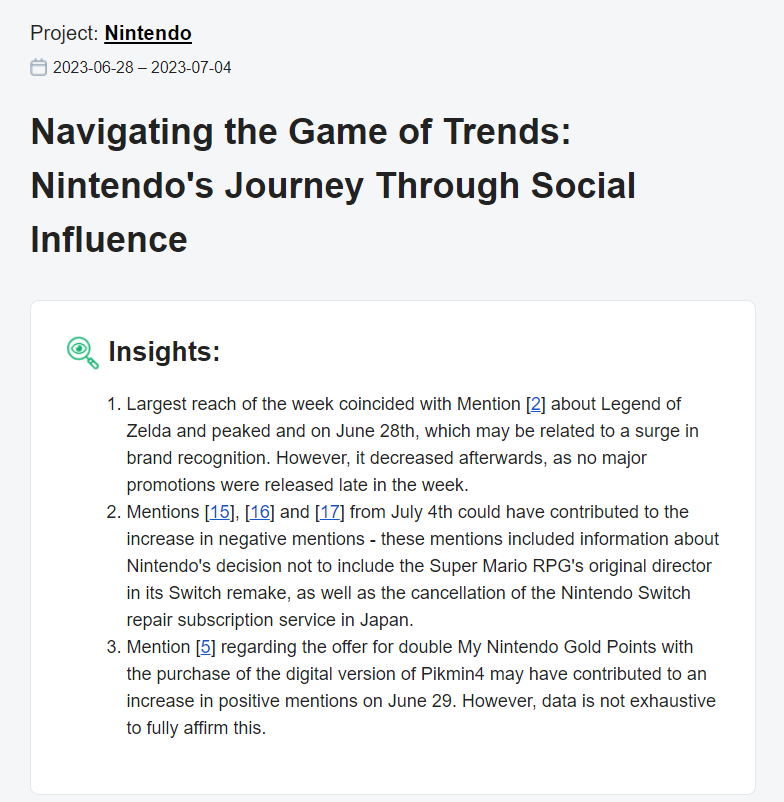
Our AI Report is a document generated by artificial intelligence algorithms that provides valuable insights and analysis based on processed data. It includes charts, metrics, trend analysis, and recommendations to help businesses make informed decisions and improve their strategies.
Brand24 AI Reports: What’s inside?
Insights
The inclusion of eye-opening insights adds another layer of value to these reports. By identifying patterns and correlations in the data, AI algorithms can highlight emerging customer preferences and potential opportunities.
This information can guide businesses in refining their strategies, improving products or services, and staying ahead of the competition.
Trends
AI algorithms excel at identifying patterns and correlations in large datasets, which allows them to uncover emerging trends that may not be immediately apparent to us, people.
That is why AI Reports are great help in identifying new trends, allowing you to pursue a more future-oriented business approach. It also allows one to be the first to notice what is becoming popular and join the discussion before competitors. And who wouldn’t like to be a trendsetter?

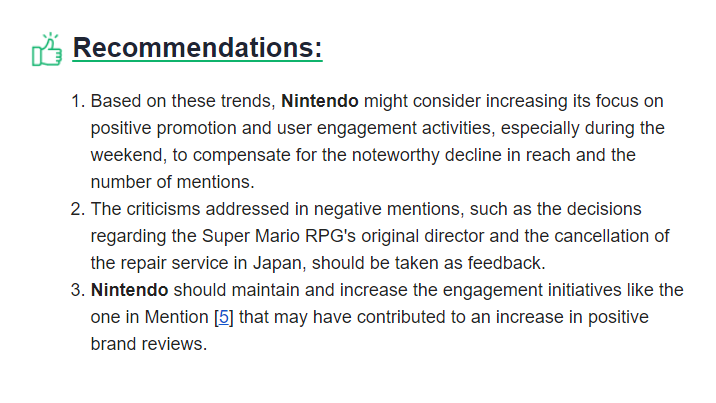
Recommendations
Recommendations offered by AI Reports can act as a catalyst for innovation. By leveraging machine learning algorithms’ ability to identify patterns and make predictions, your business can receive tailored suggestions on how to enhance its products, optimize marketing campaigns, or streamline its operations.
These recommendations can serve as a springboard for creative thinking and spark new ideas that might not have been considered otherwise.
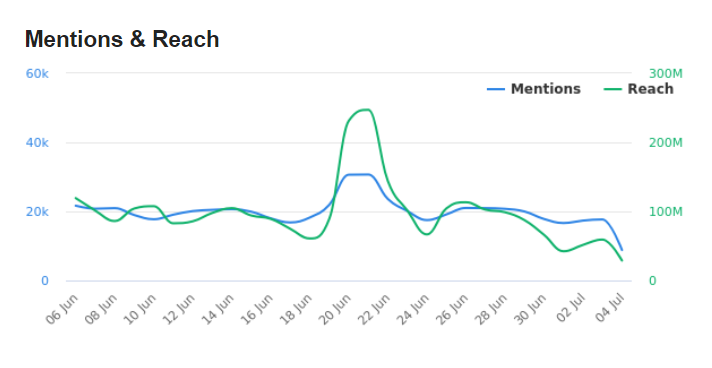
Additional metrics
We also included a snippet of some KPIs like the number of mentions, their reach, and sentiment. It can help gain a better understanding of insights provided in AI Reports.
Please remember that it is still a Beta Feature, and we are constantly working on improving its performance. But it may happen that the data that you are provided with can be somehow misleading. If that’s the case, notify us, and we will do everything in our power to fix the problem 🙂
How to get an AI Report?
AI Reports are available for all of our Pro and Enterprise customers! If you are already one of them, you will receive the report every Monday via your registered e-mail. If not, you may want to consider changing your subscription plan!
Change your subscription plan and start receiving up to three AI Reports every Monday!
Topic Analysis
What is Topic Analysis?
The topic analysis is a text analysis method that allows you to identify and distinguish various topics present in a collection of internet mentions. It enables the analysis of hundreds, or even thousands, of articles, social media posts, or comments, which would be impossible with traditional manual analysis.
Using appropriate AI algorithms, it is easy to identify and extract topics, keywords, and emotions related to a particular subject. This makes it more convenient to track:
- which topics are the most popular and important in the context of your project,
- which words and phrases are most commonly used,
- what emotions are associated with a given topic.
Why would I need it?
By using topic analysis, you can, for example:
- track the most important trends in the industry,
- see what problems are affecting your customers,
- analyze what their (customers) expectations are for your company.
This makes it possible to tailor marketing and PR activities to the needs of your customers and propose solutions that meet their needs.
Additionally, topic analysis allows you to monitor the most important communication channels based on the categories in which a particular topic is discussed. This enables you to adapt your PR activities to the preferences of your audience and utilize the channels that are most important to them.
And what’s inside?
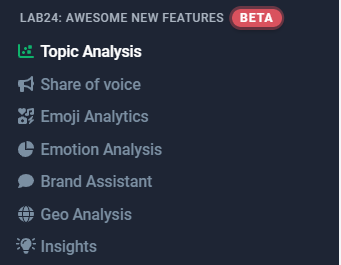
You will find Topic Analysis at the bottom of the menu under ‘Lab24: Awesome new features’. Just:
- choose the project you want to measure,
- scroll down to Lab24,
- click on Topic Analysis.
Here begins the fun part. We tried to cover as much data as possible here in Topic Analysis. That is why you will find all sorts of information that can be of benefit to you and your company.
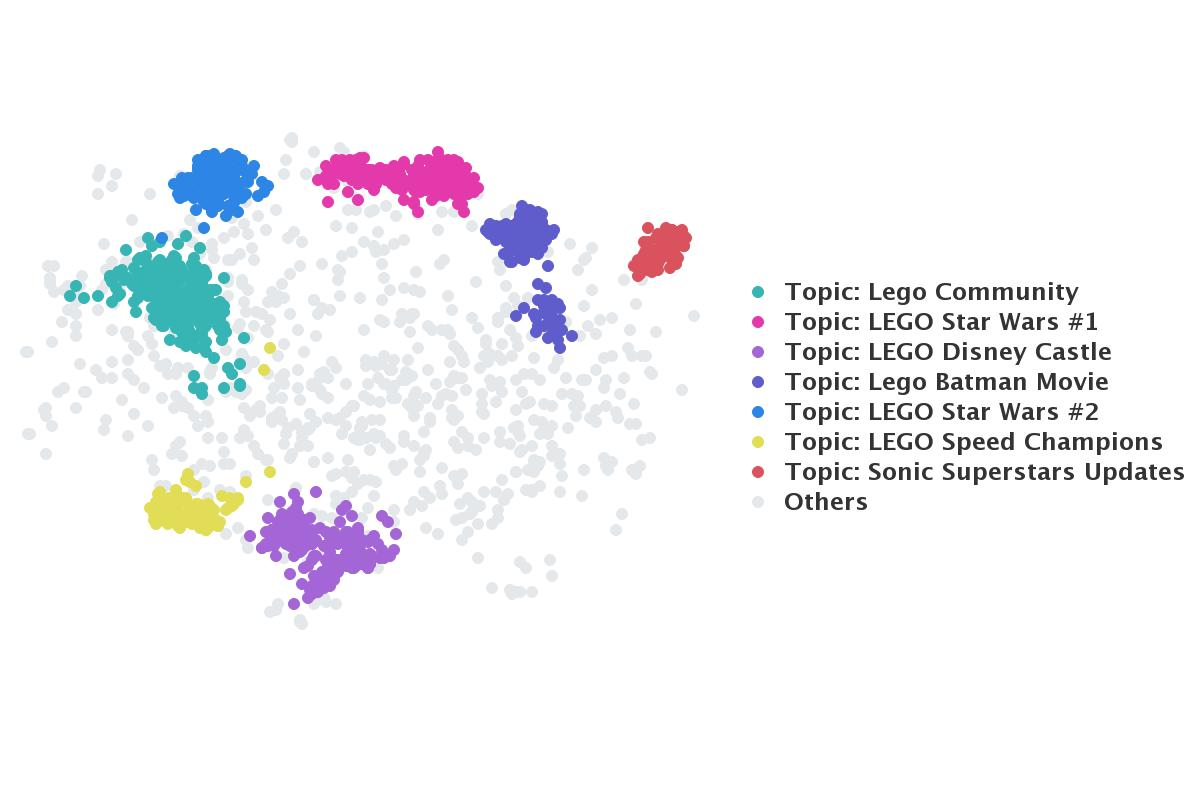
Topics exploration
The topic map presents the distribution of mentions in thematic categories. Each dot represents a single mention, and their relative proximity on the map indicates semantic similarity.
Theme bar
Next, you can choose which one of the extracted topics you want to dig more into (you can change it at any given moment).

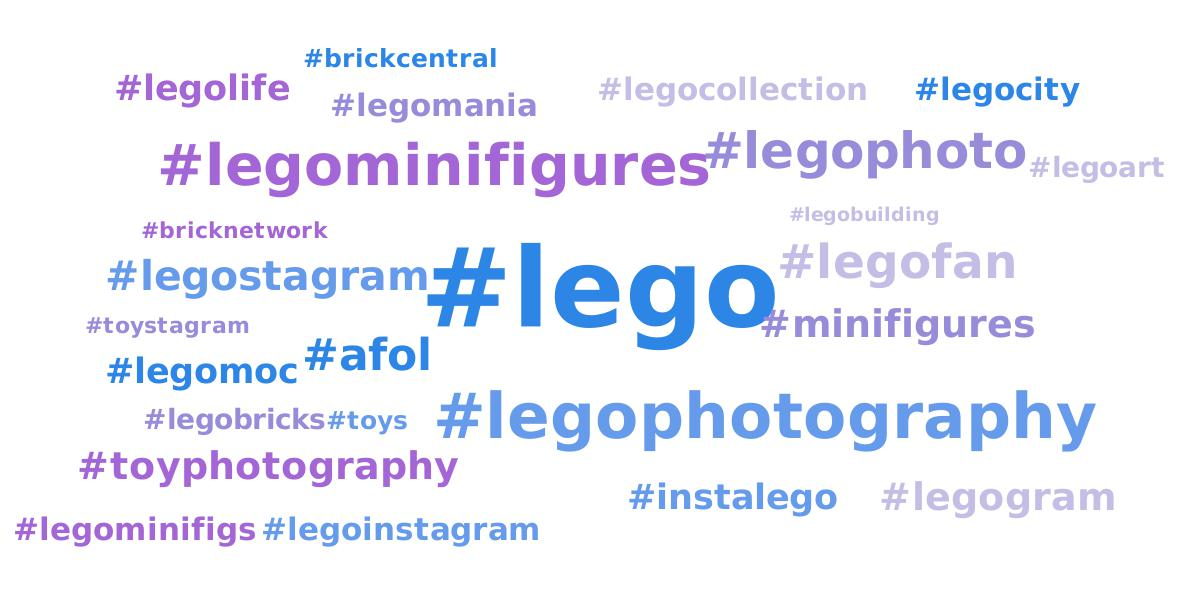
Word cloud
The word cloud displays the most important phrases related to a given topic. The larger the word, the more significant it is in determining the mention’s relevance to the topic.
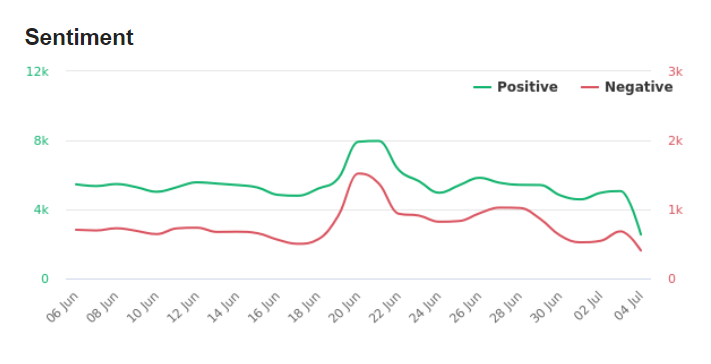
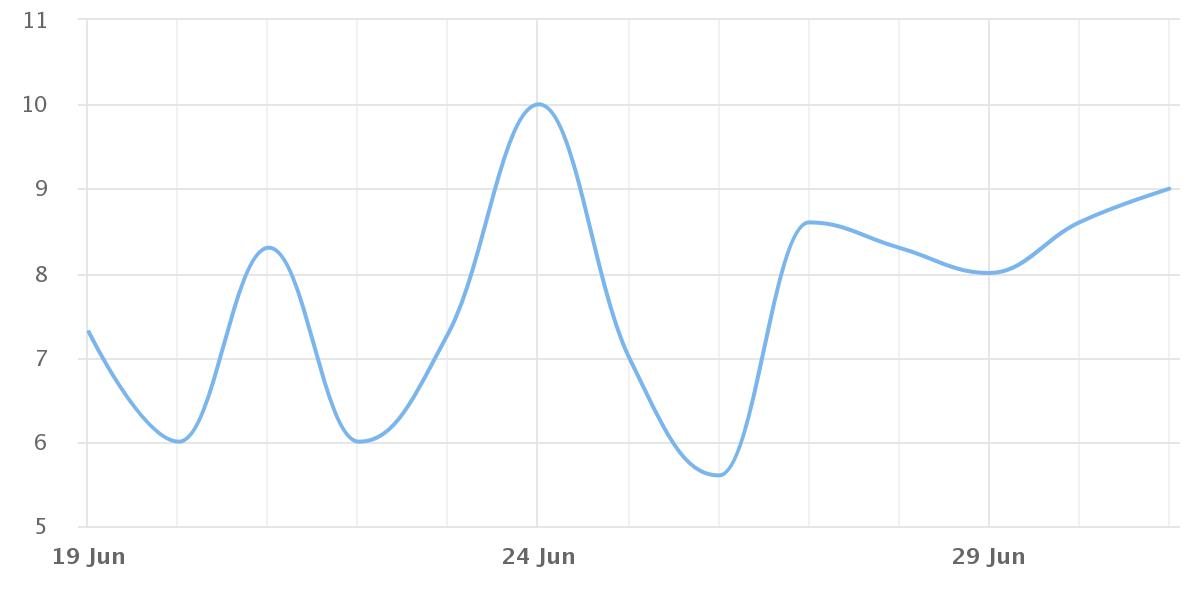
Topic’s popularity chart
The chart shows how often posts related to a given topic appeared within the time range of the analysis.
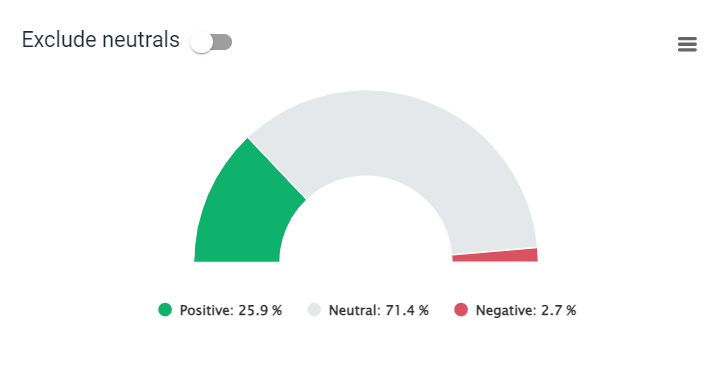
Sentiment share chart
You can quickly check if comments on the researched topic are more negative or positive. Or maybe it doesn’t evoke any emotions, and the chart is grey with neutral comments?
Note: If you don’t want to see neutral comments, with one click, you can hide them.
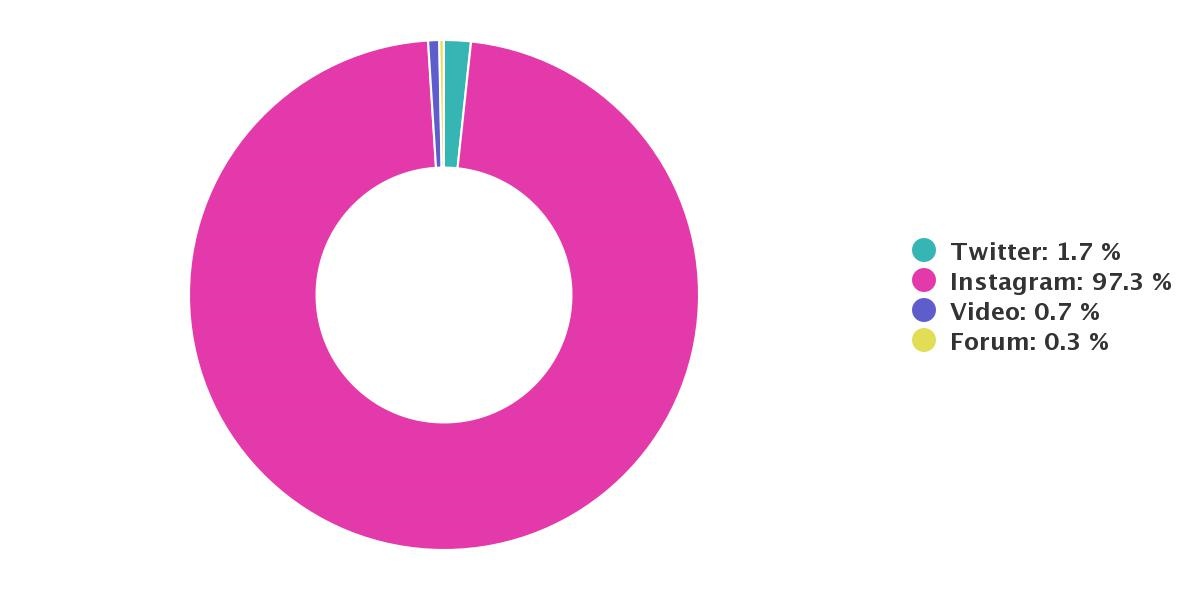
Categories share chart
With this chart, you can check what channel mentions related to a given topic appear.
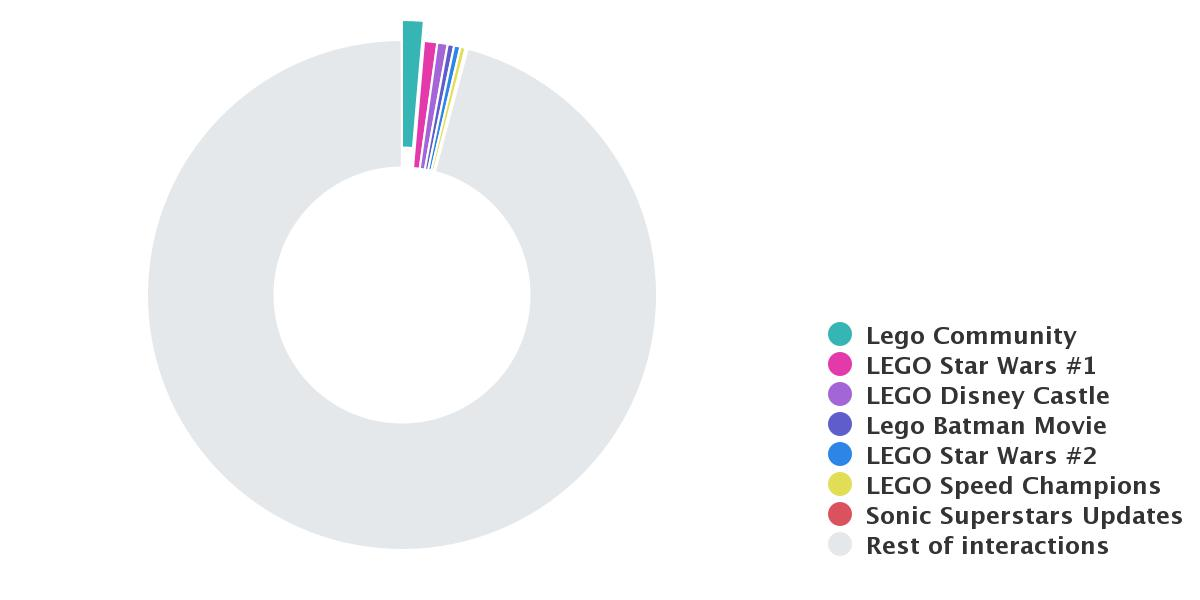
Share of voice chart
This is a comparison of the detected topics’ sizes – how many mentions belong to each of them.

Interactions share chart
Do you know how much engagement did the topic generate from the audience? Now you do 😀 The chart shows the total interactions (i.e., likes, shares, and comments) from all posts related to the topic.
Additional options
‘What else can be there?!’ You may say in disbelief. Happy, you asked!
- Date range
With every theme, you can select the week (last or previous ones) you want to research.

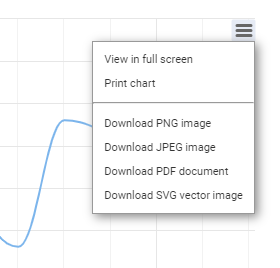
- Exporting options
You can export each graph to add to your own presentations!
Indonesian panel
With this latest update, you can change the language within the Brand24 panel at any given time.
Whether you’re a marketer, entrepreneur, or social media enthusiast, you can now analyze online conversations, track mentions, and monitor brand sentiment in Indonesian!
How to switch?
It is really simple, just:
- navigate to the settings in your Brand24 account,
- select the Indonesian language option.
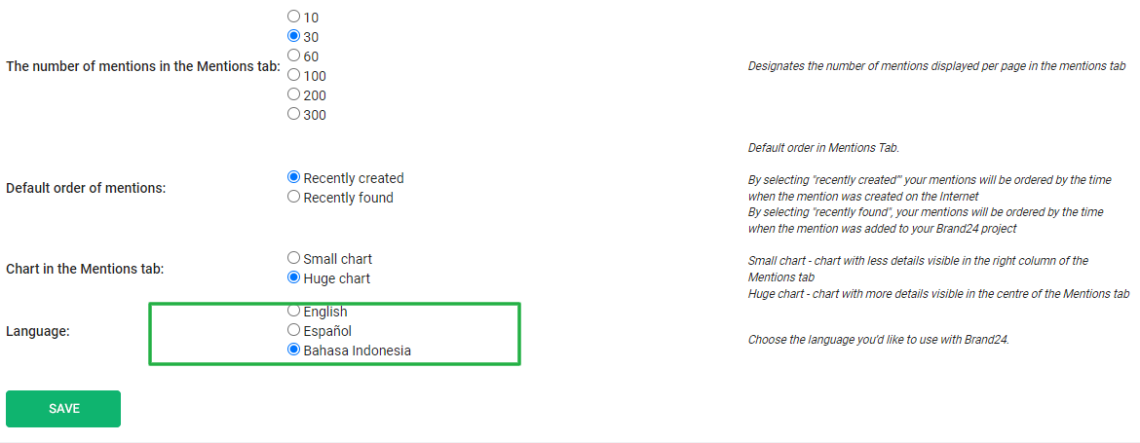
Once selected, the entire interface will transform, allowing you to navigate effortlessly in your preferred language.
That is all for now! I will be back to update you with any upgrades that will be implemented in July. Stay tuned!