Table of contents
2M Marketers

Want to catch up on the latest in Brand24? Get set for a deep dive into the new stuff, including the Comparison Tab, and we’ll also chat about why the Influencer Score matters. Join us as we unpack all the cool changes and upgrades that have happened recently.
Comparison Tab Boost
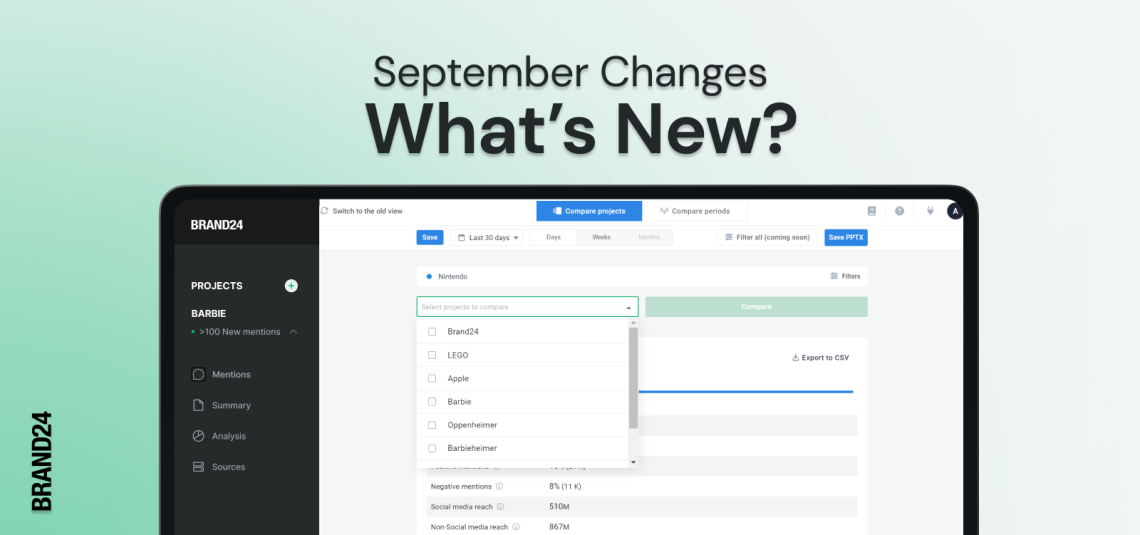
Our Comparison Tab got a major facelift just a month ago, and we can’t wait to tell you all about what changed since then. So, sit back, relax, and let’s dive into the awesome changes that have been happening in the world of Brand24!
Check the new Comparison tab and learn how you can exceed your competitors!
Enhanced Charts: A Visual Treat
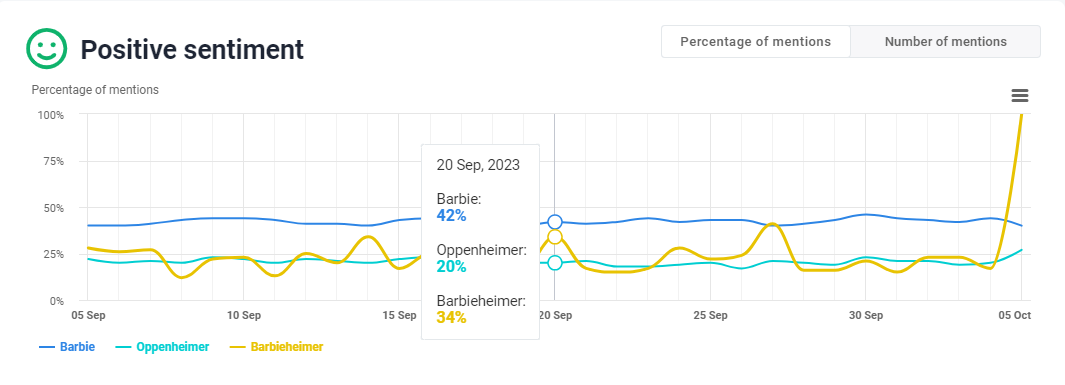
First things first, we’ve given our charts a makeover. Yup, you heard it right! We believe that data should not only be insightful but also visually appealing. So, we’ve revamped the charts and tables within the Comparison Tab to make your data analysis experience even more enjoyable.
No more dull numbers – it’s time for eye-catching visuals! And even numbers are better – we’ve made it simpler: we’ve bolded and starred the better numbers among the compared projects. Now, it’s easy to see which project performs best.
Introducing Share of Voice
Ever wondered how your brand stacks up against your competitors? Well, wonder no more! We’ve added something called Share of Voice to our Comparison Tab, and it’s a game-changer. This nifty feature helps you answer the burning question: “How well-known is my brand compared to theirs?”
But wait, there’s more! Share of Voice also lets you:
- Figure out the size of your brand’s slice of the market pie.
- Evaluate how effective mentions of your brand are in reaching people, both on social media and other platforms.
- Gauge how effective your competitors are in the same aspects.
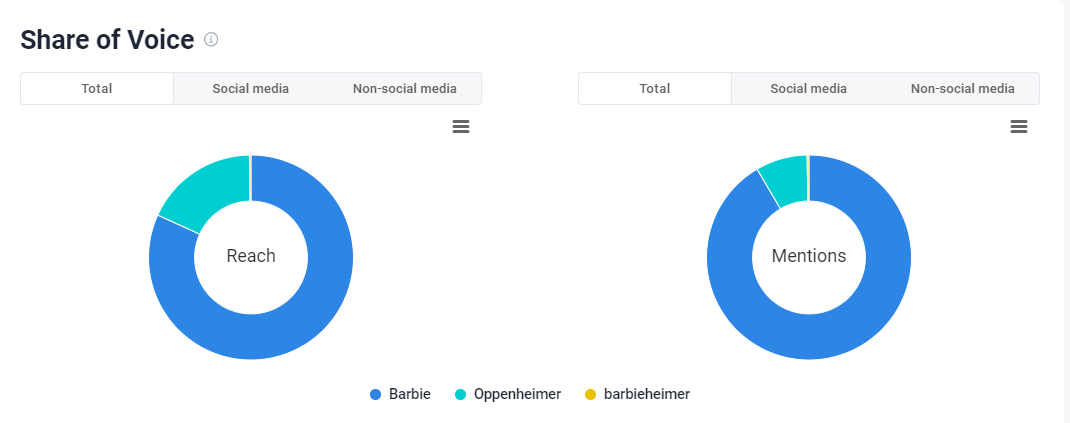
In the Share of Voice table, you’ll find two handy charts. One shows how much reach your brand gets compared to all the selected projects, while the other focuses exclusively on mentions. Plus, you can choose to look at data from either social media or non-social media sources alone. It’s all about giving you the insights you need!
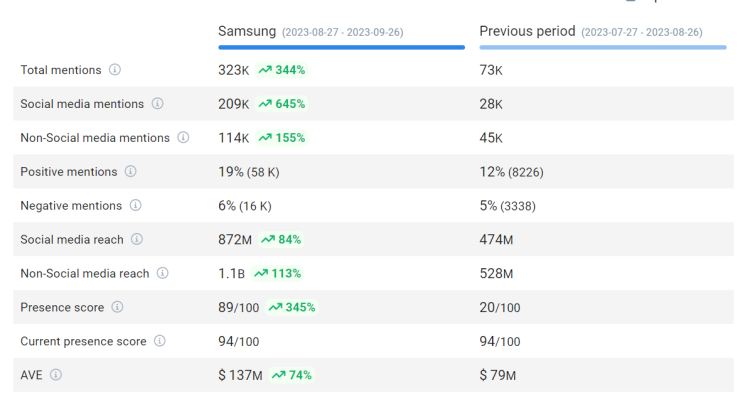
The Coolest Addition: Period Comparison
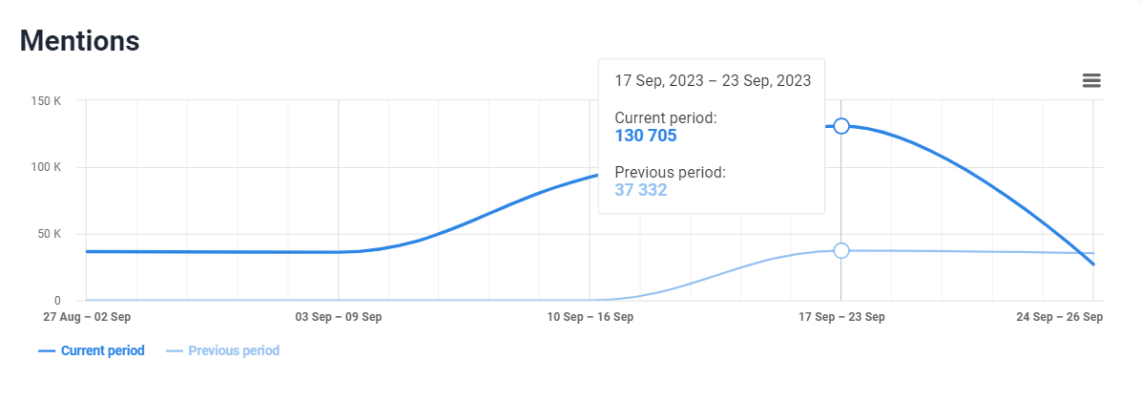
Now, let’s talk about the star of the show – the Period Comparison feature. What does it do, you ask? Well, it lets you analyze and compare data related to your brand, products, or services over different time periods.
You may also be interested in: New in Comparison Tab: Period Comparison
This feature is like a time machine for your data, allowing you to see how your online presence, reputation, and performance have evolved over time. With additional metrics and charts, you can gain valuable insights into your brand, your competitors, or even those trending hashtags. It’s like having a crystal ball for your digital strategy!
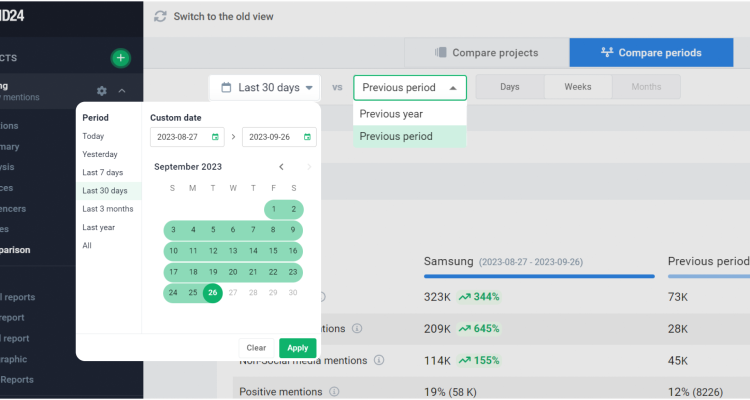
Getting started with Period Comparison in Brand24 is as easy as pie:
- Access the Comparison Tab in our platform.
- Select the timeframes you want to analyze – whether it’s daily, weekly, monthly, or custom intervals.
- Watch as Brand24 gives you a comprehensive overview of data trends during those timeframes.
Period Comparison is super versatile. You can use it to assess your marketing efforts, evaluate how your latest product launch went down, or fine-tune your online strategies. It’s your secret weapon for tracking your brand’s performance over time, and it’s ready for you to explore right now!
Sentiment Breakdown and Categories Share
We’ve saved the best for last! In addition to all these fantastic changes, we’ve thrown in two brand-new charts: Sentiment Breakdown and Categories Share. These charts make data analysis a breeze, no more endless scrolling up and down!
With these new charts, you can:
- Exclude sources that don’t interest you.
- Easily compare results from different projects.
- Say goodbye to the “Neutral” sentiment (or any other you want to filter out).
It’s all about simplifying your data analysis process and giving you a clear, concise view of the information you crave.
So, folks, are you ready to have some fun with our upgraded Comparison Tab? We sure hope so! These changes are designed to make your data analysis smoother, more insightful, and a whole lot more enjoyable. Dive in, explore, and let us know what you think. Your feedback matters to us!
Check the new Period comparison and see how your brand performs over time!
Influencer Score in New Mentions Tab
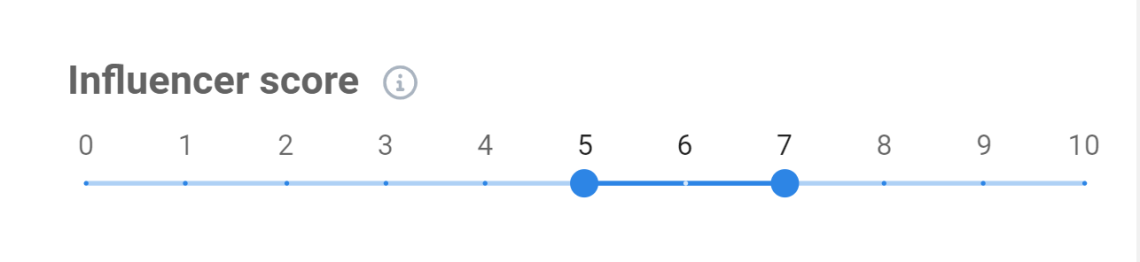
In the world of online marketing, finding the right influencers can be a game-changer. That’s where our Influencer Score comes into play – the higher the score, the more influential they are. Imagine having a tool that helps you identify ideal collaborators effortlessly. Well, that’s exactly what the Influencer Score filter is all about!
You can now spot the Influencer Score right within your New Mentions Tab! And guess what? You have the power to customize it to match your preferences by setting precise score ranges for your searches.
Why, you ask? Picture this scenario: you’re on the prowl for influencers to help boost your brand’s visibility. With this new feature, you can conduct some market research and pinpoint the perfect fit based on their influencer score.
- For the industry giants, set the score between 8-10.
- For those in the mid-range, opt for scores between 5-7.
- And if you’re eyeing micro-influencers, simply dial it down to less than 5.
This nifty feature is tucked away in the New Mention Tab, and accessing it is a breeze. Just click on ‘Switch to new view’ in the top-right menu, and you’re all set.
Check out the Influencer Score and find an evangelist for your brand!
That’s a wrap for now! We’ll make sure to keep you posted on any awesome new features in our upcoming posts, so stay tuned!