Table of contents
2M Marketers

If you’re already familiar with Brand24, you’re likely no stranger to the power of tracking your brand’s online presence and measuring yourself against competitors. But guess what? We’ve got some exciting news that’s going to take your brand management game to the next level.
Say hello to the refreshed Comparison Tab in Brand24 – a game-changer designed to give you unparalleled insights into your brand’s performance in relation to your competitors. Let’s dive in and explore why this upgrade is a must-have for every brand striving for success in today’s digital landscape.
Table of contents:
Check the new Comparison tab and see how different topics, brands, and hashtags differ!
What to love about Comparison Tab
We know that as a brand, you’re constantly juggling multiple tasks – from engaging with social mentions to deciphering complex marketing analytics. Amidst all this hustle and bustle, keeping an eye on your competitors’ strategies can often take a backseat. That’s where the new and improved Comparison Tab steps in, acting as your trusty sidekick in the journey towards brand supremacy.
So, why will brands absolutely love this feature? Let’s break it down:
- Comprehensive Insights at Your Fingertips: The refreshed Comparison Tab empowers you to compare your brand’s performance effortlessly against competitors. Whether you’re eyeing the number of mentions, gauging sentiment analysis, or tracking your social media messages’ reach, this feature provides a comprehensive snapshot of how you stack up.
- Data-Driven Goal Setting: Setting clear and attainable goals is the foundation of any successful marketing strategy. By analyzing your competitors’ metrics and achievements, you can gain invaluable insights that help you set realistic benchmarks for your brand’s growth.
Read more: What is Competitive Benchmarking? Best Practices
- Unveil Your Audience’s Preferences: Planning a new marketing campaign and unsure about your audience’s preferences? The revamped Comparison Tab lets you create dedicated projects for different topics, enabling you to gauge your audience’s reactions and identify the most resonant social media platforms.
- Strategic Hashtag Insights: Hashtags are the currency of social media, and knowing which ones are trending can be a game-changer for your brand. With the Comparison Tab, you can easily discover the hashtags that are capturing your audience’s attention, giving your content the visibility it deserves.
TIP: If you don’t know which hashtags to track for your brand, visit the Analysis tab, scroll down to the end of the page, and get inspired by the cloud of words we prepared for you.
- Optimal Timing for Maximum Impact: Timing is everything in the digital realm. With the Comparison Tab, you can pinpoint the periods of peak online engagement, helping you schedule your content releases and product launches for maximum impact.
What’s inside?
Date Range
Effortlessly contrast various timeframes by simply selecting a date range spanning Days, Weeks, or Months, or tailor it to your specific preferences.
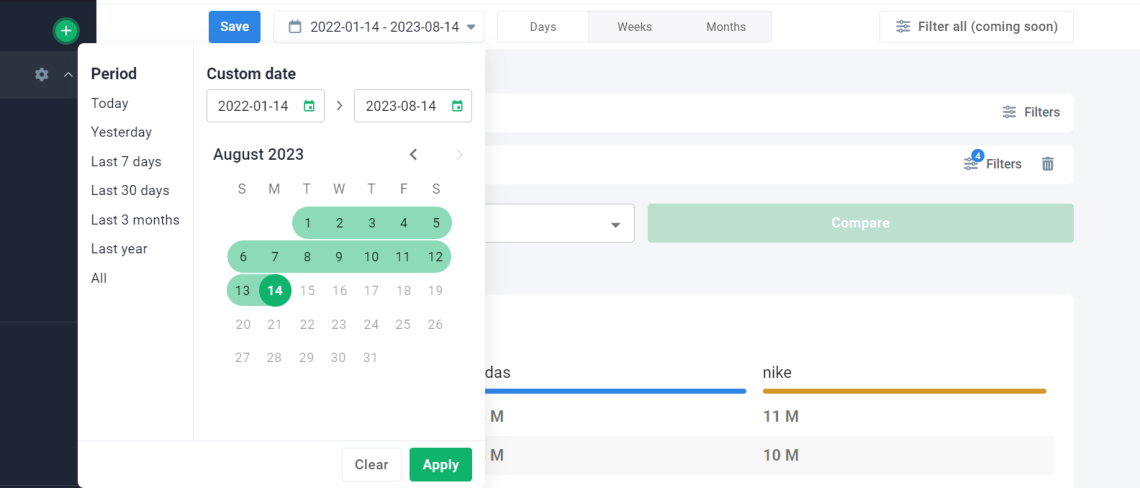
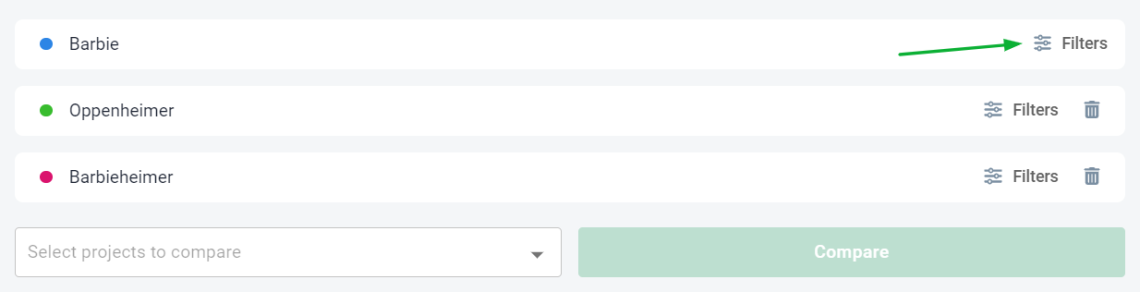
Filters
Discover the freedom to compare the metrics that matter most to you selectively. Tailor your comparisons by applying filters to focus solely on specific social media platforms or prioritize key indicators. Plus, enjoy the seamless integration of all the filtering options previously found in the Mention tab, now conveniently available within the Comparison tab as well!
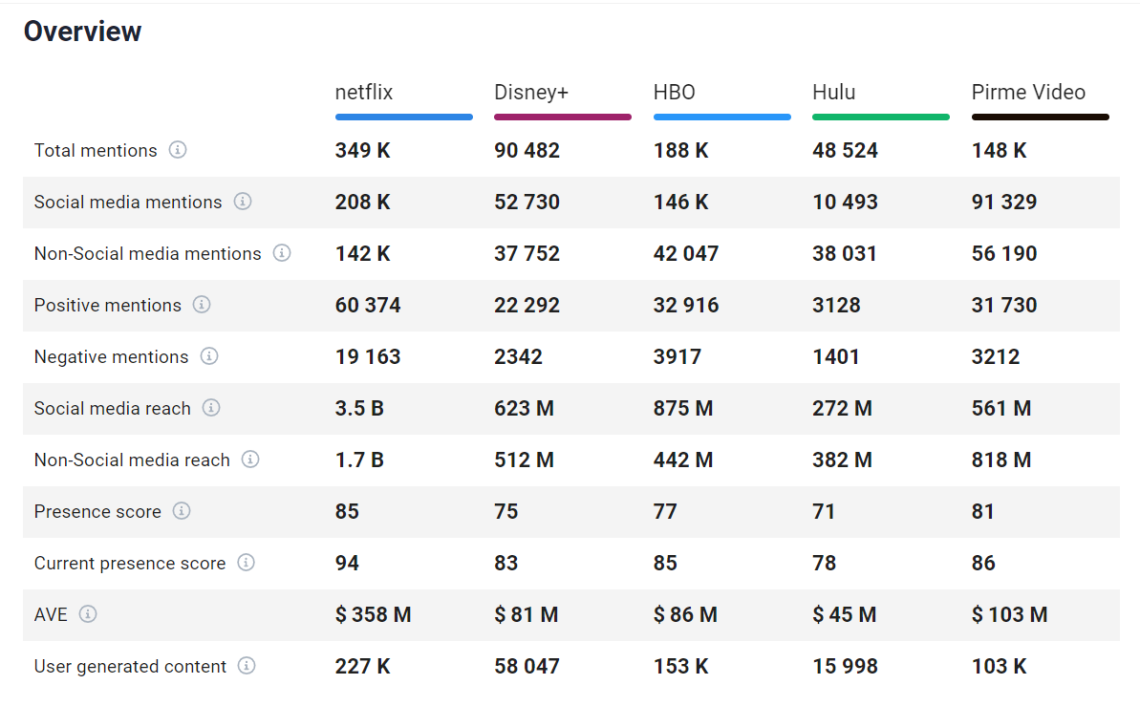
Overview table
Within the overview table, you can quickly compare all the important numbers:
- Total mentions
- Social media mentions
- Non-Social media mentions
- Positive mentions
- Negative mentions
- Social media reach
- Non-Social media reach
- Presence score
- Current presence score
- AVE
- User-generated content
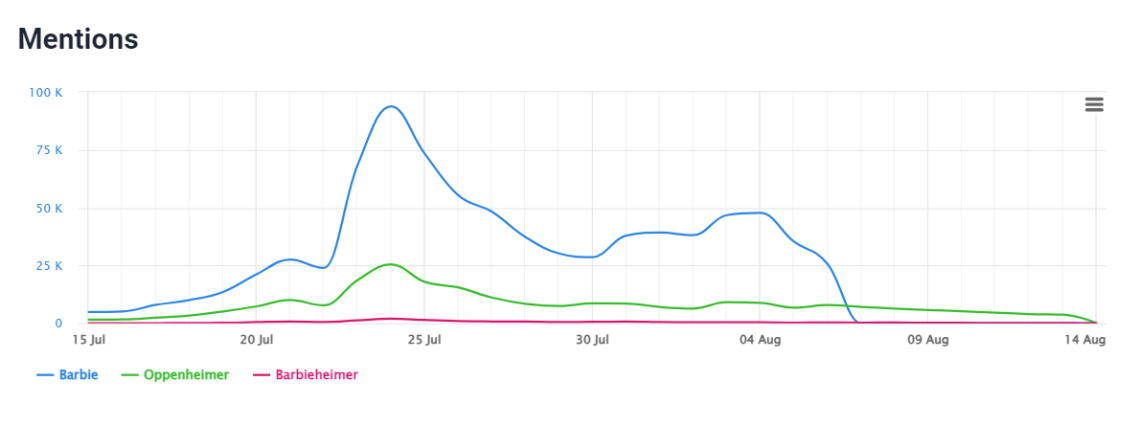
Mentions chart
The mentions chart in the Comparison Tab is a graphical representation that displays the volume of mentions received by different brands or projects being compared. This chart provides a visual overview of how often each brand or project is mentioned across various sources, platforms, or periods.
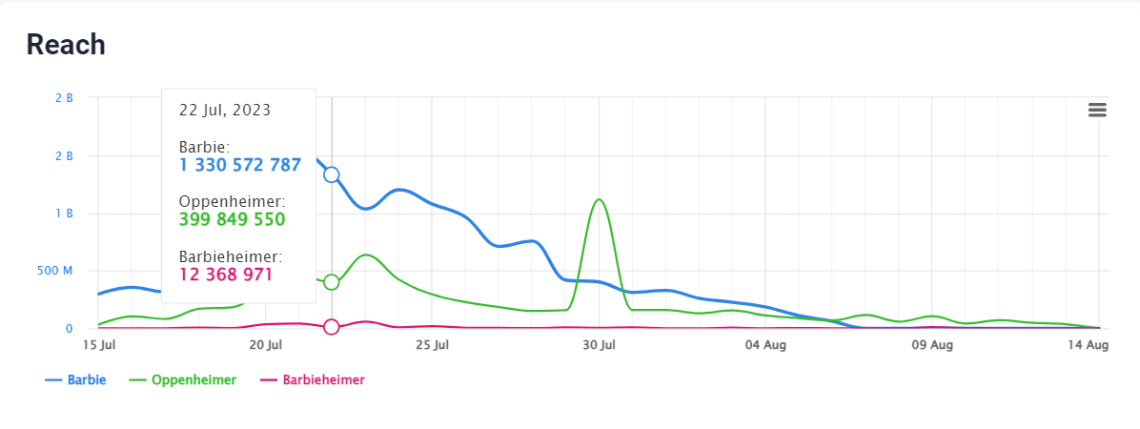
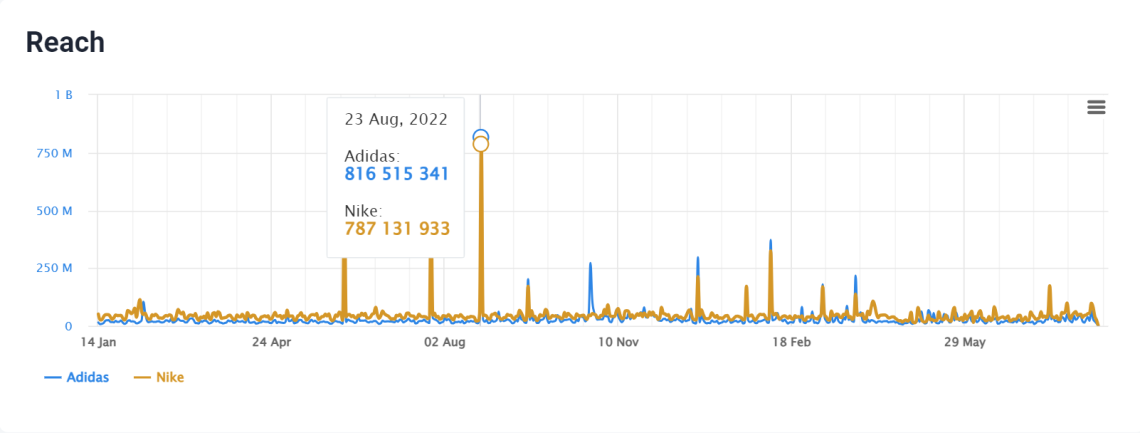
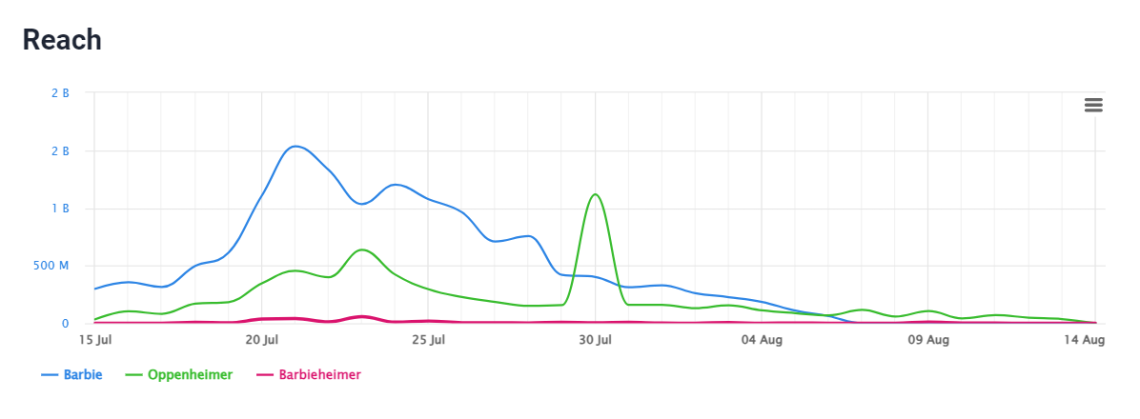
Reach chart
Reach (based on a source’s audience size) for each of compared projects. Analyzing the reach provides valuable insights into its overall visibility and influence within its target audience.
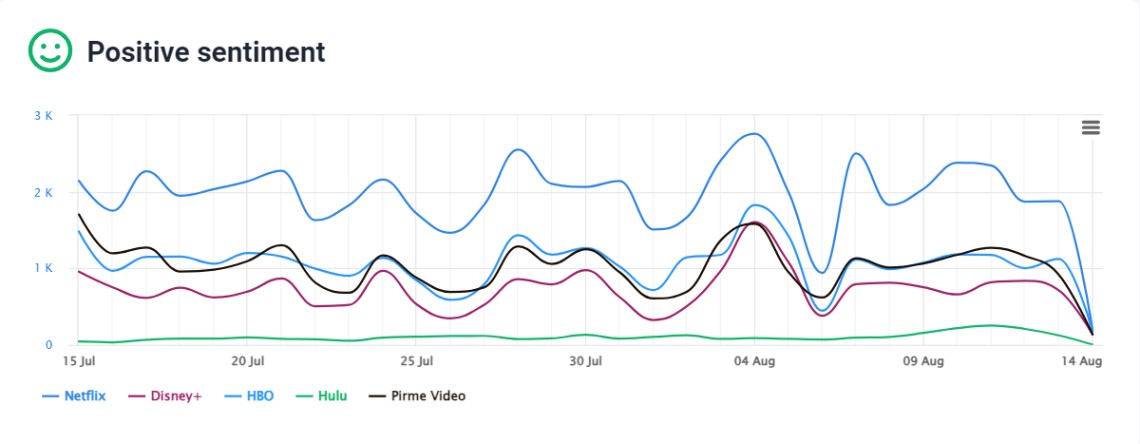
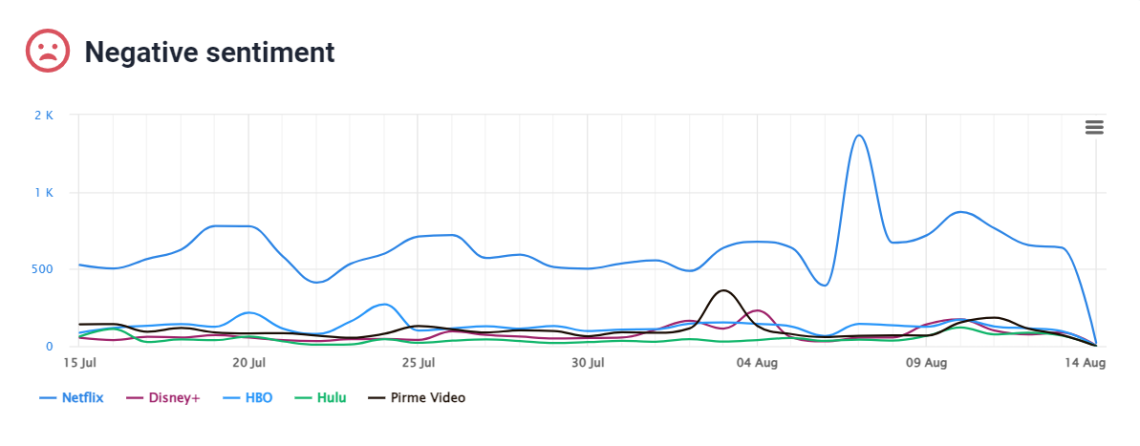
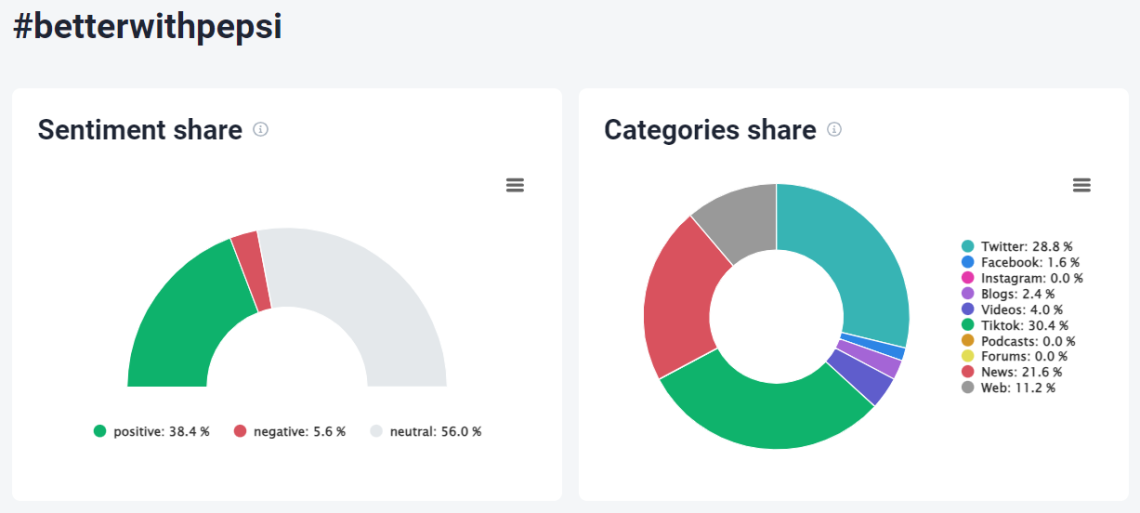
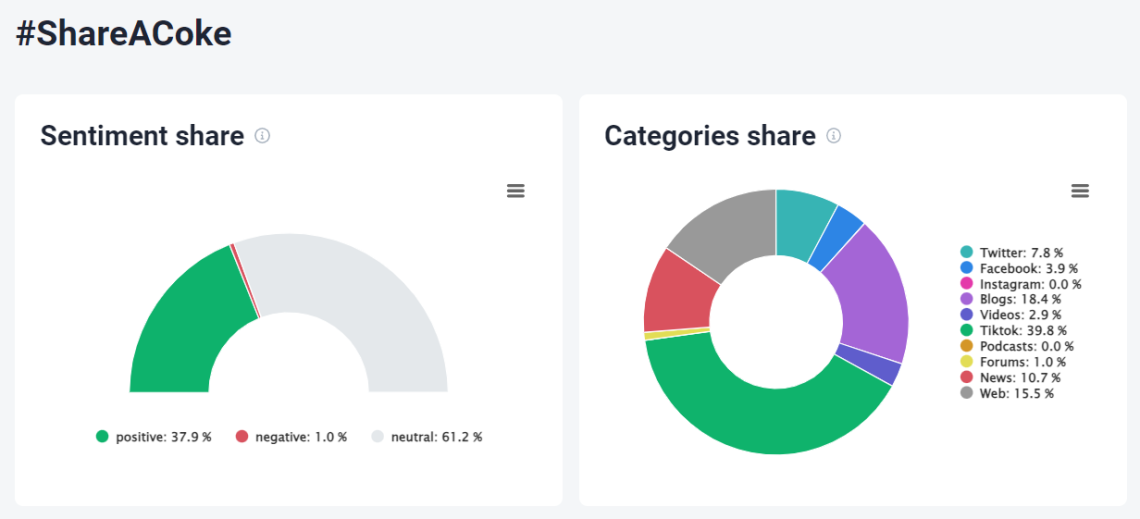
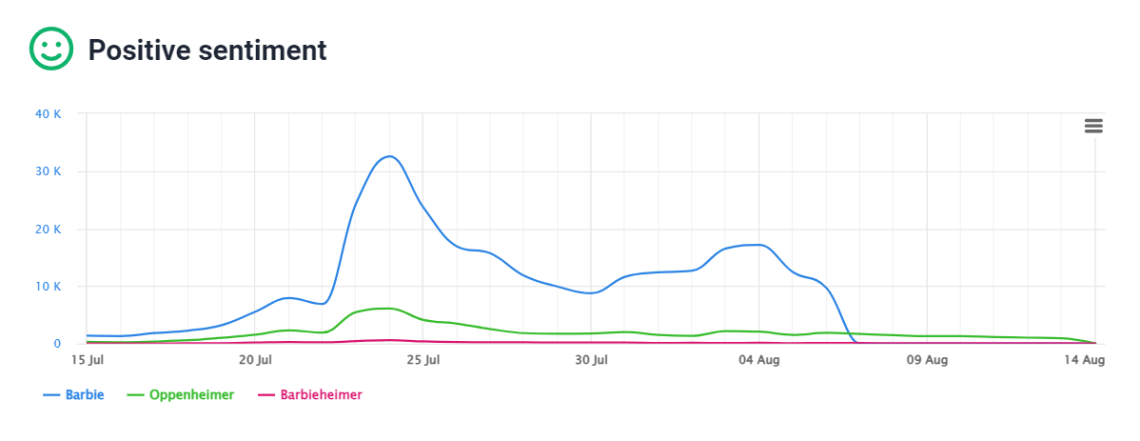
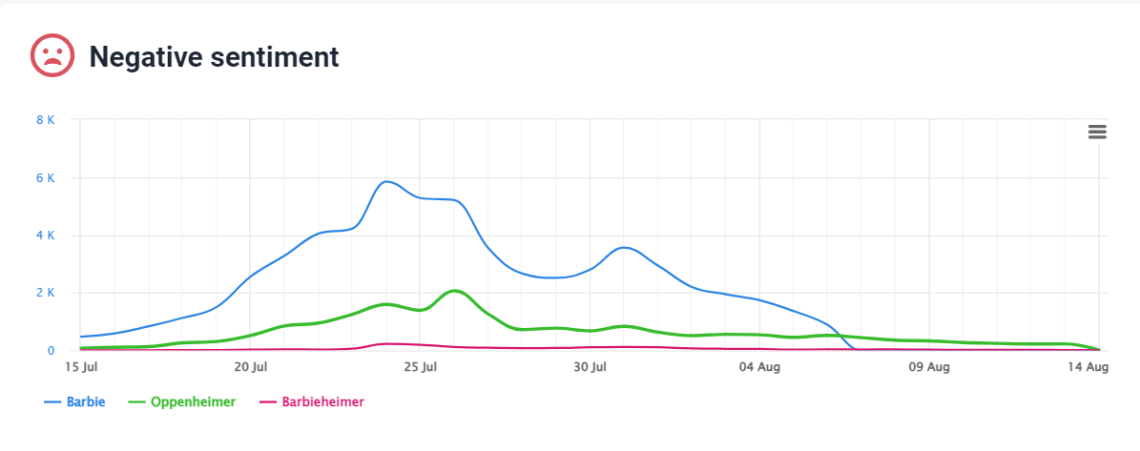
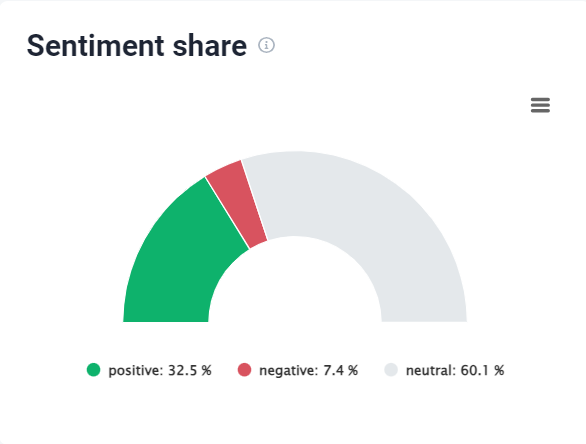
Sentiment charts
Sentiment charts in the Comparison Tab offer a graphical representation of the sentiment analysis for each of the projects being compared. Sentiment analysis involves assessing whether mentions, comments, or discussions about a brand are positive, negative, or neutral.
These charts provide a visual breakdown of sentiment distribution across different projects, allowing you to grasp the overall sentiment trends and patterns quickly.
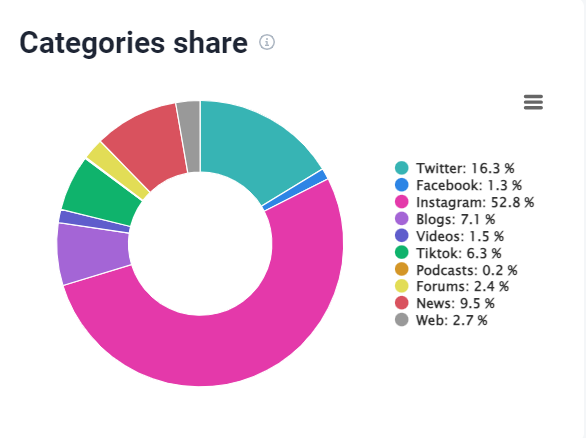
Categories share chart
The categories share chart is a graphical representation that illustrates the distribution of brand mentions across different communication channels for each of the brands or projects being compared. This chart provides a visual breakdown of where and how brand conversations occur, highlighting each communication channel’s prominence in driving discussions.
Read more: Competitor Analysis: All Why’s, How-to’s and More
So, are you ready to embrace the possibilities that the enhanced Comparison Tab brings to the table?