Table of contents
17 Key Growth Marketing Metrics You Should Track in 2026
Let’s be real – companies that use data to guide their marketing are crushing it. According to Forbes, companies that adopt data-driven marketing are 6 times more likely to be profitable year-over-year than those that don’t. The difference is huge! Don’t act blind over growth marketing metrics, and start tracking them today!
So, without further blah blah blah…
Let’s get into the most important growth marketing metrics!
Quick summary:
- Growth marketing metrics are all about measuring your current business performance.
- The focus is on how your business works on revenue, acquisition, and retention.
- It can involve acquiring new customers, improving costs, or simply taking care of your reputation.
- The metrics you should measure will vary based on your business type and your KPIs.
Key growth marketing metrics to track:
01 Customer Lifetime Value (CLTV)
Customer lifetime value measures is a metric that represents the total revenue that a specific customer generates for your business. It sums up the entire time the client spent with your business.
In general, this metric can help you establish the value of long-term customers and find ideas to improve customer retention and revenue.
How to measure?
The customer lifetime value is calculated by dividing the average revenue per user by the churn rate.
Here’s a simple formula:
CLV = Average Revenue per Customer / Churn Rate
02 The volume of mentions
The volume of mentions metric shows how often people talk about your brand, product, or any other important keyword.
It should include all mentions across social media, forums, blogs, news sites, and more – both, when you’re tagged or not.
Why is it important?
Because more mentions = more visibility.
And it’s not just any visibility, but real, organic talk.
If your brand gets mentioned a lot, it usually means you’re either doing something great or… something people have strong opinions about. Either way, it’s a sign you should be paying attention.
Mentions also help you:
- Spot trends and public interest
- Discover brand advocates or critics
- Evaluate the performance of campaigns
- Check how your marketing efforts work
How to measure it?
You can track mentions using tools like Brand24, Google Alerts, or Brandwatch.
These platforms count how many times your keyword or brand name appears in online conversations over a specific time.
I like to use Brand24 for the ease of use and great source coverage – no complex formula here!
Here’s what the volume of mentions looks like in the dashboard:
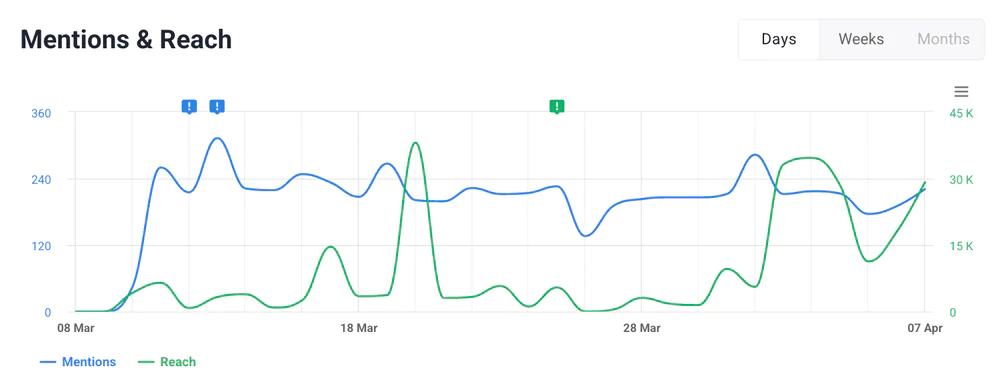
Plus, you also gain access to various analytics and insights within the tool.
Or can check each mention to review it:

03 Customer Acquisition Cost (CAC)
Customer acquisition cost (CAC) basically tells you how much money you spend to get one new customer.
It includes everything from paid ads, tools, salaries, to content creation – any kind of cost that helps you bring someone in.
Why would you bother?
Because growth isn’t just about getting more customers, no matter what. It’s about doing it in the most effective way.
If your CAC is higher than your Customer Lifetime Value (will talk about it later), you’re losing money with every sale. Not ideal!
This metric helps you:
- Evaluate growth marketing strategies
- Optimize your budget
- Balance long-term sustainable growth
How to measure it?
You can use this formula:
CAC = Total Marketing & Sales Spend / Number of Customers Acquired
And remember, the lower your CAC, the better, as long as you’re still bringing in quality leads.

Source: Make a Meme.
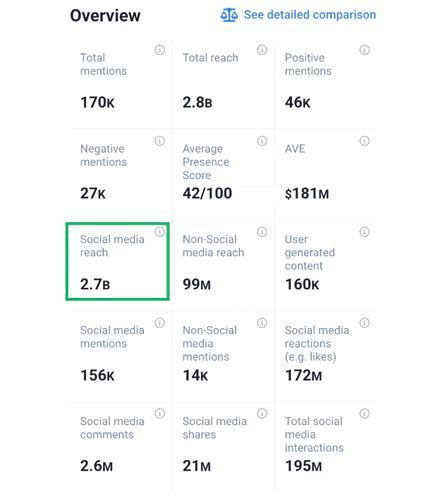
04 Social media reach
Social media reach shows the total number of unique users who saw your content across social media platforms.
Even if people don’t click, they can still see the posts mentioning your brand or your own posts.
It’s a great metric to:
- Measure marketing campaign visibility
- Compare the effectiveness of different platforms
- Improve your sales process
How to measure it?
Some social platforms provide this data within their analytics. But you need to remember it is just your own profile reach.
If you want to know your general reach, which includes talking about you from other profiles on various platforms, you need a social listening tool.
This is what it looks like in the Brand24 dashboard:
05 Monthly Recurring Revenue (MRR)
Monthly recurring revenue (MRR) is a metric that represents the predictable income you can count on each month. It’s usually based on subscription estimations.
MRR shows how much cash flow your business generates on a regular basis – which is super useful for planning growth, forecasting, and even investor talks.
MRR shows you:
- A quick check of your business health
- A way to measure growth trends and marketing efforts
- Insight into the impact of upgrades, downgrades, or churn on your profitability
How to measure it?
It can be counted by multiplying your average revenue per account by the total number of active accounts.
Here’s a simplified formula to use:
MRR = Average Revenue per Account × Total Number of Active Accounts
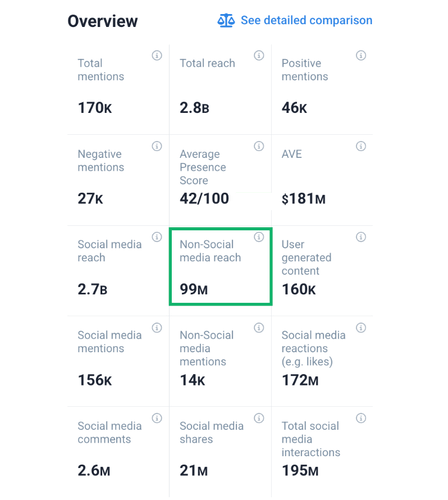
06 Non-social reach
Non-social reach is similar to social media reach, BUT the source here is everything beyond social media platforms.
So, it shows how many people you reach via blogs, newsletters, PR coverage, forums, etc.
Why is it important?
Because this reach is often more stable, long-lasting, and less dependent on algorithms. It shows how well you’re building a searchable, discoverable brand.
How to measure it?
You can find this metric in media monitoring tools, too.
Brand24 includes a pretty big list of sources, from forums to newsletters and podcasts.
This is what it looks like within the panel:
07 Revenue Growth Rate
The revenue growth rate shows how quickly your business income is increasing over time. It’s a key metric that shows you how well your marketing and sales strategies are performing.
Flat revenue = flat growth.
This metric helps you see whether your efforts are paying off and how fast. It’s also super useful if you’re scaling or trying to impress investors.
How to measure it?
It’s pretty easy. You can use this quick formula:
Revenue Growth Rate = ((Revenue This Month – Revenue Last Month) / Revenue Last Month) × 100
You should do this analysis to track monthly or quarterly progress.
08 Conversion Rate
Conversion rate tells you how many people take a desired action on your site or campaign. This can either be signing up, booking a demo, or making a purchase.
Why is it important?
Because traffic is great… but if it doesn’t convert, it just doesn’t matter.
This metric shows how persuasive and effective your marketing is.
How to measure it?
Here’s the formula:
Conversion Rate = (Number of Conversions / Total Visitors) × 100
You can use it to track different types of conversions: email signups, purchases, form fills – anything.
09 Return on Investment (ROI)
ROI tells you how much return you get from your marketing or business investments.
Are you getting your money’s worth?
ROI proves impact. It helps you figure out which campaigns are actually profitable and worth repeating.
How to measure it?
A positive ROI means you’re making more than you’re spending. If it’s negative… time to optimize.
Here’s the formula you can use:
ROI = (Revenue from Campaign – Cost of Campaign) / Cost of Campaign × 100
10 Average Revenue Per User (ARPU)
Average Revenue Per User (ARPU) tells you how much, on average, each customer is contributing over a fixed period of time.
Why bother? Because not everyone is created equal. ARPU tells you customer value, and helps you to understand the caliber of your user base.
You can use it to:
- Monitor if your pricing works well
- Gauge upsell efficacy
- Better predict your revenue
How to measure it?
Average Revenue Per User is simply your total revenue divided by the number of your active users.
ARPU = Total Revenue / Number of Active Users
Pro tip: I encourage you to track this metric monthly, especially if you offer tiered pricing or add-ons. This way, you can use this data to improve your growth marketing strategy.
11 Click-Through Rate (CTR)
Click-through rate (CTR) is a key metric that measures how many people saw your link (in an ad, email, or search result) and actually clicked on it. So, it’s about real action, not just reaching new people.
A high CTR means your growth marketing and offer is working. People are interested enough to take action – and that’s the first step to conversion.
How to measure it?
You can use this simple formula:
CTR = (Clicks / Impressions) × 100
You should analyze this growth metric on any platform you put your marketing efforts on – newsletter, socials, anything.
12 Cost Per Lead (CPL)
Cost per lead (CPL) is a growth marketing metric that shows you how much you spend to generate a single lead. It can be an email signup, demo request, or free trial – the sky is the limit.
Why is it important? Because it gives you a clear picture of how cost-effective your lead gen strategy is. Lower CPL means more leads for a smaller budget.
How to measure it?
You can measure your CPL by dividing the total marketing spend by the number of leads generated.
CPL = Total Marketing Spend / Number of Leads Generated
You can break this down by each platform you do marketing campaigns on to see what’s driving the best results.
And if you need a tip for finding high-quality leads, social listening is a great way to reach them!
Here’s what Mick Griffin, a Head of Growth at Traffit, says about this strategy:

13 Marketing Qualified Leads (MQLs)
Marketing qualified leads (MQLs) are leads who:
- Shown interest in your offer
- Meet specific criteria that make them more likely to become paying customers
Not every lead is ready to buy.
MQLs help you focus on the right people (who are genuinely interested in your offer and a good fit).
This metric helps you:
- Align marketing efforts with sales
- Improve lead generation efforts
- Monitor lead quality over quantity
How to measure it?
You define the criteria based on behavior (like downloading a guide, opening multiple emails, or visiting pricing pages).
Unfortunately, there’s no universal formula. You’ll need to create a scoring system that reflects your customer journey.
14 Trial-to-Paid Conversion Rate
Trial-to-paid conversion rate is a key metric that shows the ratio of users signing up for a free trial to becoming paying customers.
Trials are great… but if they’re not bringing in revenue, how can everything be okay?
This metric tells you how well your trial experience is doing at turning interested users into repeat customers.
It can be a great help in improving your customer acquisition process.
How to measure it?
Here’s a simplified formula:
Trial-to-Paid Conversion Rate = (Paid Conversions / Trial Signups) × 100
You should track it over pre-established periods and use the insight to improve your growth marketing strategy.
15 Customer Retention Rate
Customer retention rate is a key metric that shows the percentage of customers who keep coming back or stay with you for longer.
Keeping a customer is usually much cheaper than finding and attracting a new one.
That’s why a high retention rate = more efficient customer acquisition.
It helps you:
- Measure customer loyalty
- Take care of existing customers
- Better predict revenue metrics
- Identify churn risks early and improve the new customers’ experience
How to measure it?
This one is a little more complex. Here’s a formula that most growth marketers use:
Retention Rate = ((Customers at End of Period – New Customers) / Customers at Start) × 100
And remember – the higher this number, the better!
16 Churn Rate
Churn rate shows how many customers stop using your service or cancel their subscription during a specific time period.
It’s exactly the flip side of retention. If you’re gaining users but losing them just as fast, your growth isn’t real… it’s leaking.
This metric can help you:
- Spot friction points
- Improve user experience and growth marketing tactics
- Lower the customer acquisition cost (CAC)
How to measure it?
Here’s the formula for this growth metric:
Churn Rate = (Lost Customers / Total Customers at Start) × 100
Keep it low, and always dig into the “why” behind it. Especially when it starts to get bigger.
17 Net Promoter Score (NPS)
NPS tells you how likely your customers are to recommend you to others. It’s a fast way to check whether your customers are satisfied with your product.
It’s a pretty complicated metric, influenced by the sentiment towards your brand, the pricing, and many other metrics.
Why is it important?
I saw many times that loyal customers don’t just stay, they encourage new people to try your product.
NPS helps you find those people and identify what makes them do it.
How to measure it?
Most growth marketers conduct surveys.
They ask questions like: “How likely are you to recommend us to a friend?” on a scale of 0–10.
Then, to calculate it, you can use this formula:
NPS = % Promoters (9–10) – % Not Satisfied (0–6)
Anything above 50 is generally considered a good NPS.
Tip: Advanced tools can analyze metrics for you
Growth marketing is a broad field. It includes lots of advanced metrics.
Plus, some of them can be calculated only based on your own criteria.
I wouldn’t be myself if I didn’t share this tip. It makes analyzing growth metrics so much easier!
You can check some of the growth metrics analysis inside one tool – Brand24.
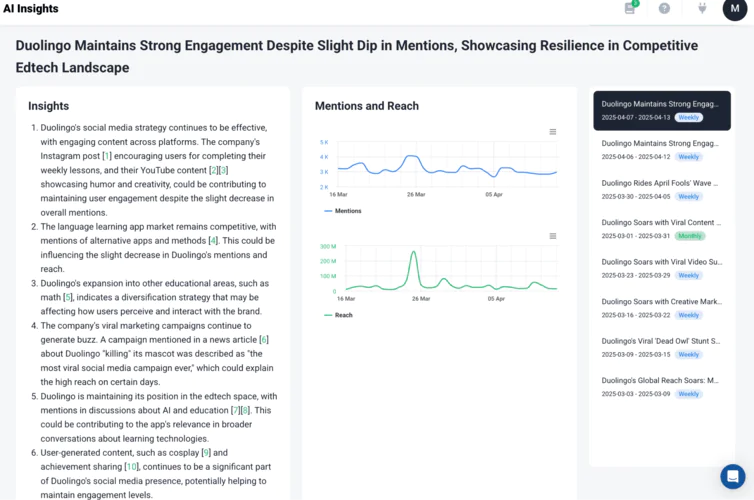
My personal favourite feature is AI Insights.
It analyses the most important things that happened over a given period and presents them in an easy-to-digest form:
It’s a great way to keep up and adjust your strategy.
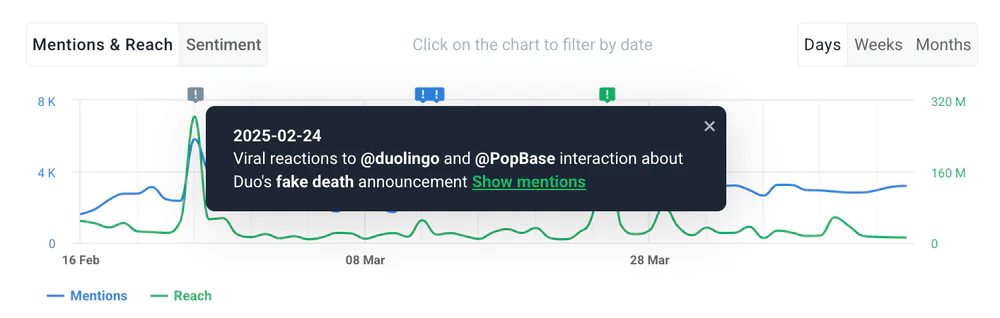
Plus, the tool can conduct the sentiment analysis for you and even identify what specific event caused a spike or drop, so you can improve your marketing and sales efforts.
This is what it looks like for Duolingo:
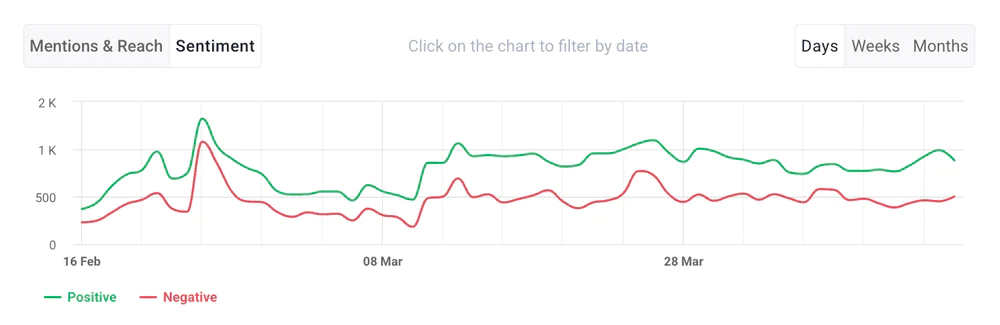
And as you can see, the big spike was caused by their “fake death” campaign:
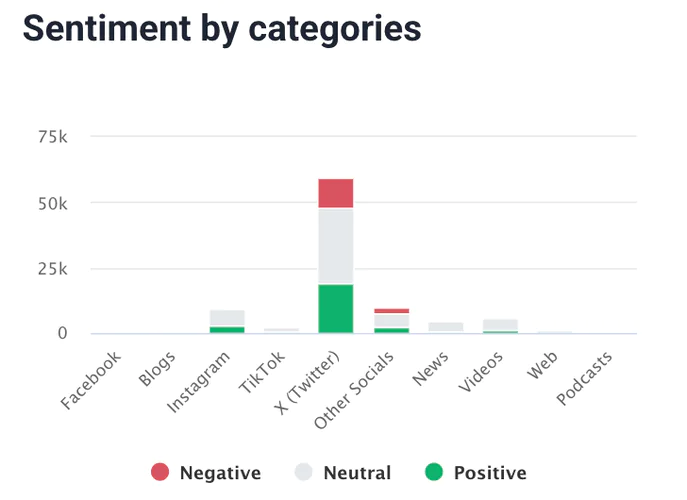
Brand24 also identifies which platforms generate the most negativity:
Of course, there are still many more metrics that you need to analyse. But it’s still a great timesaver.
Plus, it allows you to adapt to any changes much faster.
Once you see a drop, you can easily understand what’s behind it and improve your strategy.
Conclusion
Tracking growth marketing metrics is crucial for your brand’s health, but it’s not an easy task.
Being consistent and acting in real time is crucial.
That’s why AI-based tools can be so helpful. Make sure to try them and check if they can simplify the analysis in your case.
Key takeaways:
- The growth marketing metrics you should track will depend on your business and KPIs – don’t monitor the numbers that don’t matter to you.
- AI tools can be a game-changer. Make sure to use AI for the time-consuming manual analysis and focus on using those insights in the strategy.
- Be adaptive – just monitoring is not gonna work. You need to improve your strategy based on this data to drive growth.
So, there you have it! Start monitoring your growth marketing metrics with the Brand24 trial and see your business thrive!

Article Reviewed by