⚡ Feature Update ⚡ Summary Tab
Up until today, we’ve delivered a couple of useful improvements to make your Brand24 experience even better:
As another month goes by, we proudly present another feature update.
Each day, Brand24 collects and analyzes millions of mentions, including mentions of your keywords.
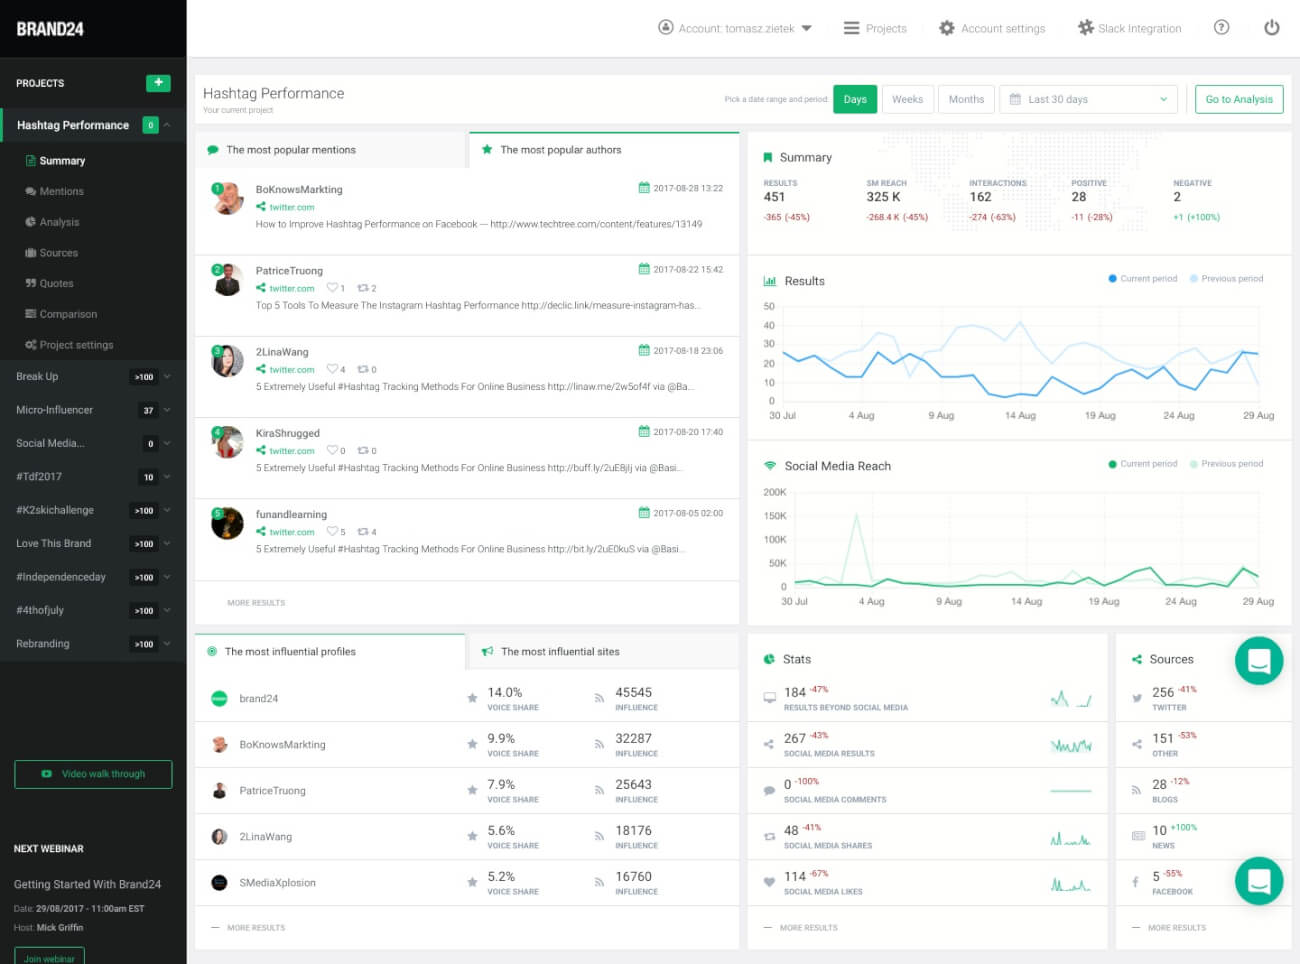
To provide you, dear users, with possibly most convenient access to the vital bits of your data, we’ve created the Summary Tab. You now see the most important information at the first glance in one place.
And here you have it:
Go to your dashboard or start a free trial.
What does it mean to you? A lot of good things:
- A quick and easy access to the essence of a project.
- The most important KPIs at a first glance.
- In-depth analyses at your fingertips.
- Comparison with a previous periods.
Summary Tab is a completely new tab inside the panel. It offers an overview of the most significant KPIs of your projects. It’s the essence, the heart of your project. Here’s what’s inside:
- The most popular authors
Check the top 5 mentions from authors whose mentions generate the biggest engagement. This way you can identify influencers for your business and people to cooperate with.
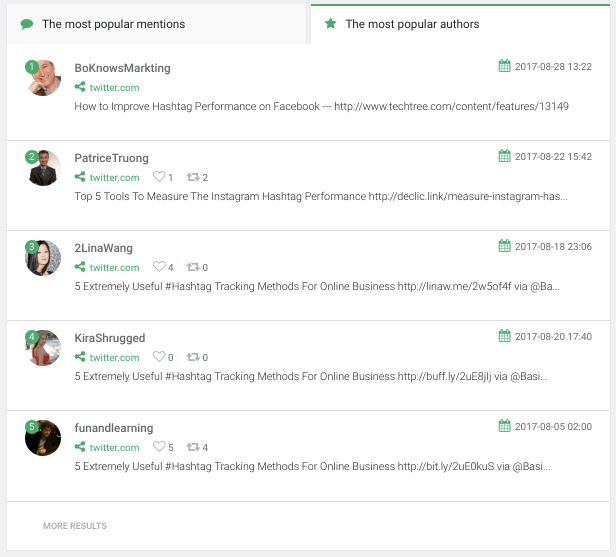
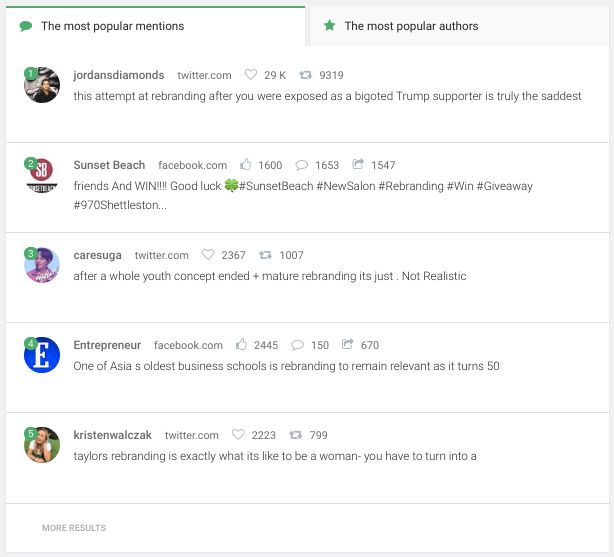
- The most popular mentions (for Premium and Max plans)
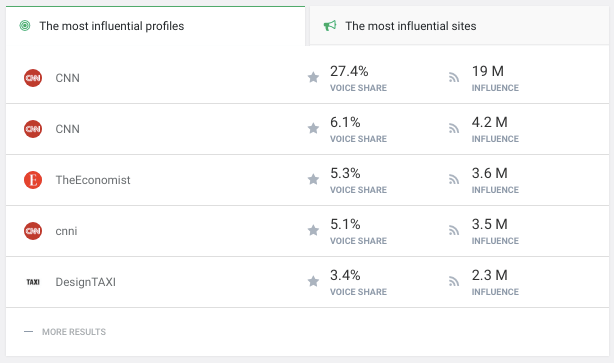
See the top 5 most popular, most engaged mentions. Discover mentions that generate the biggest engagement and resonate with your audience. - The most influential profiles
Here you have social media profiles with the highest influence: the biggest following and engagement. - The most influential sites
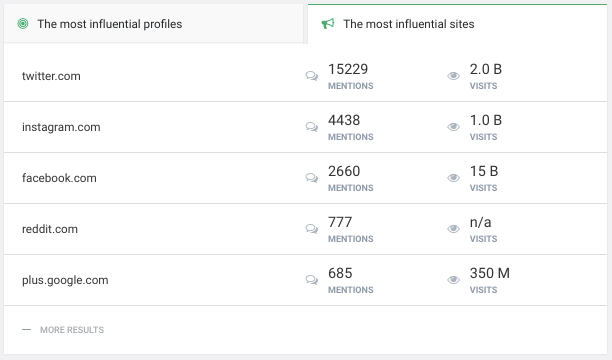
The list consists of top 5 websites with the highest number of visits. - Two evolution graphs representing the number of mentions and their estimated social media reach.
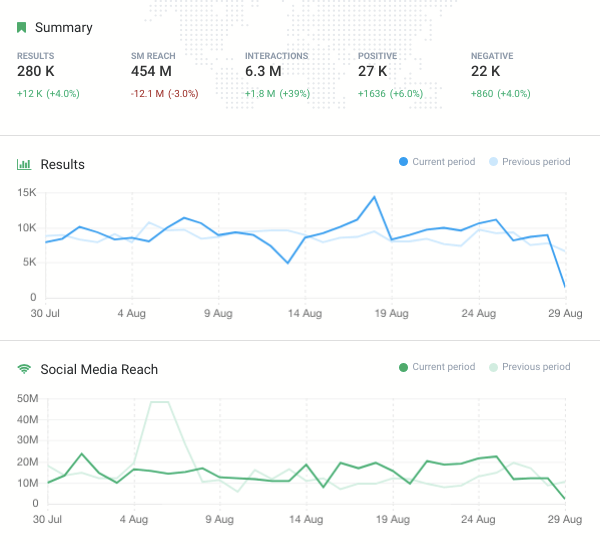
You can freely set the date range to pick the time frame you’re interested in. Also, both of them display comparison with the previous period. - Numerical KPIs with trend analyses.
It’s a bunch of numbers describing your project. The number of mentions, their estimated social media reach, the number of interactions (for Premium and Max plans) the number of positive / negative mentions and more! Summary Tab also indicates the growth or decrease in these stats.
What’s more, each section inside the Summary Tab can take you further. With one click, you can access an in-depth analysis of each section. In there, you can thoroughly look into the results your projects bring.
Top Reads
Brand Monitoring: Tools & Guide for 2026
Brand Awareness Strategy [The Ultimate Guide for 2026]
The Best AI Hashtag Tracker and Other Hashtag Tracking Tools [2026]
Social Media Reach: How to Measure & Improve It in 2026?
X (Twitter) Analytics Tools: The 10 Best to Try in 2026
Sentiment Analysis: What is it & Why do You Need it in 2026?
Share of Voice: Definition, Calculation, Tools [2026 Guide]
Brand Reputation Management: 6 Expert Tips for 2026
A Complete Guide to AI Social Media Analysis [2025]
How to See How Many Times a Hashtag Was Used on X (Twitter)
Start Social Listening!
Get the Brand24 trial and start social listening like a PRO.
