How to Use Business Intelligence to Drive Growth in 2025? (+Astronomer Case Study)
Table of contents
When 36k people suddenly mention your brand and over 4k of those comments are negative, it’s easy to panic. Was it the Astronomer case? If data feels like noise, business intelligence is the tool that brings clarity. And as nearly 50% of businesses already know… it’s no longer optional, it’s essential. In this guide, I’ll show you what BI is, why it matters, which tools lead the pack, and how to make it work for you. Fluff-free zone! Just insights.
Let’s dig in!
Quick Summary:
– Business intelligence is a process of advanced and usually automated data analysis that aims to help decision makers (organization’s executives, managers, etc) make business operations more accurate.
– BI tools have a mix of different features. They usually offer data analysis (including AI-based analysis), data visualization, and custom reporting capabilities.
– Some of the benefits of using modern business intelligence are better-tailored offers, improved revenue and customer experience, and gaining advantages over competitors in your field.
What is business intelligence? Definition
Business intelligence (BI) is the process of turning raw data into actionable business insights that help improve general business performance.
It allows companies to analyze current and historical data to make better business decisions and plan more effective business strategies.
Try business intelligence now!
The term business intelligence also refers to a variety of tools that make it happen.
They can quickly transform data into easy-to-read insights about a company’s performance and market changes.
How?
Business intelligence tools conduct analysis of big data sets and offer their insights in the form of:
- Reports
- Summaries
- Dashboards
- Graphs
- Charts
Everything to give business users a custom and detailed solution to constantly monitor their current business performance and potential improvements or risks.
For example, BI tools can track customer satisfaction trends and changes from multiple data sources and analyze them all in one place.
So, if people start to complain about delivery delays on social media or in Reddit threads, the system can quickly highlight this negative trend.
BI tools will show where the complaints are coming from, how fast they grow, and which products or regions are affected.
With this insight, your team can act immediately and prevent the PR crisis from escalating.
Things that normally would take hours, with BI tools, can be done in seconds!
Protect your brand reputation!
But I can’t talk about BI tools without mentioning AI.
Artificial intelligence is now reshaping the business intelligence process.
I’ll show you based on the Brand24 tool example, as that’s the one I use the most.
If you don’t have time for crunching numbers or analyzing graphs on your own, there’s an AI Insights feature that does it all automatically and gives you key insights from the last week.
It’s a great example of how modern business intelligence goes beyond just collecting data.
With AI-powered analysis, you don’t have to dig through the business data yourself.
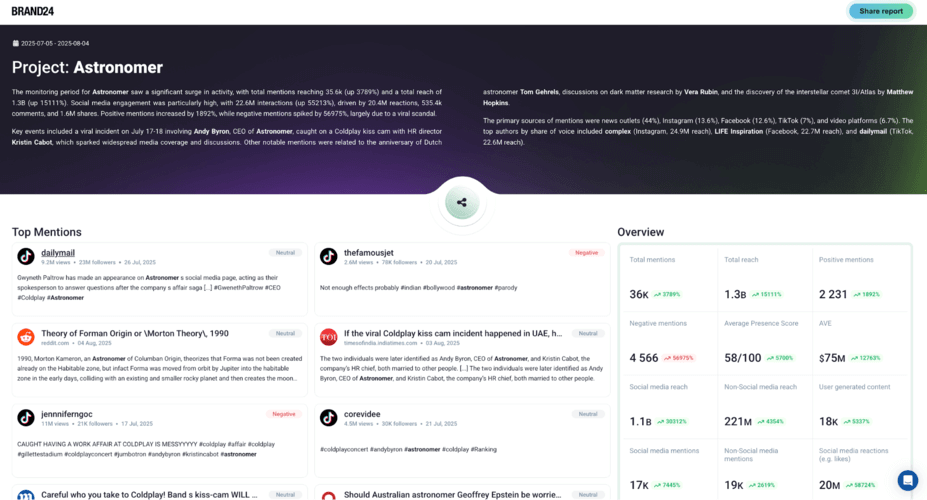
This is what it looks like:
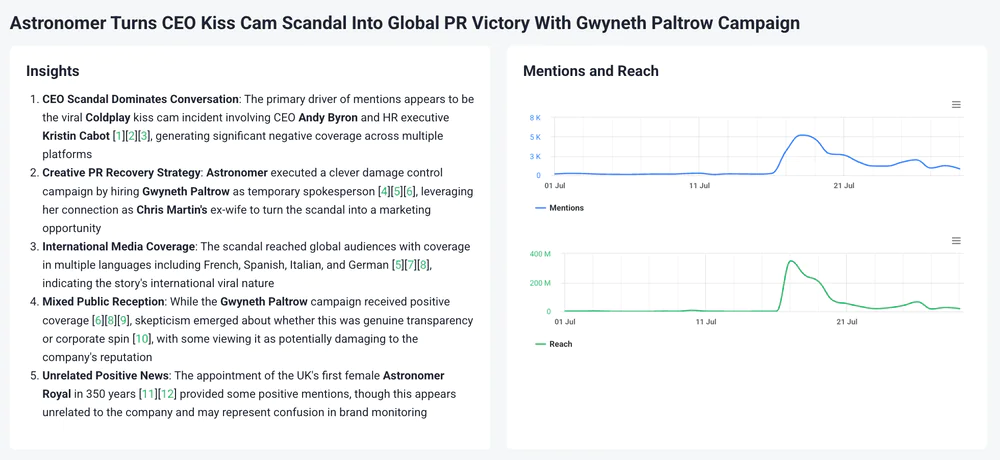
Remember the Astronomer CEO drama? Well, here’s what happens two weeks later and how the company handles it.
Using AI means you can make smarter decisions faster and truly control your brand reputation and performance.
Try an AI business intelligence tool!
But AI analysis is just a part of it all.
As I said, business intelligence covers various features and use cases.
Here’s a simple list of what falls under the “business intelligence” umbrella term to make it clearer.
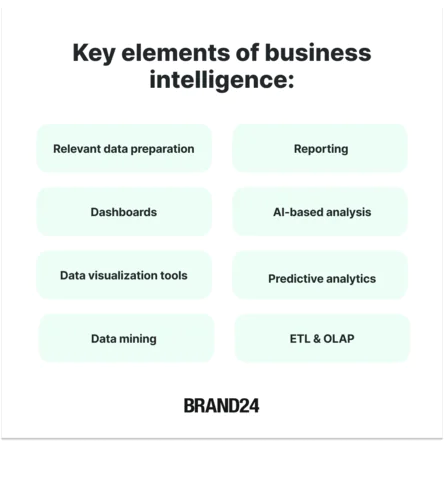
Key elements of business intelligence:
- Relevant data preparation
- Dashboards
- Data visualization tools
- Performance metrics and benchmarking
- Reporting
- Artificial intelligence analysis
- Predictive analytics
- Data mining
- ETL (importing data capabilities)
- OLAP (online analytical processing)
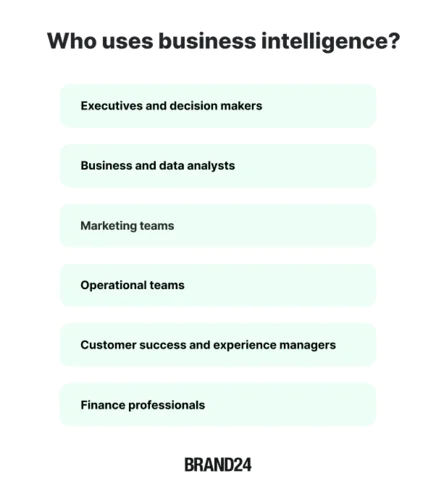
Who uses business intelligence and why?
Business intelligence (BI) is used by a wide range of professionals and organizations, including:
- Executives and decision makers
- Business and data analysts
- Marketing teams
- Operational teams
- Customer success and experience managers
- Finance professionals
Across industries such as:
- Finance
- Retail
- Healthcare
- Manufacturing
- Technology
- & more!
These business users rely on BI tools to gather, analyze, and visualize large volumes of data in order to make more informed decisions.
Get one tool for your whole organization!
How can specific roles benefit from using BI tools?
- Executives and decision-makers: to track company-wide KPIs and performance metrics.
- Business analysts and data teams: to analyze trends, build reports, and run forecasts.
- Marketing teams: to measure campaign effectiveness, understand customer behavior, and calculate ROI.
- Operations and supply chain managers: to optimize logistics, reduce costs, and streamline processes.
- Customer Success and Customer Experience managers: to monitor customer satisfaction trends, track support issues, and identify opportunities to improve retention and loyalty before problems escalate.
- Finance professionals: to monitor expenditures, forecast revenue, and assess financial performance.
Try business intelligence now!
For all the above groups, the primary reason for adopting BI is to transform raw data into insights.
This can support strategic planning, enhance operational efficiency, and give a competitive edge.
Types of business intelligence analysis
Business intelligence isn’t just about one type of report or dashboard.
It includes several types of analysis:
- Ad hoc analysis – quick, on-the-spot queries to find specific answers. Great for one-off questions, but often reused in regular reports.
- OLAP (Online Analytical Processing) – lets business users explore data from multiple angles (e.g. by time, region, product) to uncover deeper trends.
- Real-time analysis – tracks and analyzes data as it comes in, useful for things like customer behavior and sentiment analysis, stock levels, or monitoring campaigns.
- Embedded analytics – integrates reports and insights directly into apps like CRM or ERP, so users don’t need to switch tools between big data warehouses and analytics.
- Collaborative BI – makes it easier for teams to work together on data by adding comments, notes, and sharing capabilities.
In practice, the types above mix a lot and most of the modern tools provide it in one place.
Use BI and be one step ahead!
What is business analytics?
Business analytics is the practice of using data, statistics, and machine learning to explain:
- Why did things happen?
- Predict what might happen next.
- Recommend what to do.
It goes beyond data collection and reporting to uncover patterns through data mining, modeling, and predictive analytics.
Analyze your business performance!
The goal of business analytics tools is to test hypotheses, run forecasts, and deliver data analysis insights that can help improve the business strategy.
Key features of business analytics:
- Spotting patterns in data
It aims to find trends in your business users’ data that might otherwise go unnoticed. - Predicting what’s next
Analyzes historical data to forecast things like sales changes, customer behavior, or market shifts. - Recommending actions
The outcomes can suggest steps to improve your business results. - Testing “what‑if” scenarios
It explores how changes, like raising prices or launching a new product, could impact your performance. - Turning complex data into visuals
Includes clear dashboards and charts that make insights easy to understand. - Learning and improving with AI
It uses machine learning to make predictions more accurate over time.
So… it sounds very similar to the BI, doesn’t it?
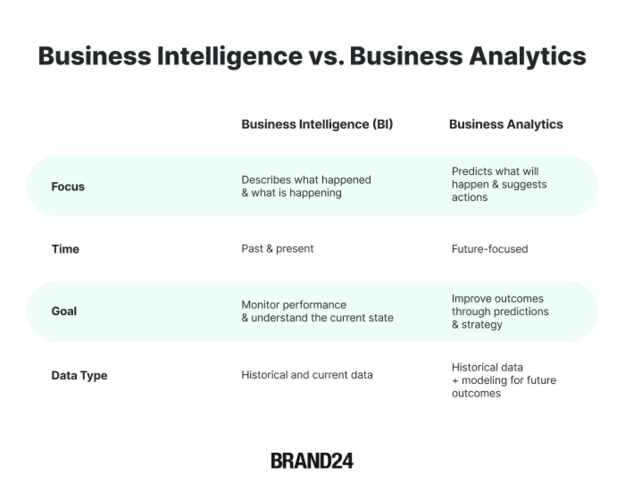
Business Intelligence vs Business Analytics: What’s the Real Difference
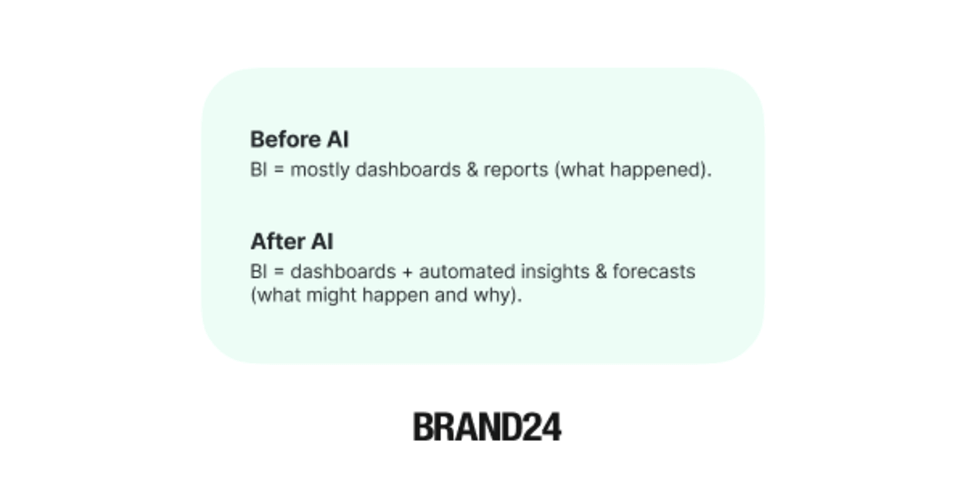
The most commonly mentioned difference between business intelligence and business analytics is that the former focuses on the past and the latter on the future.
- Traditional business intelligence (BI) focuses on descriptive analytics.
It looks at historical and current data to explain what happened and how your business reached its current state.
So, it’s all about reports, dashboards, and KPIs that help make data-driven decisions today. - Business analytics is forward-looking.
It uses data mining, modeling, and machine learning to predict trends and recommend actions for better future outcomes.
Try business intelligence now!
Simply said:
BI tells you what and why things happened, while business analytics predicts what could happen next and how to respond.
But the terms are often used interchangeably, and pros admit that the boundary is blurred in practice.
Tableau says the distinctions are “subtle” and commonly mixed in everyday use.
Especially as the BI tools are using AI for more and more predictive analysis.
How has artificial intelligence changed BI tools?
Modern BI tools don’t just describe the past.
They also analyze patterns and predict trends using AI.
For example, a BI platform can automatically detect unusual drops in sales and forecast which customer segment might churn next.
This is where BI and business analytics overlap.
Use an AI-based BI tool!
That’s why modern business intelligence tools are different.
10 Reasons why business intelligence is important
The truth is that a good business intelligence technology will improve your company in many ways.
Generally speaking, it will make your business operations processes more informed, tailored, and efficient.
Improve your processes using BI!
How?
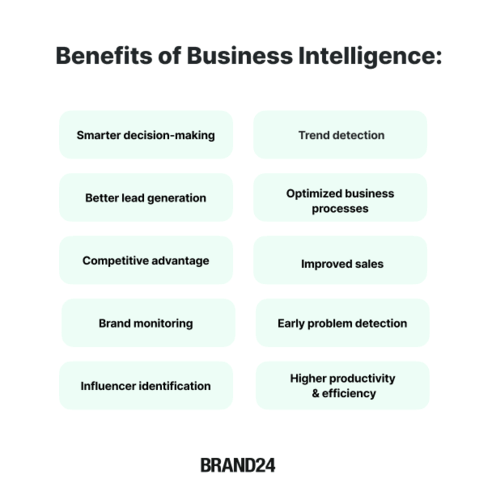
Here’s a list of business intelligence benefits for your organization:
- Smarter decision-making
BI delivers real-time insights, helping teams make confident decisions based on actual data analytics. - Better lead generation
With data integration from various sources (campaigns, websites, social media), BI helps identify the most promising sources of leads. - Competitive advantage
With competitor tracking and market analysis, you can spot opportunities and respond faster than your rivals. - Brand monitoring
BI tools track media mentions and sentiment, allowing you to manage your business reputation and respond quickly to feedback. - Influencer identification
You can identify key influencers talking about your brand or industry and discover the most impactful people to work with. - Trend detection
BI highlights emerging patterns in customer behavior or market shifts so you can act on trends before they go mainstream. - Optimized business processes
By analyzing internal workflows, BI reveals bottlenecks and inefficiencies that you can fix to streamline operations. - Higher productivity and efficiency
Automated reports and dashboards reduce manual work and let your team focus on taking action. - Early problem detection
BI can alert you about any anomalies and negative shifts early, helping you fix issues before they escalate. - Improved sales
Better forecasts, smarter targeting, and real-time performance tracking all contribute to higher conversion and growth.
How does business intelligence work?
Business intelligence is a complex, ongoing process. But it actually is based on a few steps.
Try business intelligence now!
Here’s how it usually looks:
01 Collect data
The first step is gathering data from as many different sources as possible. This can include:
- Website analytics
- CRM systems
- Sales data
- Customer feedback
- Brand mentions
- External data, like market trends or competitor activity
For example, I used Brand24 to collect data about Astronomer, and within a few clicks, I got the analysis:
- Astronomer got 36k mentions over the last 30 days.
- Over 4k of them were negative, and only 2k were positive.
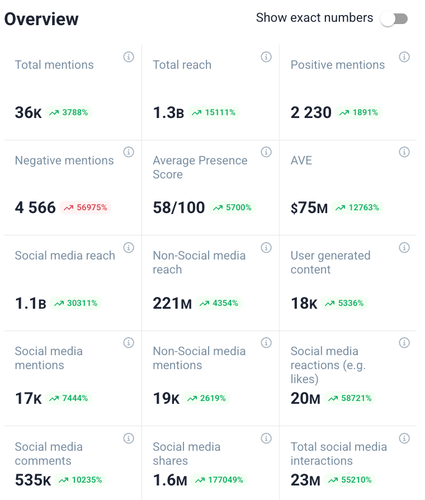
- The situation is starting to settle down – the significant number of negative mentions was around 18th July, and it is currently going down.
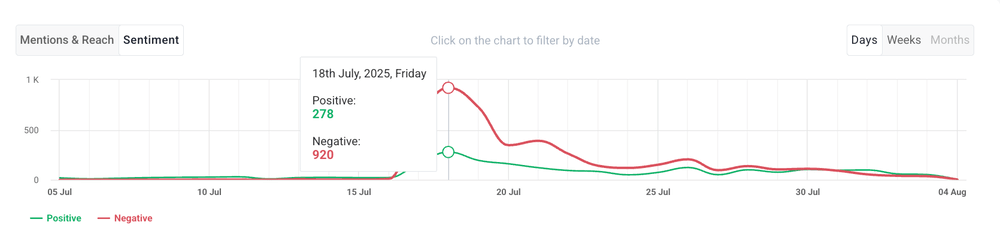
The relation between negative (4.5k) and positive (2.2k) mentions seems alarming at first glance.
However, when placed in the context of a 1.3B total reach (a massive increase), it’s clear that the controversy has also significantly amplified visibility.
This data highlights a nuanced reality of digital crises: reach and virality can often outweigh sentiment in short-term brand exposure.
The most important thing is the image of the brand that will stay with the public in the long run.
Manage your company using BI!
02 Filter the data
Business intelligence tools process enormous amounts of data, so using filters is crucial to make sense out of it all.
With Brand24, you can filter analysis and insights by:
- Sentiment (positive, negative, neutral)
- Platform (Instagram, YouTube, X, news, blogs, etc.)
- Location and language
- Influencer score
- Keyword groups and tags
These filters help you zoom in on exactly the insights that matter to your brand or campaign.
Conduct analysis that really matters!
So, in the Astronomer case, I was able to filter the analysis by the keyword “Coldplay” to check what’s going on with the PR crisis:
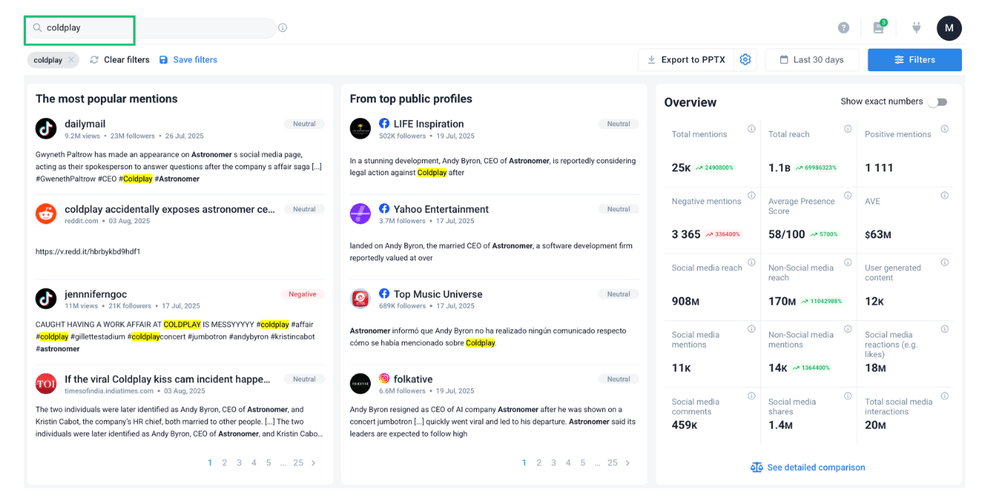
03 Analyze data or use AI
Once you’ve narrowed down your data, it’s time to dive into analysis…
Or do it within seconds using AI.
With AI Brand Assistant, you can get:
- Insights summaries
- Quick detection of unusual spikes or drops
- Highlighted opportunities and risks
- Ready-to-use explanations
- Market presence and competitors analysis
This can save you time and make data-driven decisions so much faster.
Try AI Brand Assistant for your case!
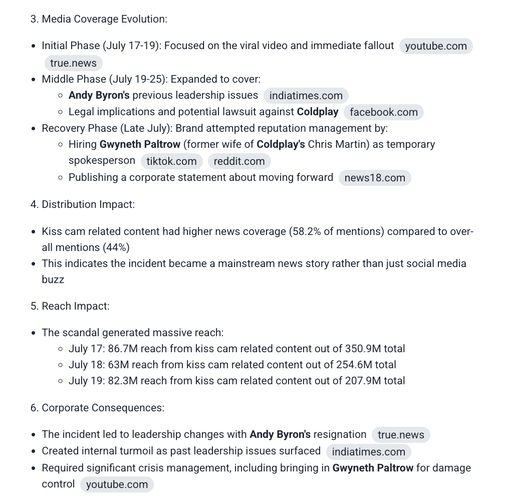
For example, I used this prompt:
How did the kiss cam scandal affect the brand reputation of Astronomer?
And got such analysis:
04 Pay attention to topics
Business intelligence can also help you understand the broader perspective on your brand.
For example, Brand24 has an AI Topic Analysis feature that groups your data into key topics that reveal what’s driving the conversation.
By analyzing specific themes, you’ll uncover deeper insights into what your audience truly cares about.
Check what people say about your brand!
05 Set up reporting
Reports are essential, especially for enterprise teams who need consistent, up-to-date overviews.
With business intelligence reporting tools like Brand24, you can:
- Automate regular reports (up to your needs)
- Customize what metrics to include
- Share dashboards with stakeholders (via a simple link, without registration)
- Export data in PDF or Excel format
Plus, it’s really easy to create a report. A few clicks, and the magic happens, including data visualizations and alerts.
Get custom, automated reports!
This ensures that everyone stays aligned!
06 Tailor your business strategy
The final (and most important) step is to apply the insights to your real-world strategy.
Use what you’ve learned to:
- Adjust campaigns based on your business data
- Improve customer experience
- Track KPIs over time
- Continuously monitor and refine your tactics
Business intelligence isn’t really about gathering data – it’s about transforming information into action.
…and doing it consistently over time.
Try business intelligence now!
FAQ
How is business intelligence (BI) different from business monitoring?
Business intelligence (BI) analyzes historical and current data to support strategic decision-making, while business monitoring focuses on tracking real-time operational metrics and system performance.
- BI answers: “What happened, why, and what might happen next?”
- Monitoring answers: “What is happening right now?”
Example: BI may show a sales drop trend over months, while monitoring alerts you instantly when a system fails.
Monitor your business… & act!
How is business intelligence (BI) different from business research?
BI is data-driven and often automated, extracting insights from structured internal data (sales, user behavior).
Business research is more qualitative and exploratory, often involving surveys, interviews, or market analysis.
- BI supports operational and tactical decisions.
- Research supports strategic planning and new market exploration.
Example: BI identifies a drop in app usage. Research discovers that users find the UI confusing.
Try business intelligence now!
How to measure the success of business intelligence (BI) efforts?
You can evaluate BI success using a combination of quantitative and qualitative metrics:
- The adoption rate of BI tools across teams
- Improved decision-making and accuracy
- ROI (revenue gains, cost savings, or reduced churn)
- Data accessibility and dashboard use
Example: A 25% increase in marketing ROI after implementing a BI and identifying new market gaps shows success.
Boost your business with BI!
What is a business intelligence (BI) analyst?
A Business Intelligence Analyst is a professional who turns raw data into insights. Key responsibilities include:
- Collecting and cleaning data
- Creating reports and dashboards
- Performing trend and predictive analysis
- Advising business stakeholders using data-driven insights
Try business intelligence now!
What’s the history of business intelligence (BI)?
The first use of the term “Business Intelligence” was in 1865 by Richard Millar Devens.
BI has evolved from static reporting to real-time, AI-powered analytics that support predictive and prescriptive decisions.
Try BI tool for free!
How does business intelligence (BI) help in decision-making?
Business intelligence empowers data-informed decisions by:
- Aggregating and centralizing business data
- Revealing trends, anomalies, and root causes
- Predicting outcomes with historical models
- Providing visual insights for non-technical stakeholders
Example: A retailer uses BI to identify low-performing products and adjust inventory, boosting profit by 18%.
Make decisions based on real data!
Can business intelligence (BI) be automated?
Yes. Many BI tasks like data integration, reporting, and alerts can be automated using ETL pipelines and AI-enhanced platforms.
Automate your processes and save time!
What are the best business intelligence (BI) tools?
Popular platforms include Microsoft Power BI, Tableau, Looker, Brand24, Meltwater, Qlik, and Mode Analytics.
Try an AI business intelligence tool!
Is business intelligence (BI) only for large enterprises?
No. SMBs can also benefit from business intelligence as long as they can manage the costs (it is usually pricey for smaller companies).
Try a business intelligence tool for free!

Related articles
-
 Show article >
Jul 21, 202519 min reads
Show article >
Jul 21, 202519 min reads -
Show article >
Jan 10, 202515 min reads
-
![9 Steps to Strong Brand Awareness Strategy [2025]](data:image/svg+xml,%3Csvg%20xmlns='http://www.w3.org/2000/svg'%20viewBox='0%200%20600%20283'%3E%3C/svg%3E) Show article >
May 10, 202421 min reads
Show article >
May 10, 202421 min reads -
Show article >
Sep 3, 202422 min reads
20 PR Tools I Tested and Loved: Best Tools Choices for PR Managers in 2025
-
Show article >
Jul 1, 202518 min reads
![9 Steps to Strong Brand Awareness Strategy [2025]](https://brand24.com/blog/app/uploads/2020/12/15-The-ultimate-guide-to-brand-awareness-1400x660x2.png)