Table of contents
How to Create a Bluesky Report? Template & Example [2026]
Creating a well-prepared report can be a tough task. It means gathering lots of data, analyzing it, and drawing conclusions. It’s especially hard for Bluesky, which is a relatively new platform, and there’s no analytics inside the tool.
However, this social platform can be your winning strategy and is totally worth it to do marketing there. Therefore, you need a way to evaluate your efforts. Well, here it is!
Read on to learn how to conduct a Bluesky report!
Quick summary:
- A Bluesky report is a crucial document that helps you evaluate your progress.
- It will include different metrics based on what you want to achieve on Bluesky (for example, boost awareness – the volume of mentions).
- AI tools can help you generate detailed reports in minutes and save you time for more important stuff like strategic thinking.
What is a Bluesky report?
The Bluesky report is a document that shows your brand’s efforts on the platform. Whether you use it for marketing purposes or to manage your reputation, a report is a handy summary to show to your managers.
Bluesky reports offer valuable insights into the brand’s growth and efforts.
It can include various metrics like reach, sentiment, or number of mentions. It all depends on what goals you have for Bluesky.
So, without further ado, let’s check how you can create your Bluesky report!
Bluesky report template
My favorite way to do this is by using AI. Why?
It makes it much faster and more efficient.
I think we can agree that those tools are simply better at counting and analysing!
I like to use a social listening tool, Brand24 for that – it gathers the data, analyses it and has a great reporting feature. I can easily generate a comprehensive report with just a few clicks.
Can’t believe?
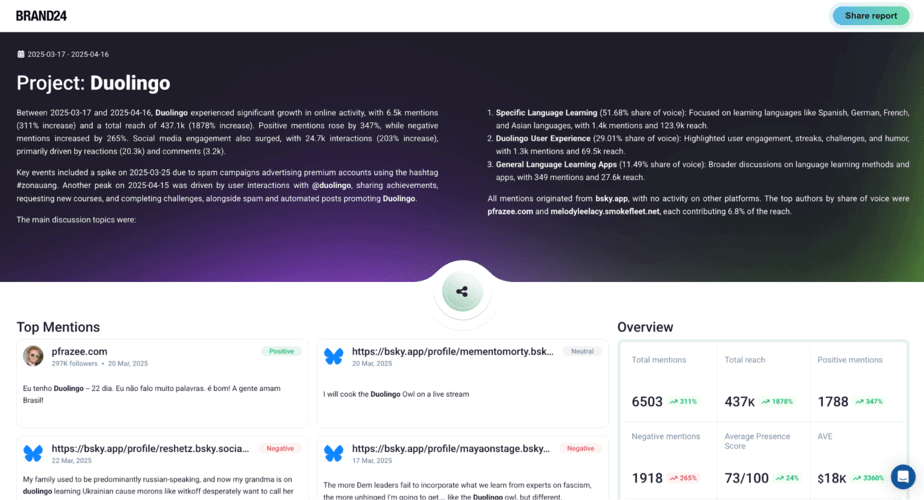
Well, here are a few examples of general reports I created for my Reebok project.
It took me about 5 minutes to do. Take a look!
I didn’t add any specific filters to them to show you their whole potential.
However, if you need a narrower report, you can filter by:
- Specific platform
- Sentiment
- Time period
- Specific keyword (for example, product name)
- & more!
To generate a Bluesky report for your business, you need to:
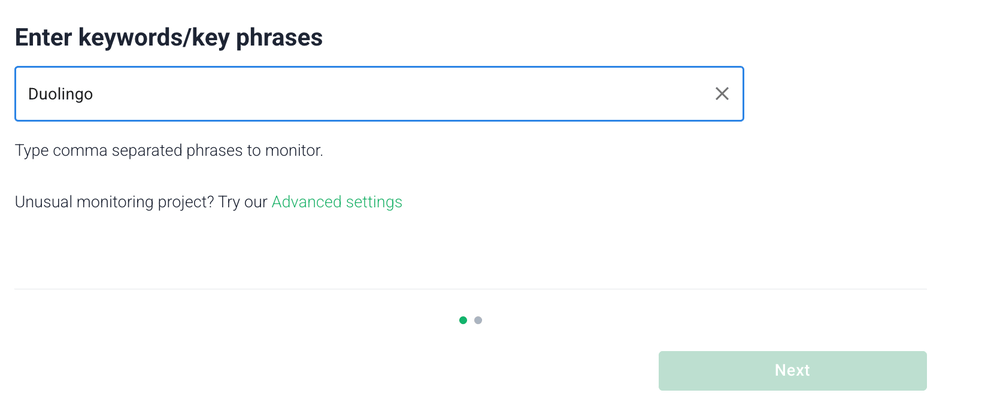
- Set up a media monitoring project for your keyword (business name, product name, anything relevant).
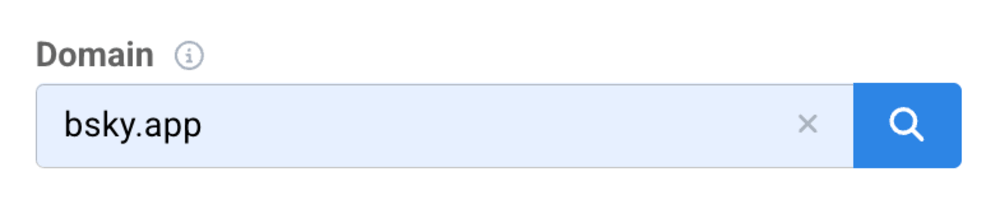
- Add the domain filter for “bsky.app”.
- Add any other filters you want.
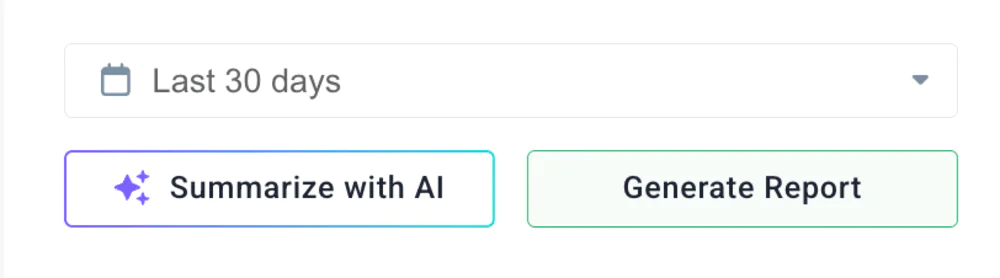
- Click “Generate Report”.
It creates a report that you can share using a simple link.
The person you want to share it with won’t have to register and doesn’t need a Brand24 account.
I encourage you to test this way of creating Bluesky reports.
But, if you prefer to do it manually – here’s how!
How to create a Bluesky report? 5 steps
01 Choose your goals
Your report will look totally different depending on your goals.
So, start by defining what you expect from your Bluesky marketing efforts.
It can be lead generation or boosting brand awareness… or simply reaching new audiences. These will naturally form your report goals.
To make things easier, I created a list of the most common Bluesky report goals.
Most common Bluesky report goals include:
- Monitoring whether the marketing strategy works as expected
- Identifying new opportunities
- Finding potential leads
- Understanding the target audience better
- Reporting to the manager about the marketing performance
02 Choose key metrics
The next step is choosing the metrics you’ll track. They’re linked to the goals.
Based on your Bluesky report goals, you can check the right metrics that answer those areas.
Here’s a list of key Bluesky metrics you should include in your report:
- The volume of mentions
- Reach
- The number of followers
- Sentiment
- Engagement rate
- Impressions
- Social media reach
- Click-through rate (CTR)
- Advertising Value Equivalency (AVE)
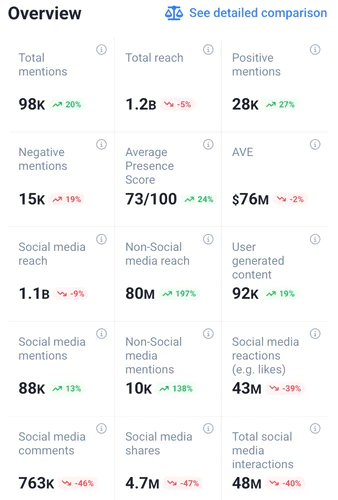
Here’s what those metrics look like in the Brand24 dashboard:
03 Remember about data visualizations
I love when reports are just a wall of text and I struggle to define what’s in it…
Actually, this is me when I see such reports:

Remember, every report should focus on UX friendliness and include visuals.
These can be data visualisations, charts, infographics, or even a meme if this fits your organization’s culture.
Otherwise, it will make it’s reader fall a sleep, and it won’t be a good one.
04 Present campaign insights
In your Bluesky report, you should include any important notes about the campaigns you did.
Focused on engaging on the platform?
Talk about it!
Make sure to mention how it performed, what the expected results were, and what the outcome was.
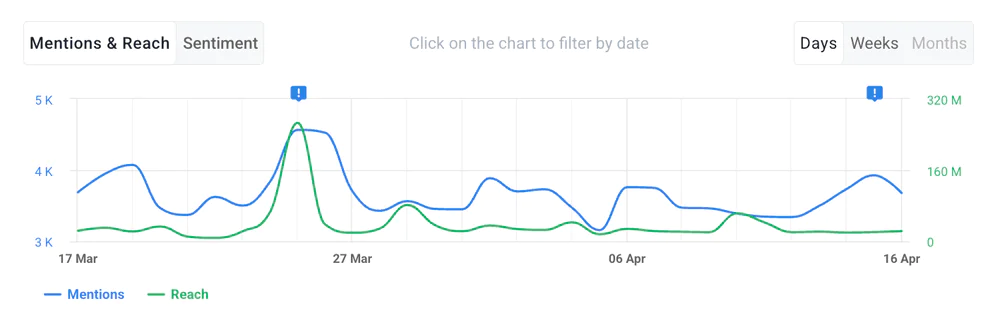
Duolingo got over 6.5k mentions on Bluesky during the last 30 days, which generated an estimated reach of over 437k.
Fantastic result!
05 Compare data over time
If you want to draw conclusions (and that’s usually the main goal of reports), make sure to do comparisons.
You should compare your performance over time to be able to check whether your strategy’s working or need some improvements.
I like to use the “Compare periods” feature for that. Here’s what it looks like:
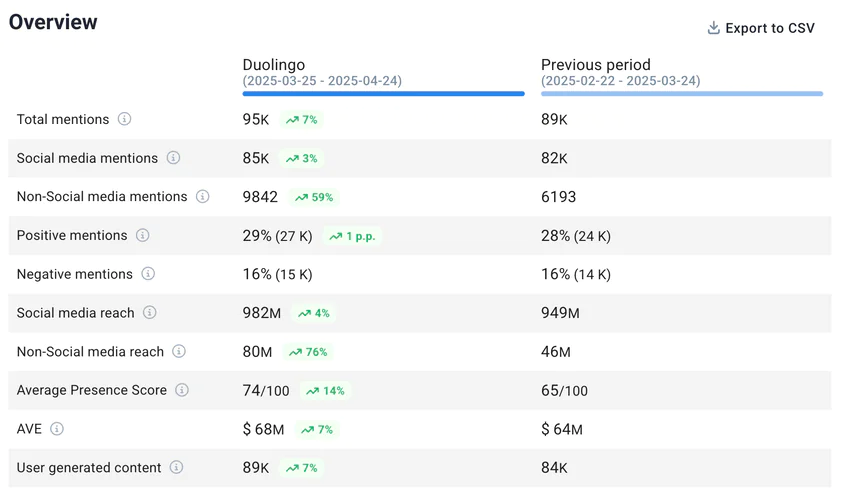
I compared Duolingo’s last month’s performance on Bluesky with the previous one.
06 Compare data with rivals
You should also benchmark your performance with your competitors.
It shows where you stand on the market and can be a fantastic opportunity for growth ideas.
Perhaps your rivals found a winning strategy you can also use?
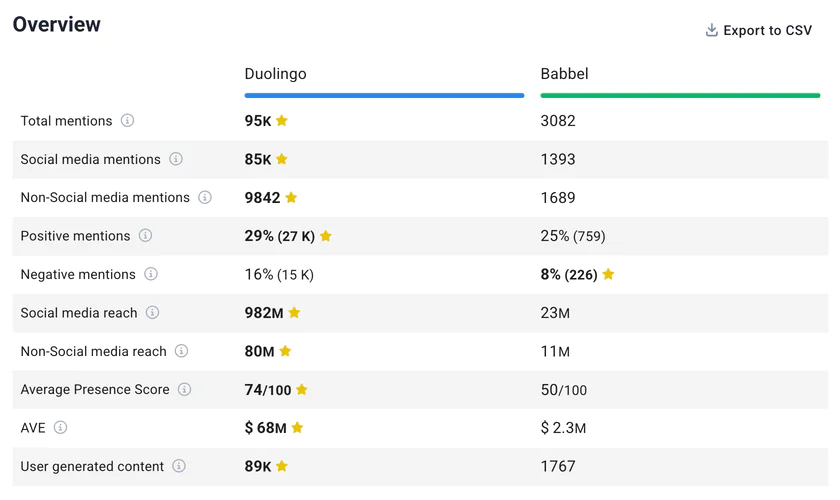
I compared Duolingo’s performance with Babbel’s:
07 Add summary
The simpler, the better.
So, why not include a quick summary in your report?
I always ask AI Brand Assistant to generate a short project summary for me, and I like to include it. Here’s what it looks like:
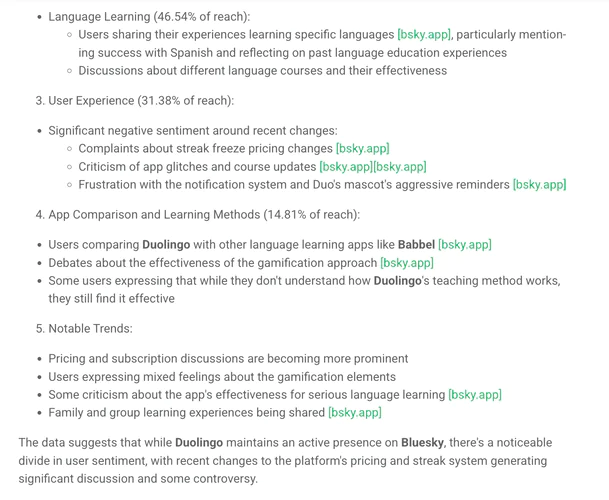
It highlights the crucial events and performance.
08 Include plans and recommendations
Another good practice is to include specific plans or recommendations for improvements.
Sometimes, you have it right in front of you as something specific in your Bluesky campaign needs improvement.
But, there are times you struggle more and what’s helping me with this task is… again AI.
To find AI recommendations, I go to AI Insights > Recommendations.
And this is what I get:
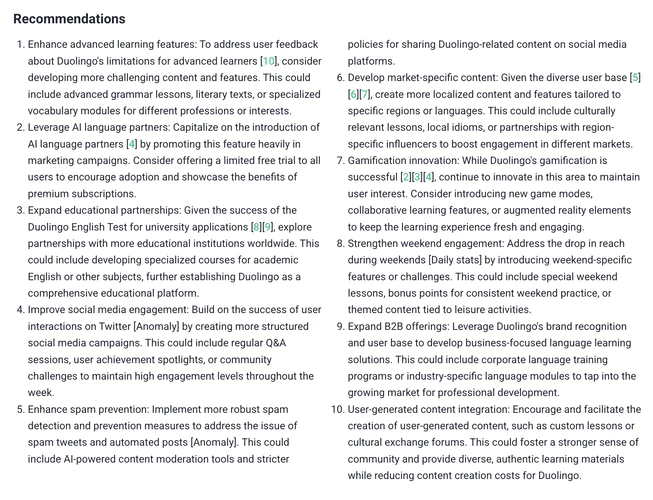
A detailed list of things that my brand could do to improve performance.
09 Automate your reports
Finally, make sure to monitor your Bluesky performance regularly.
Many tools can simplify it and provide you with automated reports weekly, monthly, or any other period you need to report.
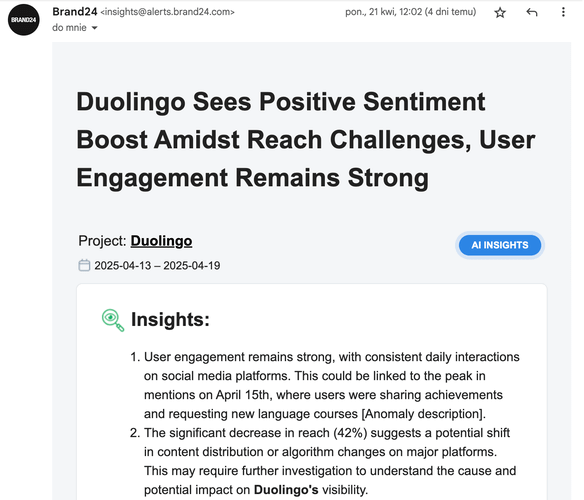
In Brand24, you can get an AI insights report delivered right to your mailbox:
Good practices
Creating a Bluesky report shouldn’t be about adding random numbers and calling it a day. It aims to tell a story that will make a difference.
So, do your best to attract your reader and make it easy to understand.
Below are some tips that will help your report actually get read:
- Tailor to your audience
Before diving into the data, think about who will read the report. Is it for your manager? A stakeholder? The whole marketing team? Tailor the tone, level of detail, and focus areas accordingly.
- Highlight the important stuff
Use bold headlines, visuals, or icons to spotlight what really worked.
- Use visuals
Replace endless bullet points with charts, graphs, and screenshots. People process visuals faster than text!
- Tell a story
Data alone is boring and doesn’t add much. Walk your reader through what happened and why. Add short narratives or annotations that connect the dots between numbers and actions taken.
Conclusion
Creating a Bluesky report may seem tricky at first, especially with limited built-in analytics.
But once you get into it, you realize it’s an essential tool for tracking your brand’s progress on the platform.
Final thoughts:
- A great Bluesky report starts with clear goals. Know what you want to achieve and track the right metrics.
- Make your report engaging! Use visuals, real campaign highlights, and simple summaries to bring the data to life.
- AI is a great help for Bluesky reports. It can generate detailed reports faster and automate the Bluesky reporting process.
So go ahead! Start your Brand24 trial and generate your first Bluesky report today!

Article Reviewed by