How Can Media Monitoring Help Data Journalism?
Table of contents
Data journalism is the answer to the flood of information we all have to deal with every day. Data journalism is all about explaining the complicated world around us in a comprehensible manner.
There are two main problems when it comes to data analysis.
Firstly, the amount of information we have to process is astounding.
We are bombarded with relevant and irrelevant news and it’s impossible to process every message and put it in one coherent story. As a result, we sometimes get lost in the sea of information and need a guiding hand to help us navigate to understand what’s going on.
Secondly, there is the issue of the quality of data. Fake news spread fast on the Internet and it’s sometimes impossible to distinguish between real piece of information and a carefully crafted fake news.
That’s where data journalism comes to the rescue.
Data journalism tries to explain the world of numbers in a comprehensible way.
The main aim of data journalism is to simplify a complicated story. The stories in data journalism are represented via dedicated landing pages or infographics.
A great example of data journalism is a story published by The Guardian. The newspaper gather many different information regarding hard to understand topic and present it with an informative infographic.
Data journalism is all about making the complicated world and its processes understandable.
That doesn’t mean, however, that data journalism is only for the big players in the news world.
More and more local newspapers and independent news outlets implement data journalism into their content. Data journalism spread fast on the Internet – people tend to share well-researched, informative content.
That has a positive effect on both social media and Google algorithms.
No one really knows, how the algorithms work exactly. The knowledge is based on observations and some scarce details released from time to time by Google or other social media entities.
One of the factors that could affect the position of your article in search engines, is social proof – how often people share and interact with your content.
That’s why data journalism content has a great potential for high ranking in social media feeds and search engines.
Before you delve into the world of search engines algorithms, you need to answer two questions:
- How to gather relevant data for your story?
- How to present your story in a way readers will understand the issue and find it compelling enough to react?
Here’s what we’re going to cover:
Media monitoring and data journalism
How can media monitoring help data journalism?
Journalism, even in the modern era, is all about listening to what people have to say, and carefully analysing the talk.
Media monitoring tools were developed to collect and analyse publicly available online mentions.
In theory, media monitoring and data journalism look like a match made in heaven.
As journalists, you need proof of that statement, don’t you?
Let’s see what media monitoring has to offer!
All the metrics are based on the results offered by Brand24, a robust media monitoring tool, at least, according to Buffer.
You can test Brand24 for free, for 14 days, no strings attached. We won’t ask for your credit card number.
Create a project
Before you start analysing the results, you have to set up a project.
There are three steps in project creation. I know it sounds like a lot, but putting more effort in project settings will provide you with more valuable results.
Firstly, choose what you want to monitor. When it comes to media monitoring, the sky is the limit.
To make the project setup a bit easier, we divided the topics into three groups:
- brands
- competition
- topic/hashtag
As a journalist, you’re probably mostly interested in brands or topics/hashtags.
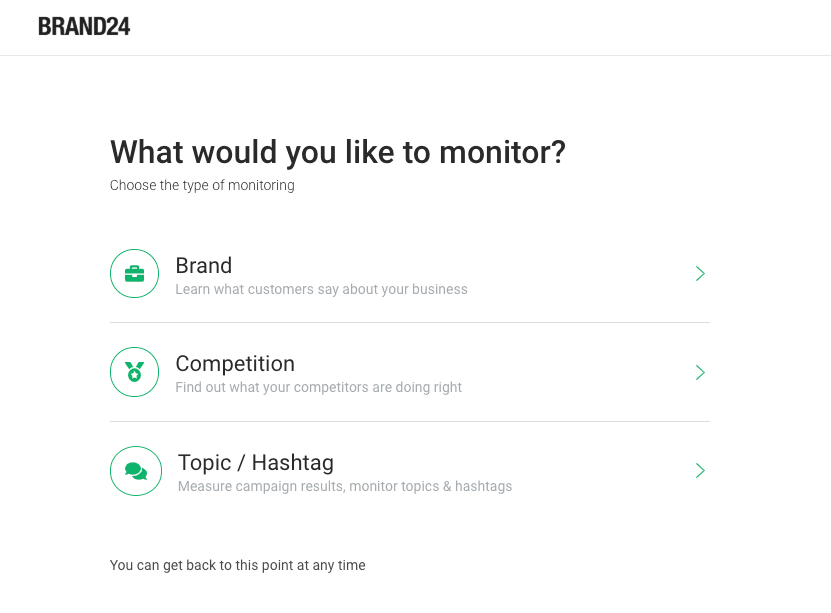
Your projects are not set in stone. If, at a later stage, you decide to change the settings, you can always come back.
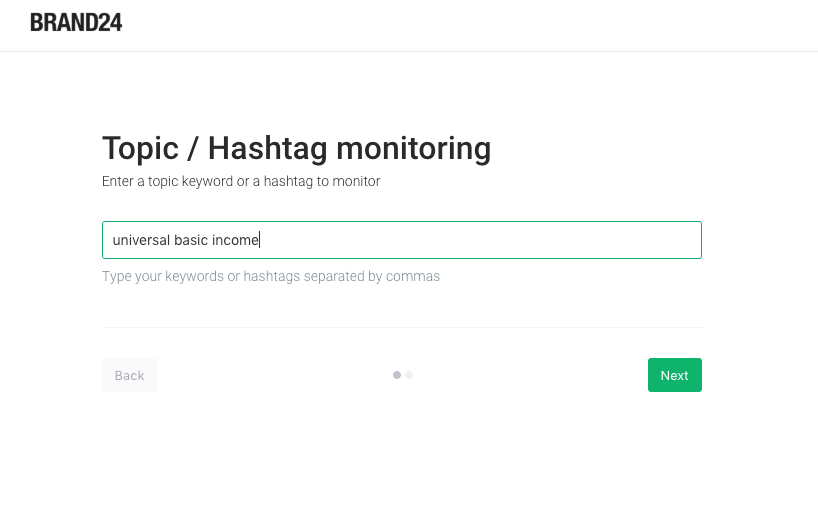
In the second step, you can choose the terms you’d like to monitor. One project can monitor multiple terms, but you can also set one keyword per project.
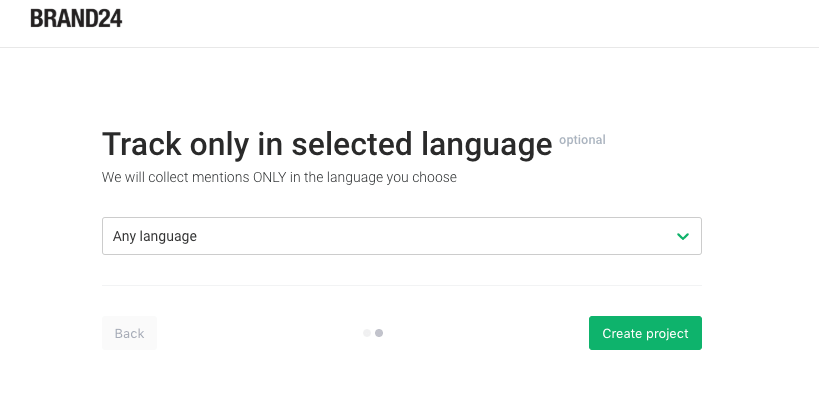
In the last step, you can choose the language you’d like to monitor. That’s an optional step – you can always filter the results by language in the dashboard.
Data journalism metrics
Once you set up your project and give media monitoring some time to collect the mentions (media monitoring tools, in general, don’t provide historical data), you can take a closer look out our analytics!
What’s in there for you?
Let’s take a closer look at the metrics!
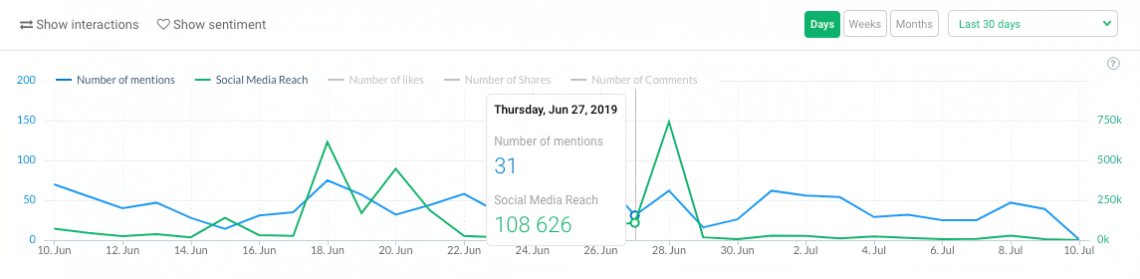
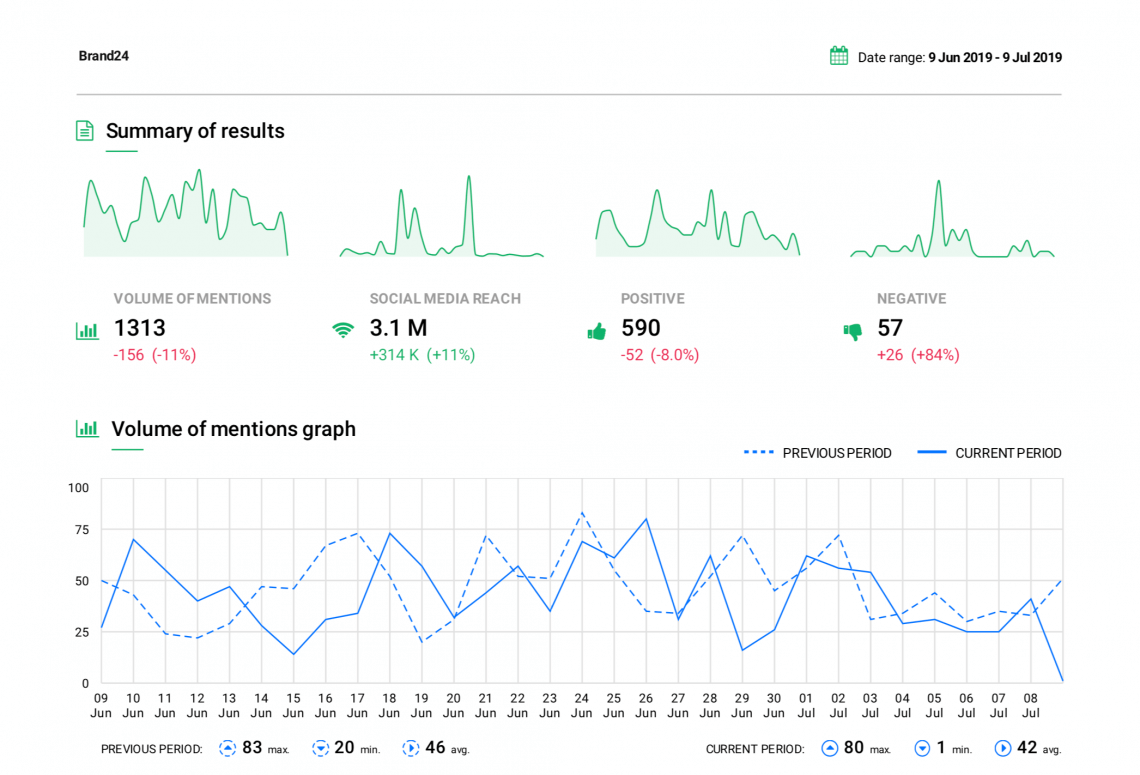
1. The volume of mentions
The volume of mention is the basic metric you should start with.
The volume of mentions shows how often a certain term has been used in an online discussion within a given time range.
You can look for spikes in the number of online mentions.
In the social media marketing world, spikes in the number of mentions usually indicate either a successful social media campaign or a social media crisis in the making.
What does it indicate in the data journalism world?
It means that a certain topic is being discussed online. Internet users can spot some controversies around a certain topic and be the first ones to talk about it online. Spotting the changes in the volume of mentions can help you determine when the chatter began.
2. Sentiment analysis
If the volume of mentions is the cake, then the sentiment analysis is the icing.
It’s not enough to know that people are talking. Emotional intelligence is as relevant in today’s world as hard numbers. The convey an important message.
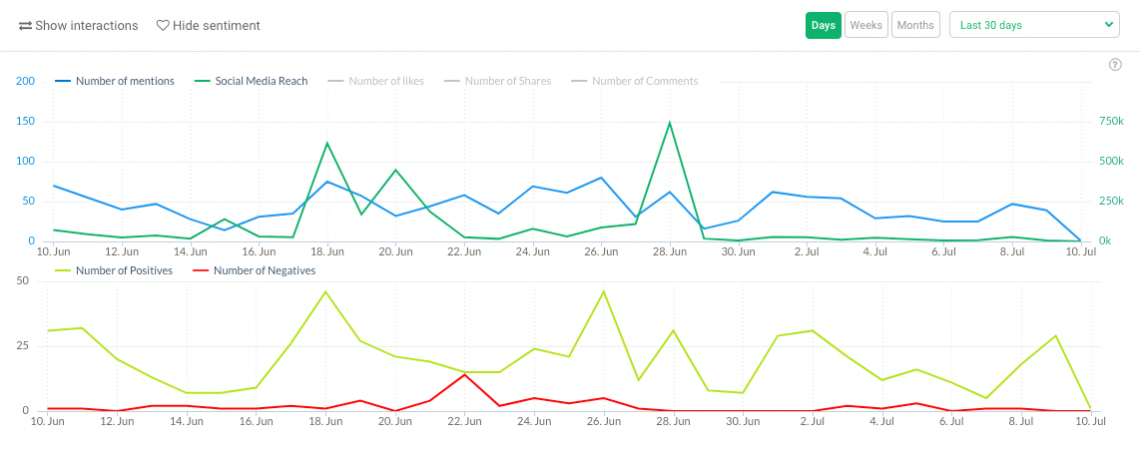
Sentiment will tell you how people feel about a certain topic. Are they talking in a positive way? Neutral? Or maybe they simply hate the issue and they demonstrate it in their online talk?
3. Type and number of interactions
Now, we start talking about the data journalism “meat” – hard numbers you could interpret and analyse.
Let’s start this section with type and number of interactions.
People will react to online posts. How they react is important for data journalists.
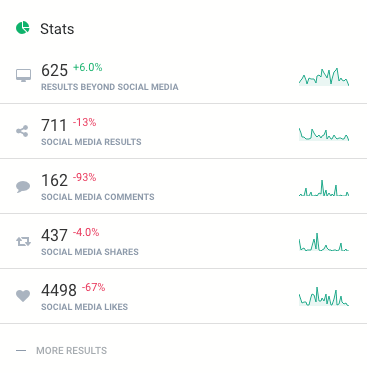
Leaving a comment or sharing content on social media requires more effort than just leaving a thumbs up. Commenting and sharing is vouching for the post with your name.
The more comments and shares content have, the more valuable, in the eyes of the audience, it is.
4. Estimated social media reach
The estimated social media reach could be one of the most interesting media monitoring metrics for data journalists.
Social media reach will tell you how the monitored content spreads around the Internet.
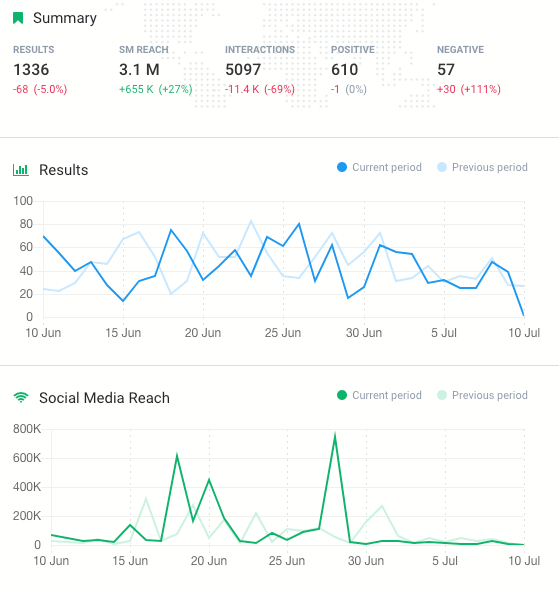
In the world where algorithms decide who can see certain type of content, monitoring how the posts spread is an important piece of knowledge.
5. Influence of social media authors
Most people either love or hate influencers. It doesn’t matter whether you’re a member of the former or the latter group, influencers have some real power over Internet users.
That’s why it’s important to know who can influence the audience.
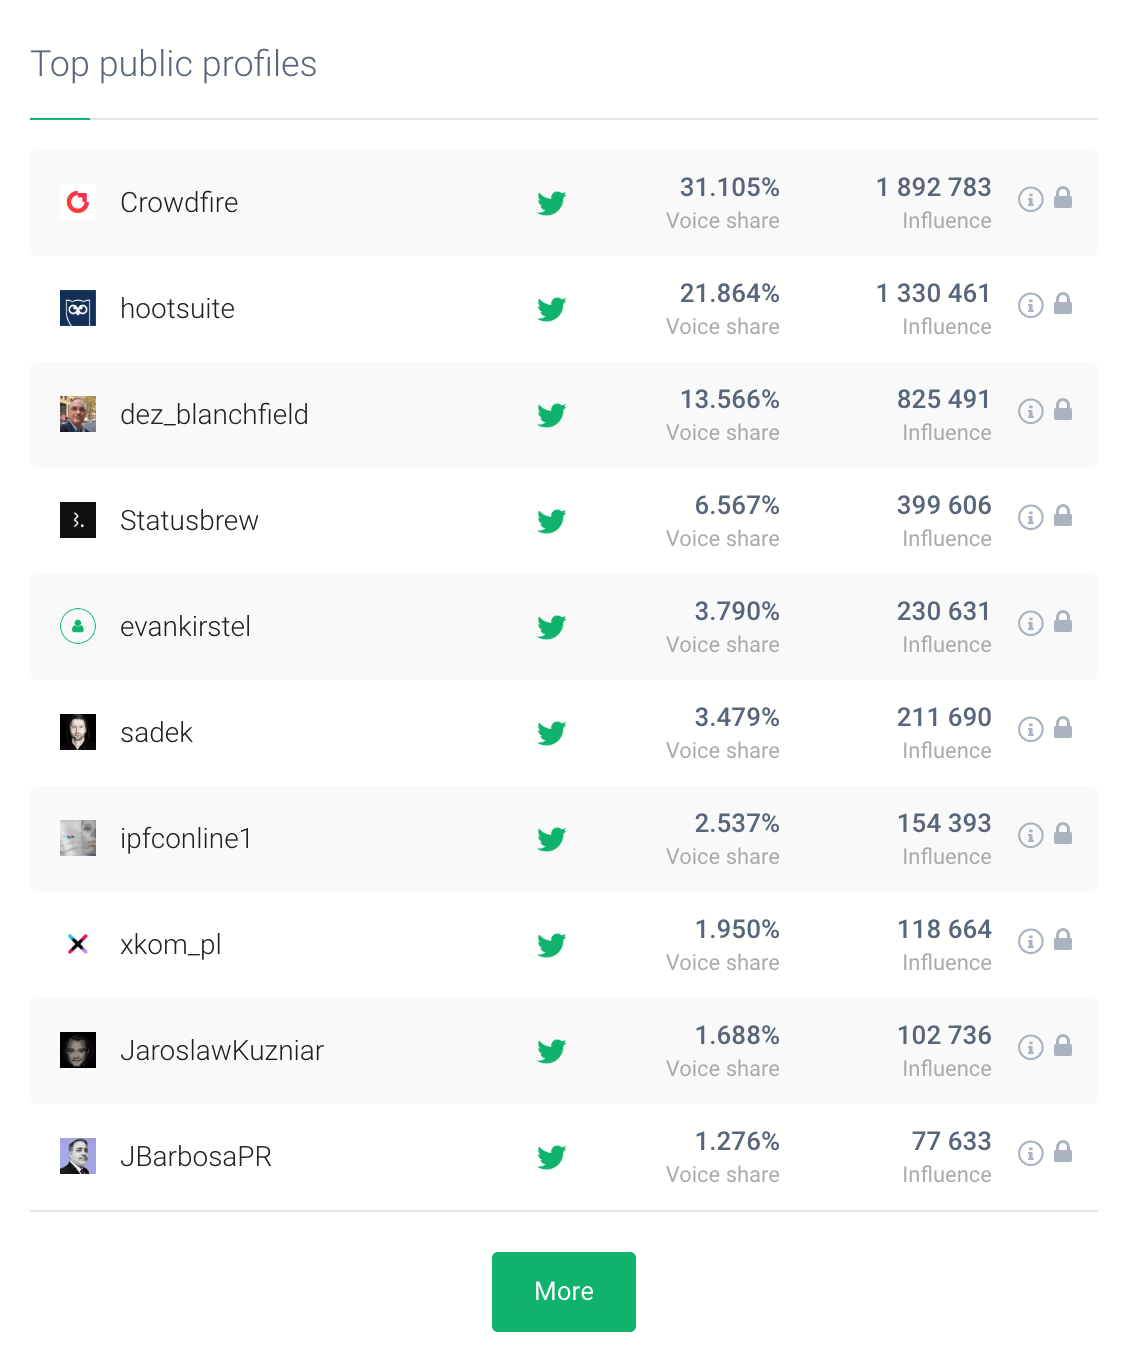
Media monitoring calculates the estimated number of views generated by a given authors that contain the phrase you monitor.
How is this beneficial for a data journalism project?
Firstly, you’ll know who is leading the conversation. You can analyse other content posted by the author and present their standpoint on the issue at hand.
Secondly, you can immediately see who the big player in the niche you are researching is.
Identifying the key players will also help you analyse the overall tone of the talk. It’s a great starting point for some further research.
6. The share of voice
The share of voice is a metric complimentary to the influence score.
It shows (as a percentage point) the number of online discussions generated by a particular social media author.
There’s a slight difference between the influence score and the share of voice.
Influencers usually have a high number of followers, their content generates a ton of likes and comments.
An author who generates a high share of voice is not necessarily an influencer in their field.
It might be someone who just posts content that goes viral and influence a lot of people.
Keeping an eye on these two metrics, influencer score and the share of voice, will give you a more holistic view of what’s going on.
7. Projects comparison
The last feature of social media monitoring that might be interesting for data journalists is project comparison.
By comparing two projects you can see which one generated more mentions (the mentions are divided by their source) and the overall sentiment of the project.
When is it useful?
For example, you can compare two (or more!) political messages to see which one was received better by the target audience or which social media channel did they use.
Data journalism tools
Once you gather all the data you need for your story, it’s time to show it in a comprehensible way.
To produce a powerful content, you don’t need a programming knowledge. Of course, some processes might be faster if you could use Python, but you’ll do perfectly fine without it.
There’s an abundance of tools when it comes to graphic design and infographics.
What’s in the toolbox of data journalist?
1. Brand24
Surprised to see Brand24, a media monitoring tool, in this section as well?
There’s more to the media monitoring tool than just an excellent data analysis.
Recently, we’ve redesigned our PDF reports to make them even more useful.
You can choose the data you’d like to include in your report, as well as add a logo or a description.
You can find visual data representation, most popular mentions, mentions per category, and many other metrics that will best suit your needs.
2. Excel spreadsheet
There’s beauty in simplicity. Don’t underestimate the good, old Excel spreadsheet.
Do you want to spot outliers and mistake in calculations? Then spreadsheet is your go-to tool.
If you need some more calculating power, take a look at some more advanced statistical programs, for example, SPSS.
3. Mecodify
A data journalism tool that will help you analyse and visualise big data. It’s especially useful, if you want to track Twitter, for example, compare events with Twitter activity. No coding or technical experience is required.
4. Google Data Studio
Another data journalism tool that do not require any coding experience and will allow you to present your research in a compelling way.
Feed Google Data Studio with your data and you will get engaging reports and tons of data visualization possibilities.
5. Density
Ever wondered how to monitor the crowd during various events? Density can help you with that!
You can measure the crowd density with a help of a sensor. The sensor will measure people as they come and go and will give you real-time data you could implement anywhere you need.
Is media monitoring helpful for data journalists?
Media monitoring has a lot to offer data journalism. With a help of social media monitoring tool you can:
- gather the publicly available data from the Internet;
- analyse the mention and determine social media reach, sentiment, and much more;
- access all the online chatter from one dashboard (no more hundred open tabs in your browser!);
- monitor online talk from all over the world in the language you choose;
- and much more!
Ready to give media monitoring a try?
HANDPICKED RELATED CONTENT
35 Journalism Tools and Resources with Real-Life Use Cases

Related articles
-
 Show article >
Apr 16, 202419 min reads
Show article >
Apr 16, 202419 min reads -
![How to do Social Media Sentiment Analysis in 2025? [Easy Guide, Benefits & More!]](data:image/svg+xml,%3Csvg%20xmlns='http://www.w3.org/2000/svg'%20viewBox='0%200%20600%20335'%3E%3C/svg%3E) Show article >
May 15, 202516 min reads
Show article >
May 15, 202516 min readsHow to do Social Media Sentiment Analysis in 2025? [Easy Guide, Benefits & More!]
-
Show article >
May 17, 202422 min reads

![How to do Social Media Sentiment Analysis in 2025? [Easy Guide, Benefits & More!]](https://brand24.com/blog/app/uploads/2023/03/social_media_sentiment_analysis_brand_image_blog_cover_615x345-600x335.webp)