Table of contents
2M Marketers

Think we’d just roll out a new comparison tab and call it a day? Not our style! We’re excited to introduce a feature nestled within this tab that’s about to revolutionize your benchmarking experience. Get ready to ask yourself, “How did I ever live without this?” as we show you the possibilities of period comparison.
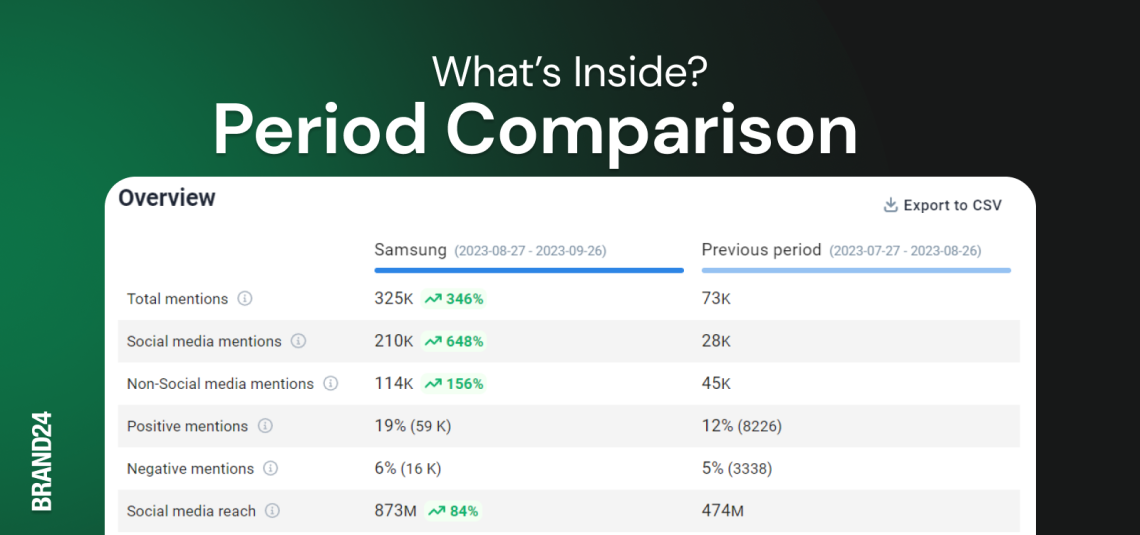
Table of contents:
- What’s It All About?
- Benefits for Businesses and Individuals
- How to start?
- Key Features of Period Comparison
- Why do you need it?
What’s It All About?
What’s the fuss all about? Period comparison enables users to analyze and contrast data related to their brand, products, or services over different time periods. This functionality is designed to empower businesses and individuals with the ability to make informed decisions by providing them with valuable insights into how their online presence, reputation, and performance have evolved over time.
Benefits for Businesses and Individuals
Here’s a more detailed elaboration on what period comparison in Brand24 is all about:
Timeframe Flexibility: Period comparison allows you to select specific timeframes you want to analyze. This flexibility is particularly valuable because it enables users to compare data for days, weeks, months, or even years, depending on their specific needs. This means you can track changes and trends over short-term or long-term periods.
Tracking Fluctuations: One of the key aspects of period comparison is the ability to monitor changes in your brand’s online presence. By comparing different time periods, you can identify spikes or dips in reach, mentions, and sentiment, helping you understand which strategies or events had the most impact on the brand visibility.
Spotting Trends: Period comparison allows users to detect trends in their online performance. This is crucial for identifying what works and what doesn’t in your marketing efforts. For instance, you can determine if specific marketing campaigns, product launches, or events led to increased engagement or positive sentiment. This insight can help you replicate successful strategies and avoid repeating unsuccessful ones.
Identifying Optimal Timeframes: Knowing the best timeframes for posting content or engaging with your audience is essential for effective social media and marketing strategies. Period comparison in Brand24 can help you pinpoint when your brand or product tends to perform best, whether it’s during certain days of the week, seasons, or special occasions.
Competitor Analysis: Beyond your own brand, period comparison can also be used to monitor and compare the performance of your competitors. By tracking their mentions and engagement over time, you can gain insights into their strategies and see how you stack up in your industry or niche.
Informed Decision-Making: Ultimately, period comparison equips users with the data and insights needed to make informed decisions about their branding, marketing, and social media strategies. Whether you need to adjust your posting schedule, invest in specific marketing channels, or fine-tune your messaging, these insights provide a solid foundation for decision-making.
Check the new Period comparison and see how your brand performs over time!
How to start?
Comparing periods with Brand24 is a breeze, thanks to its user-friendly interface and powerful analytics capabilities.
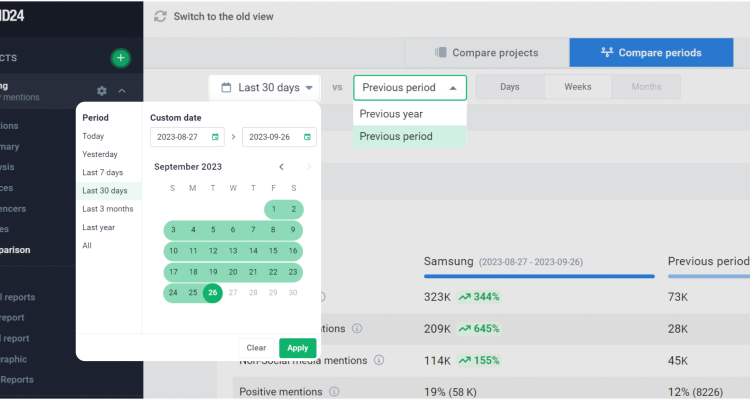
- To get started, simply access the Comparison tab within the platform.
- Then, select the timeframes or periods you wish to analyze – this could be daily, weekly, monthly, or custom time intervals.
- Once you’ve defined your comparison periods, Brand24 goes to work, providing you with a comprehensive overview of the data trends during these timeframes.
Key Features of Period Comparison
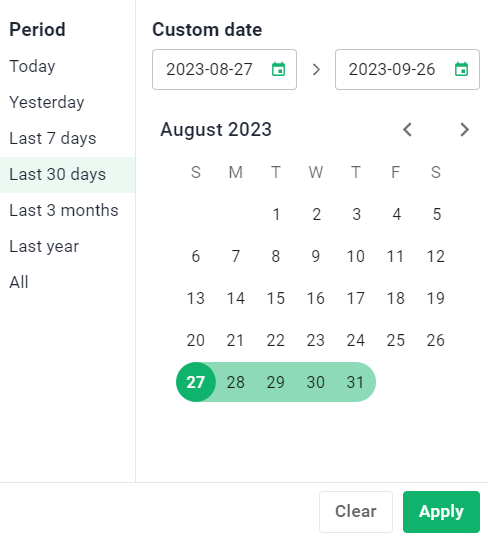
- Date Range Selection: You can pick specific time periods to study, like days, weeks, months, or years, depending on what you need. This lets you compare data from different times to see how things have changed.

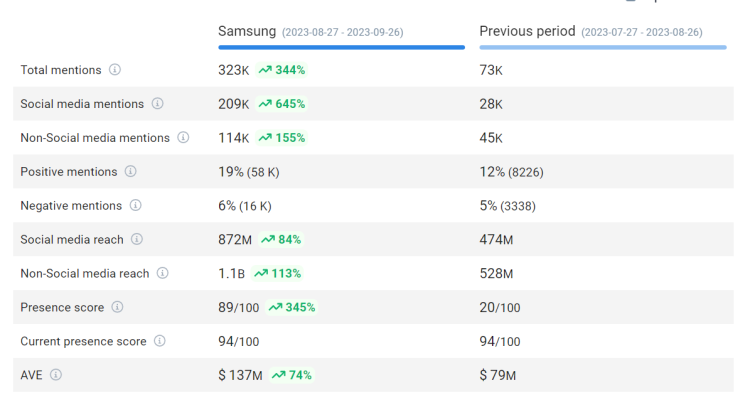
- Overview: It gives you a quick summary of how well your brand or keyword has been doing during the chosen times. You’ll see important numbers like mentions, reach, and sentiment trends. It’s like a quick look to see if things are getting better or worse.
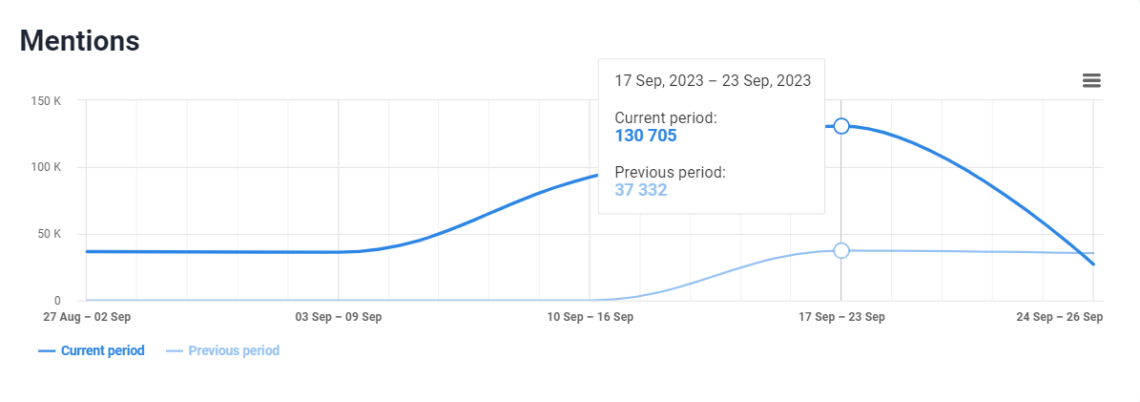
- Mentions: This tells you how many times your brand or keyword was mentioned in the chosen time periods. You’ll also see where these mentions are coming from and on which platforms. This helps you know how much people are talking about you online and where it’s happening.
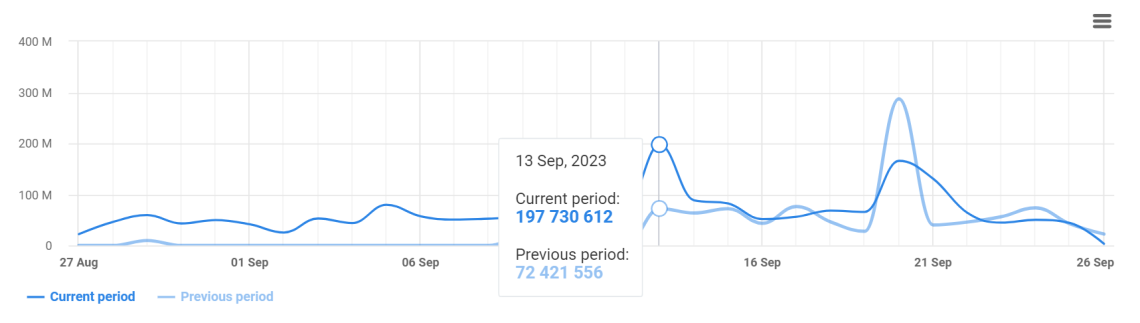
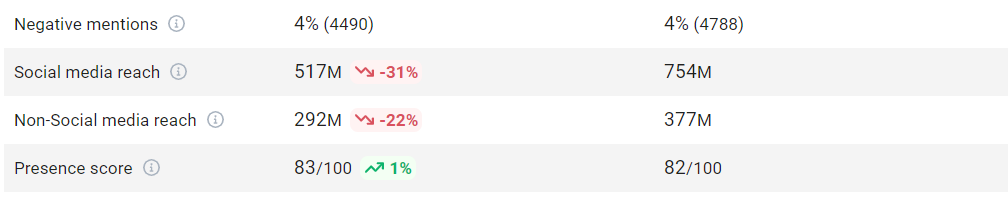
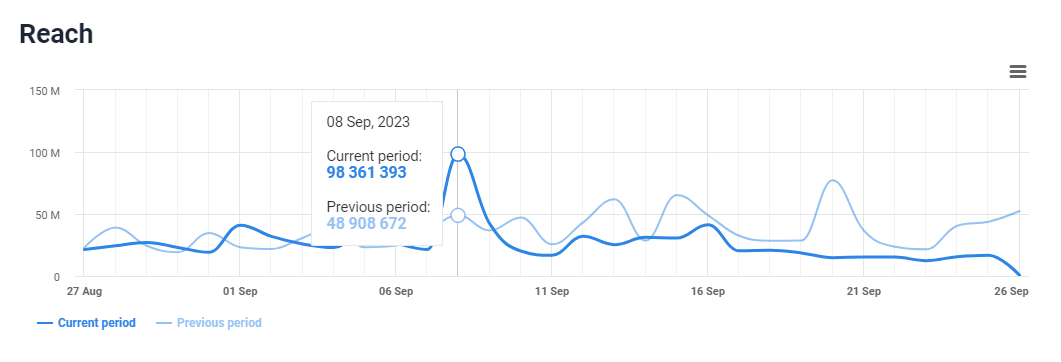
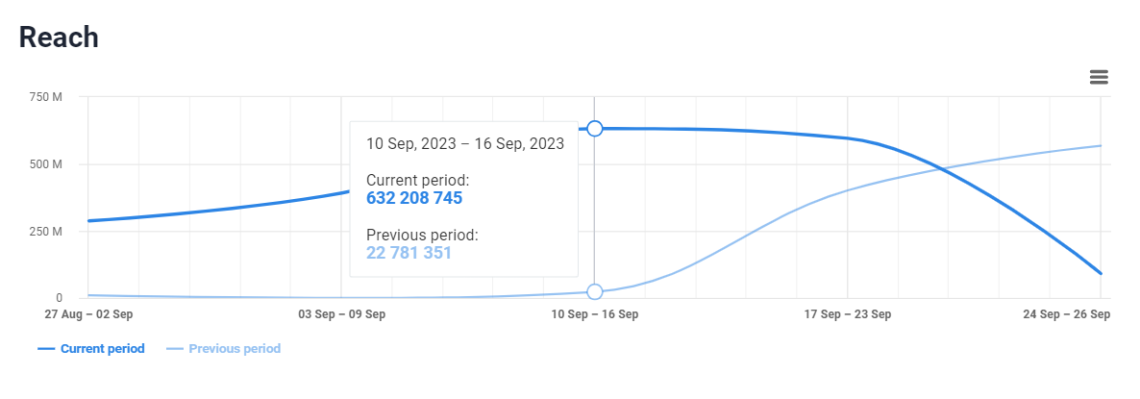
- Reach: Reach metrics show you how many people might have seen your brand or keyword mentions during the selected times. It includes numbers like how many people were reached and how many times your stuff was seen. It helps you figure out how much impact your brand has online and if your efforts to reach people are working.
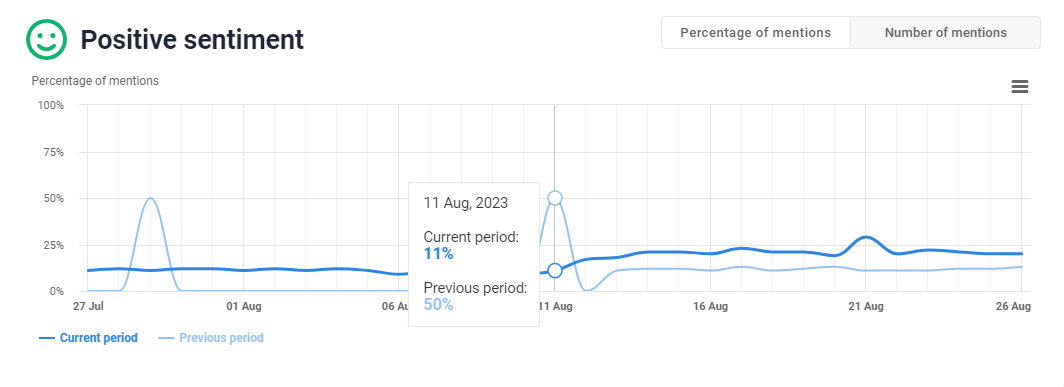
- Sentiment: Sentiment analysis checks if mentions are positive, negative, or neutral. It also shows how this sentiment changes over time. This helps you understand how people feel about your brand or keyword. Tracking sentiment helps you see if people’s opinions are changing and, if so, what you can do about it.
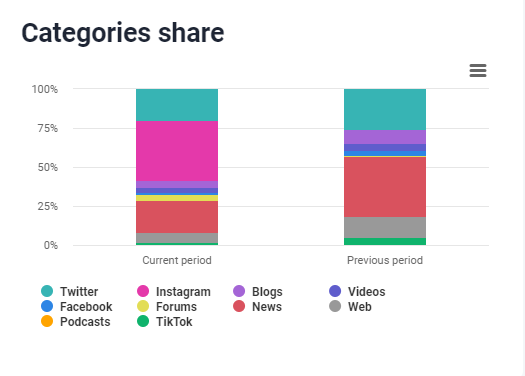
- Categories share: This shows which topics or categories are getting the most mentions related to your brand or keyword. It helps you know what people are talking about the most. This information can guide your content, product, and marketing strategies based on what’s most important to your audience.
More on the topic: Refreshed & Boosted – New Comparison Tab
Why do you need it?
Do you wonder where period comparison may help? Wonder no more, here are some scenarios:
- Marketing Campaign Assessment: Period comparison can reveal which campaigns have the most significant impact on reach and sentiment, enabling marketers to allocate resources effectively.
- Product Launch Evaluation: It allows businesses to measure the before-and-after impact of product launches, helping them fine-tune their launch strategies.
- Competitor Analysis: Period comparison helps businesses understand how their competitors’ online presence and sentiment change over time, identifying opportunities or threats.
- Social Media Strategy Optimization: It assists in determining the most engaging timeframes for posting content, maximizing audience reach and interaction.
- Reputation Management: By tracking sentiment trends, period comparison helps detect and address reputation issues before they escalate.
- Content Strategy Improvement: It provides insights into which content types or topics perform best, guiding content creators in producing more engaging material.
- Event Analysis: Period comparison helps assess the success of events by tracking mentions and sentiment during and after the event, facilitating future event planning.
- Public Relations Monitoring: It allows PR professionals to measure the impact of media outreach efforts and adapt their strategies for better results.
- E-commerce Sales Tracking: Period comparison helps track sales trends during different timeframes, aiding in inventory management and marketing planning to boost e-commerce revenue.
In all these scenarios, period comparison in Brand24 provides valuable data and insights that enable individuals and businesses to make informed decisions, refine their strategies, and adapt to changing online dynamics. Try it yourself!
Check the new Period comparison and see how your brand performs over time!