Table of contents
Top 9 Business Intelligence Tools to Use in 2026
If you take your business seriously, a business intelligence platform isn’t optional — it’s how you make smarter decisions faster. Let’s check the best ones!
Top Business Intelligence Tools:
| Tool | Coverage | Key Features |
|---|---|---|
| Brand24 | Social + web mentions | Real-time alerts, sentiment, share of voice, AI insights, dashboards, reports |
| Power BI | Business data (Excel/SQL + many sources) | Strong dashboards, lots of connectors, advanced modeling, Microsoft-friendly |
| Tableau | Data from many sources | Great visualizations, interactive dashboards, easy sharing |
| Metabase | Databases/warehouses | Simple self-serve queries, quick dashboards, open-source option |
| Looker Studio | Google data + connectors | Easy reports, templates, sharing, collaboration |
| Qlik Sense | Databases + cloud apps | Fast analysis, interactive dashboards, automated insights |
| Sisense | Cloud/on-prem + embedded analytics | Fast processing, embeddable dashboards, ML insights |
| Domo | All-in-one BI platform | Connectors, dashboards, automation, governance, app tools |
| RIB BI+ | Self-serve BI | Drag-and-drop dashboards, real-time tracking, alerts, templates |
I made the list below to take a closer look at the tools mentioned in the table above.
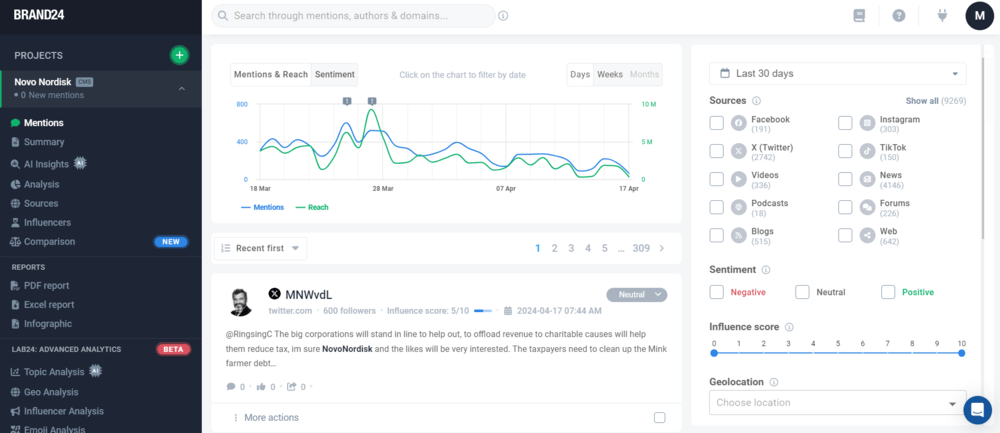
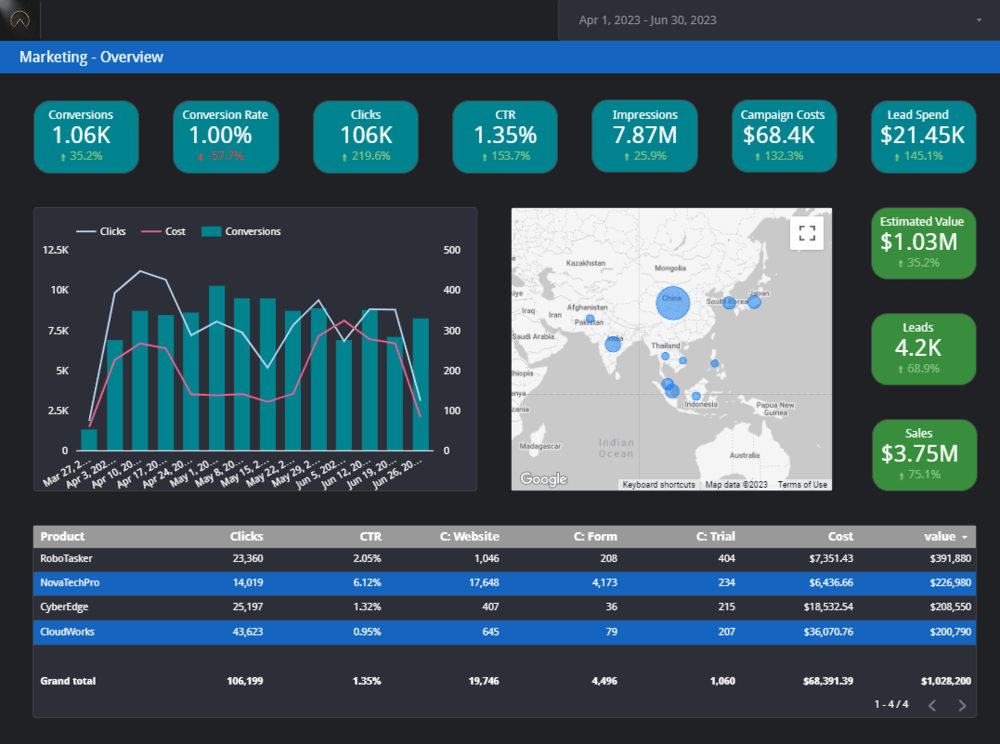
01 Brand24
Brand24 is one of the best tools for real-time intelligence analysis, combining AI-powered media monitoring with BI features built for marketing.
It tracks online mentions in real time across social media and the web, then turns them into actionable dashboards, metrics, and reports.
With Brand24, you can measure your visibility and reputation using key indicators like mention volume, reach, sentiment, and share of voice.
Advanced filtering helps you focus on what matters— quickly isolating negative mentions to prevent a potential PR issue.
Key fact: The tool includes AI features, such as Anomaly Detector and AI Insights, so you don’t have to manually dig through data.
Results can be shared via email reports and exports (PDF/Excel), making it easy to keep stakeholders updated.
Key features:
- Alerts, filters, and reporting (email/PDF/Excel)
- Real-time mention tracking across social + web
- Sentiment Analysis + Share of Voice
- AI Insights + anomaly detection
- Interactive dashboards and visualizations
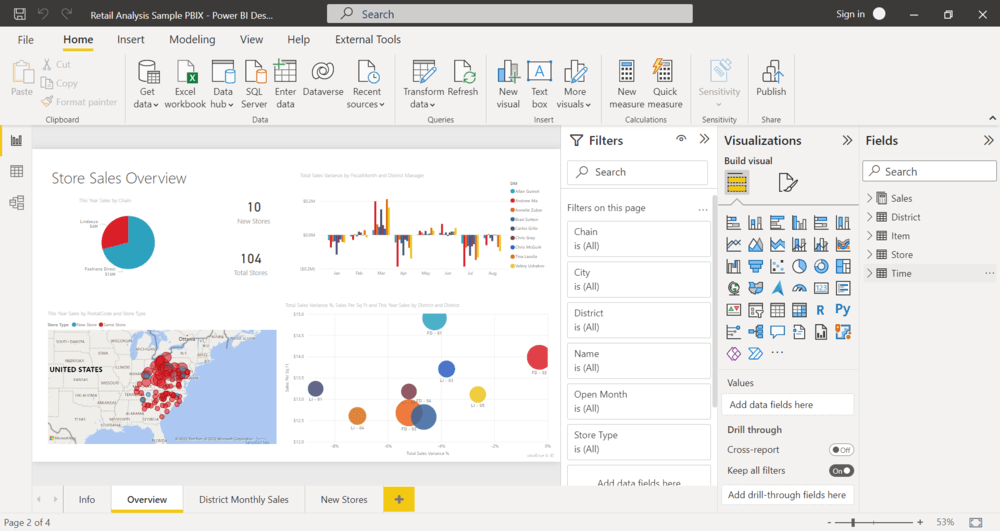
02 Power BI
Power BI is one of the most well-known business intelligence and data visualization tools. Microsoft developed it.
Thanks to this tool, you can track key business metrics – not just marketing ones but also others like sales, customer behavior, and financial.
Power BI uses the DAX (Data Analysis Expressions) formula language to perform total data and calculations. It’s not an easy ride, but it’s crazy powerful!
Power BI is Microsoft’s baby, so integration with other Microsoft products is excellent. For example, you can import data from Excel or export data visualization to PowerPoint.
In my opinion it is worth using if you are used to Microsoft tools!
The most significant limitation of Microsoft Power BI is its complexity. Of course, if you know data analysis concepts and have experience with similar tools, it will be easier for you to learn Power BI.
But don’t kid yourself!
Do you want to use Microsoft Power BI in your company? You definitely need to get a real expert to create a dataset.
Key features:
- DAX
- Numerous possibilities for data visualization
- Drag-and-drop interface
- Data connectors and integrations for a wide range of data sources (i.e., MS Excel, MS SQL, BigQuery)
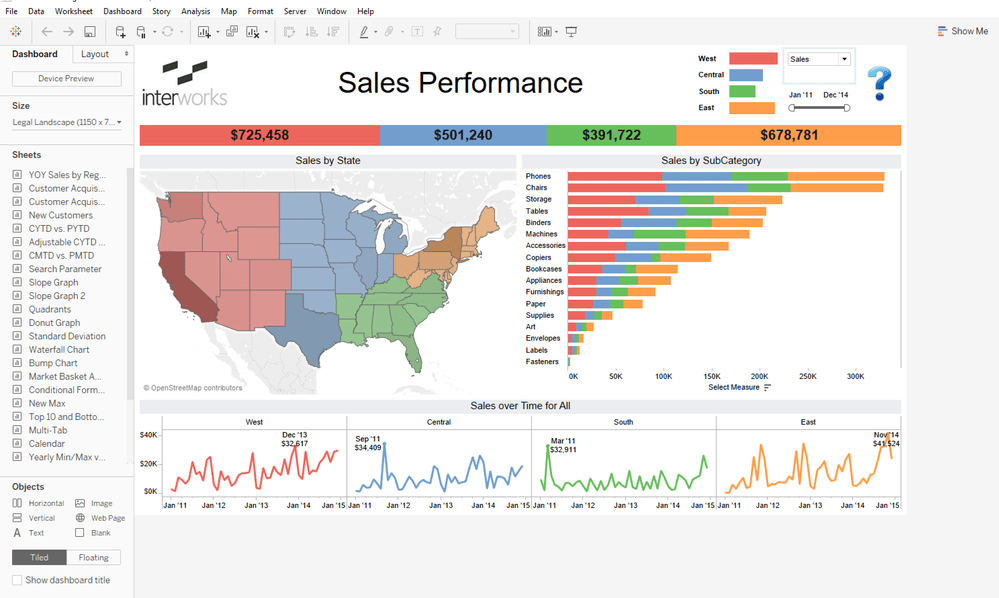
03 Tableau
Tableau is one of the leading business intelligence tools for data visualization.
It will help you to illustrate data in a meaningful way. You can create clear data visualizations like charts, graphs, maps, and scatter plots.
Tableau supports many data sources, such as:
- Microsoft Excel
- Microsoft SQL Server
- Google Analytics
- Salesforce
It provides unlimited possibilities for data analysis. You can easily combine data from different sources.
If you ask me, it’s a perfect solution for midsize and large organizations.
This tool has very good reviews among its users, but of course, it has drawbacks.
Tableau is considered easy to use and the perfect solution for business users. But only when the dataset is created (SQL knowledge is needed to do it)
Key features:
- Ad-hoc analysis
- Connection to any source
- Strong visualization possibilities
- Interactive and intuitive interface
- Easy dashboard sharing
- Mobile access
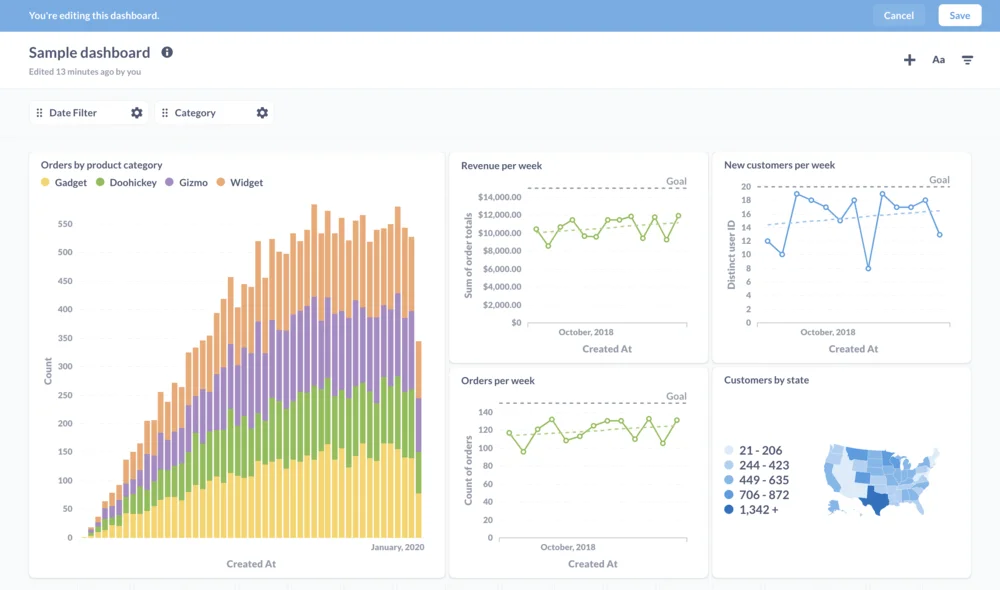
04 Metabase
Metabase is an open-source and self-service BI software.
It’s a free tool. So, if your budget doesn’t include implementing business intelligence software, check out Metabase.
The most remarkable thing about this tool is that it lets you ask questions or queries about your data without writing code or knowing SQL!
Who is this tool for? Metabase is for small and medium organizations and users without zero technical expertise.
For me, the biggest disadvantage is the lack of features in the open-source version. But you can always buy the paid version, which can cost you even $500 monthly.
Key features:
- Ad-hoc data exploration
- Visual query builder
- Analysis in data warehouses
- Shared dashboards
- Easy installation and customization
05 Looker Studio
Looker Studio is another free business intelligence tool. As with Metabase, a paid version with more features is available.
It’s a cloud-based platform developed by Google – formerly Google Data Studio (till October 2022). It integrates with Google products like Google Ads, Google Analytics, Google Search Console, and external data sources.
In Looker Studio, you can convert data into customizable informative reports and dashboards.
My favorite feature is sharing reports with particular people, by, for example, entering an email address. This makes it easy to share reports and work on the same report simultaneously.
Unfortunately, it can sometimes be laggy. Especially when working on large and complex datasets for a long time.
Key features:
- Powerful data modeling
- A wide variety of sources
- Integration with Google Analytics and other Google products
- Robust library of report templates
- Expansive connectors
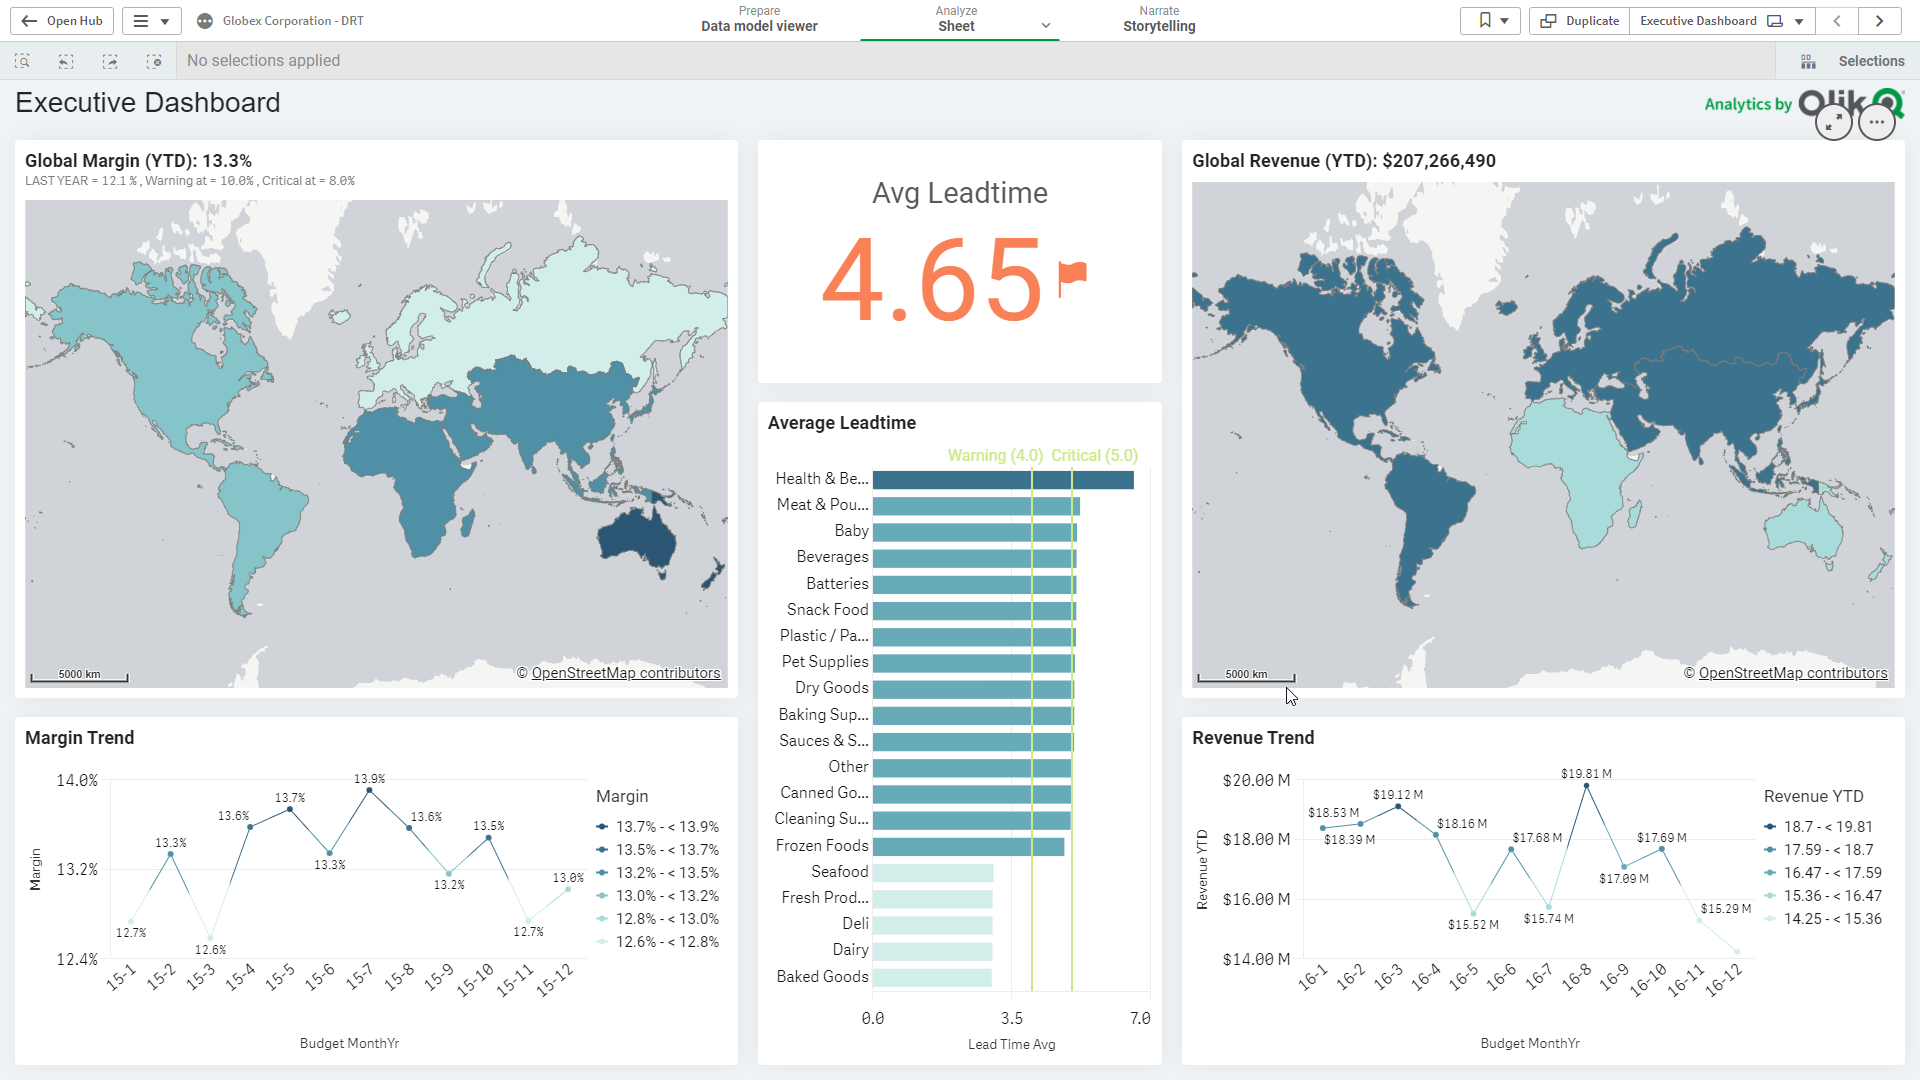
06 Qlik Sense
Qlik Sense is one of the best business intelligence tools for conducting dynamic business analytics. It was launched in 2014 by Qlik.
It is another great tool for real-time intelligence analysis.
It supports many sources across databases, cloud providers, data warehouses, and apps, such as:
- Azure
- Google Cloud
- Oracle
- SQL
What I love about the tool is that it collects data from social media!
The tool is very efficient in processing large amounts of data. It seamlessly integrates data from multiple sources.
I suspect this is a pretty expensive solution… Qlik Sense does not provide pricing on its website.
If you don’t have such high requirements for the software, go for something cheaper.
Key features:
- Active data analytics
- Interactive data visualization
- Automated insight generation
- AI-assisted creation and data preparation
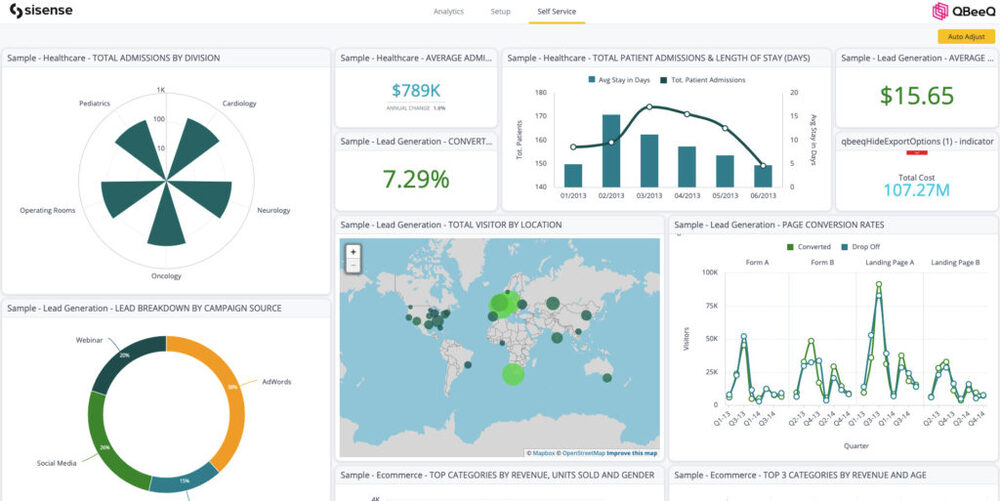
07 Sisense
Sisense is a business intelligence (BI) tool offering on-premises and cloud-based solutions.
This BI software has many features that allow the transformation of raw data into usable insights.
For example, thanks to advanced machine learning algorithms, Sisense predicts future trends and makes data-driven forecasts.
In comparison to competitors, Sisense processes data very fast!
That’s why I find it one of the best tools for real-time intelligence analysis. It is great for predictive/advanced analysis.
However, this software’s visualization capabilities are worse than those of BI tools like Power BI or Tableau. Sisense should not be your first choice if you care about this aspect!
Key features:
- Ad-hoc analysis
- Integration of data from multiple sources
- Fast data transformation
- Wide range of visualization, including graphs, charts, and interactive dashboards
- Embedded analytics
- Machine-learning integration
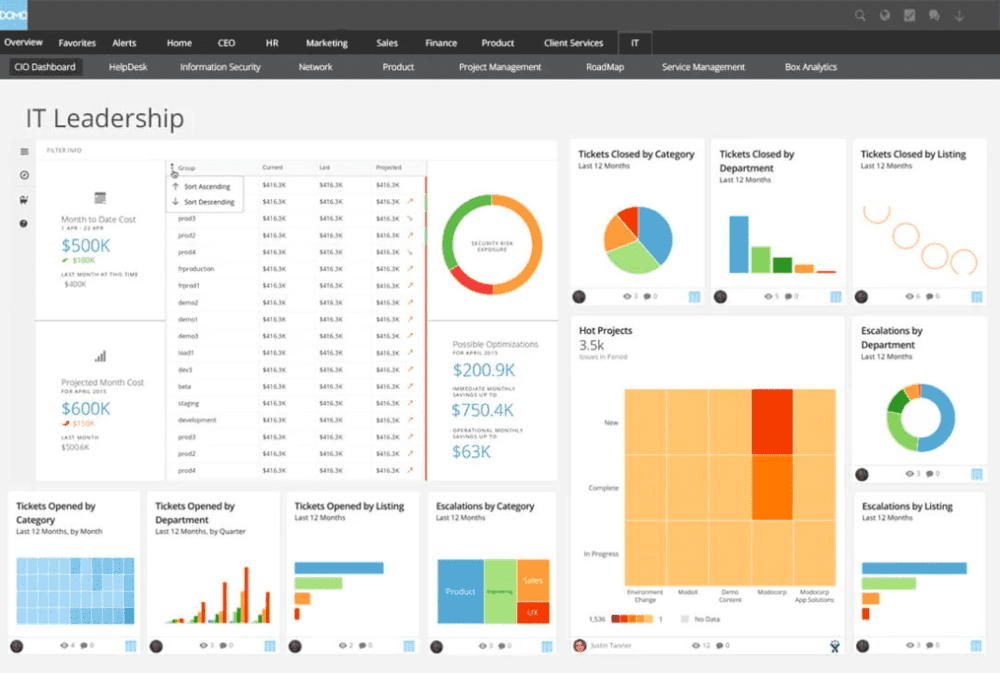
08 Domo
Domo is a comprehensive BI platform that combines data integration, visualization, app creation, security, and governance!
Thanks to this platform’s features and tools, it is possible to collect, analyze, visualize, and share data from different sources.
Domo is the best for data management; it’s extremely easy and flexible!
Trust me, managing Domo is a piece of cake once the data is connected to the platform.
Although it has an intuitive interface, it gives the impression of being quite old. It may bother some users… maybe you, too. A design update would be more than welcome!
Key features:
- Easy-to-use visualizations and dashboards
- Automated and simple reports
- AI/ML insights
- Cloud infrastructure
- App creation tools
- More than 1,000 connectors
- Built-in data governance
09 RIB BI+
RIB BI+ is an all-in-one BI platform created to be easily accessible to non-technical users.
It’s a self-service BI. Everyone, regardless of data science knowledge, can:
- Integrate data sources
- Analyze data
- Create data visualizations
- Generate business insights
Moreover, RIB BI+ offers AI-powered data alerts. They let you know when something noteworthy happens in your collected data.
The biggest drawback of this product is that updates haven’t been made over the years. When other BI tools constantly develop, launch new features, and focus on AI technology, RIB BI+ does not move forward.
Key features:
- Real-time business data monitoring
- Fast and easy data connectors
- Drag and drop interface
- Effective reporting
- Flexible and highly customizable dashboards
- Over 50 dashboard templates
- Data alerts
What if a tool is not enough?
Business intelligence tools help you collect and analyse data. But turning data into strategic decisions takes time, expertise, and focus. Resources many teams simply don’t have.
That’s where Insights24 comes in.
Insights24 analyzes the data for you and helps you turn it into strategic decisions, leveraging human expertise and custom reports.
Instead of giving you another dashboard, they deliver:
- Strategic reports based on billions of online conversations
- Custom research tailored to your exact business question
- Clear recommendations, not just charts
- Analyst-led validation of trends, risks, and opportunities
Who is it for?
- Leaders who want answers and recommendations.
- Teams that need context-driven advice alongside their BI software output.
Think of Insights24 as an extension of your BI stack. One that adds expert interpretation, narrative, and strategy on top of the data tools generate.
Conclusion
As this article shows, the market offers a range of business intelligence tools. Base your choice mostly on your needs, goals, and (of course) budget!
Key fact: The wrong business intelligence software can make your work way more difficult instead of making it easier.
I prepared a simple step-by-step guide to help you decide which tool to choose:
| Next step | What to do | Output |
|---|---|---|
| Pick a tool | Choose 1–2 tools from the list based on your goal (marketing intel vs. business data) | Shortlist (1–2 tools) |
| Set a goal | Write 2–3 questions you want the tool to answer | Clear use cases |
| Track key metrics | Select 5–10 KPIs you’ll check weekly | KPI list |
| Set alerts | Turn on alerts for spikes and negative signals | Real-time notifications |
| Build one dashboard | Create a simple dashboard with your top KPIs | 1 dashboard |
| Share results | Export or schedule a report for your team | 1 shared report |
| Decide after 7 days | Keep / upgrade / test another tool | Decision + next action |
Final thoughts:
- Using BI tools in 2024 is a MUST – they translate collected data into actionable insights, significantly improving different business operations.
- BI tools can be used in various industries and company departments.
- Feel free to check different tools! Many of them offer a free trial; take advantage of this opportunity.
Click here to try Brand24 for free – the best business intelligence software to improve your marketing game!
FAQ
What are business intelligence tools?
Business intelligence (BI) tools are software that collect, process, analyze, visualize, and report current and historical data! Shortly speaking, they transform a lot of raw data into east-to-understand dashboards, graphs, charts, maps, and reports so you can discover valuable insights. Thanks to BI, you can identify new markets for campaigns, learn how to develop your product, adjust your strategies, see the effectiveness of your activities, and much more!
What are the key features of great business intelligence software?
The key features of the best business intelligence tools are:
- Data integration capabilities: Every decent BI tool should be able to integrate data from different sources (databases, spreadsheets, cloud services, etc.).
Integrating all the data provides a comprehensive view of your business, the best possible analysis, and, consequently, insights. Missing out some data may involve making a wrong business decision. - Real-time analytics: To get the most out of data, you need to collect them in real-time and analyze them ASAP! Therefore, there is no option for the BI tool to collect and analyze data in a different way – only real-time matters.
- Historical analytics: Business intelligence would not exist without historical data. Data-driven decision-making needs not only current data but also past data. This is a guarantee of success!
- Different AI-powered features: Advanced BI tools must have AI-powered features. They help identify patterns, market trends, and anomalies you might not have noticed.
Moreover, artificial intelligence provides predictive capabilities. The more AI features, the better for you! - Data visualization: A wide range of data visualizations is essential. You should have different graphic format options, including graphs, charts, plots, and maps.
They should be aesthetically pleasing and easy to read. The visualization readability affects the data’s understanding by you and others – unclear or too complicated can lead to misinterpretations. - Interactive dashboards: Interactive dashboards have become very popular, and no wonder why. They allow users to dig into data!
They provide real-time data updates, which gives them an advantage over PDF reports. This benefits dynamic business environments where data is produced like in a factory. - Customization: The tool should have customized reports and dashboards. Customization allows you to tailor the BI tool so you can focus on crucial metrics for your company or key metrics during a given period.
- Scalability: The tool you choose should grow with your business. Your company grows, so do your needs.
The tool must be scalable so that you can expand your capabilities at any time without changing the tool.
How to choose a business intelligence tool?
Choosing the right business intelligence tool is the key to success!
So here is the step-by-step guide on how to choose a BI tool that aligns with your business:
- 1 Define your needs and goals: Do it by answering the most important questions "What kind of data do I want to analyze in the tool?", "Who will use the tool?", "What kind of analysis do I want to get?" and "What do I want to achieve using this tool?".
- 2 Check the features: After answering the questions, you already know what you expect from the tool. Now, check if the given tool has the required features and can provide you with the analysis you need.
- 3 Consider the budget: Some BI tools can cost a lot. Be realistic! Don't cheat yourself, and choose a tool for your pocket. Remember that the most expensive solution is not always necessarily the best.
- 4 Think about the users: Deeply analyze who will be using it and their level of technical expertise. Some tools can be complex and complicated (to use some BI tools, firstly, you need to set up a database), and some are easy to use (like Brand24 – setting up a database is not required). The significant advantage of user-friendly software is that business users with no data science knowledge can use it without a problem. Consider whether implementing such an advanced tool and training existing employees or expanding the team with an expert is worth doing. Sometimes, the game is not worth a candle, so go for a simpler solution!
- 5 Check the reviews and case studies: Reviews on marketplaces like G2 or Capterra are worth checking. You can rely on the reviews of people working in a similar position. What worked for them may also work for you. Also, find case studies of a company from your industry or similar use cases. Usually, they are presented on the tool's website.
- 6 Compare the tools: You can compare the overall rating, price, and features of the tools you want to try. You can easily do it using G2 or Capterra. This will give you an idea of which option is the perfect match for you and which may be a good alternative.
- 7 Try the tool: Always (if possible) try the tool before buying it. If it does not meet your expectations, you can try another one.
Following the above seven steps will reduce the risk of the BI tool being unsuitable for your company!
How to use business intelligence tools?
Start simple: connect your data sources (spreadsheets, databases, marketing platforms, etc.), choose the KPIs you care about, and build a basic dashboard.
Then set up filters and (if available) alerts, so you can spot changes fast.
Finally, schedule or export reports to share insights with your team. The best approach is to test one use case first (e.g., weekly marketing performance) and expand from there.
What are business intelligence tools used for?
BI tools turn raw data into clear insights you can act on.
Companies use them to track performance, spot trends, compare results over time, understand what’s working (and what isn’t), and make faster decisions across marketing, sales, product, finance, and operations.
How do companies choose business intelligence tools?
Usually, it’s a mix of practicality and fit:
- Goals first: what questions should the tool answer?
- Data sources: can it connect to what you already use?
- Ease of use: will business users actually adopt it?
- Budget + scalability: can it grow with you without exploding costs?
- Proof: reviews, case studies, and a trial run with your real data.
What are the best tools for real-time intelligence analysis?
Based on the tools listed in the article, the strongest options for real-time intelligence analysis are:
- Brand24 (real-time alerts, sentiment, share of voice, AI insights — best for online/media intelligence)
- Qlik Sense (fast analysis, interactive dashboards, automated insights)
- Sisense (fast processing + ML insights, useful for advanced analytics)
- Domo (real-time dashboards + automation + governance in one platform)
How is real-time intelligence used in social media monitoring?
Real-time intelligence helps you react while something is still happening.
In social media monitoring, it’s used to catch sudden spikes in mentions, track sentiment changes, identify top influencers or viral posts, and spot early signs of a PR issue.
Instead of “finding out later,” you can respond immediately, adjust messaging, or protect your brand reputation in the moment.
What is the difference between business intelligence and data analytics tools?
BI tools are typically built for ongoing reporting and decision-making: dashboards, KPIs, recurring reports, and visibility across teams.
Data analytics tools can go deeper into exploration and advanced analysis (often more technical), like statistical modeling or custom analysis workflows.
In practice, many platforms overlap — but BI usually focuses on “what’s happening and why,” while analytics tools often focus on “what else can we discover or predict.”
Are business intelligence tools suitable for non-technical users?
Yes — many are designed specifically for business users.
Tools with drag-and-drop dashboards, templates, and simple sharing (like Brand24 or Tableau once data is set up) can be very accessible.
The key catch: some platforms still require technical setup upfront (like building datasets or modeling).
If your team isn’t technical, choose a tool with an easy start and minimal setup.
What are the most common mistakes when implementing BI tools?
The biggest mistakes usually come from trying to do too much too fast (or skipping the basics). Here are the most common ones:
- No clear goal: Teams start building dashboards without deciding what questions they need answered. Result: pretty charts, zero decisions.
- Tracking too many metrics: If everything is a KPI, nothing is. It’s better to start with 5–10 key metrics and expand later.
- Messy or incomplete data: BI won’t magically fix bad data. If sources are inconsistent, outdated, or duplicated, insights will be unreliable.
- Overcomplicating setup: Some tools require advanced modeling or technical work upfront. If you don’t have the resources, adoption will stall.
- Ignoring the end users: A tool is useless if people don’t use it. Dashboards should be built for the team’s real workflow and skill level.
- No ownership: When nobody “owns” the dashboards and definitions, reports quickly become outdated or inconsistent.
- No real-time alerts (when they matter): If your business moves fast, relying only on static reports means you’ll react too late.
- Not sharing insights properly: If reports aren’t scheduled, exported, or shared in a consistent way, insights stay trapped inside the tool.

Article Reviewed by