Table of contents
How to Create a Marketing Report? Template & Example [2026]
Doing marketing without reports is like cooking a meal without a recipe or tasting it along the way. You’re throwing in ingredients but have no idea if the final dish will be delicious or a disaster. Here, a marketing report resembles inviting Gordon Ramsey to your kitchen. Brutally honest, it brings expert guidance, transforms raw data into actionable insights, and – ultimately – delivers a piece you can proudly serve.
In this article, I’ll show you how to create marketing reports that are fast, professional, and as impressive as a dish by a world-class chef!
Bon appétit!
Marketing report is a single document that presents marketing efforts over a specific period. It includes key metrics and insights to show what worked, what didn’t, and how these activities support overall business goals.
By turning plain numbers into clear, concise & visually attractive set of information, it helps decision-makers track progress, identify opportunities, address challenges, and optimize future strategies effectively.
What is a marketing report?
A marketing report is a document that shows how well your marketing efforts are doing over a certain time and how they support the overall business goals.
The report usually takes the form of a dashboard or slide deck, presenting your marketing metrics and key performance indicators (KPIs) in a clear and visually attractive way.
The goal is to help stakeholders (your marketing team, managers, C-levels, clients, etc.) understand what worked, what didn’t, and use these insights to improve future campaigns.
7 key marketing report types
Marketing is very diverse. And just as there are many types and fields of marketing, there are many different types of marketing reports you can create.
Therefore, let me briefly show you 7 most important and most frequently used marketing report types (with tools suggestions):
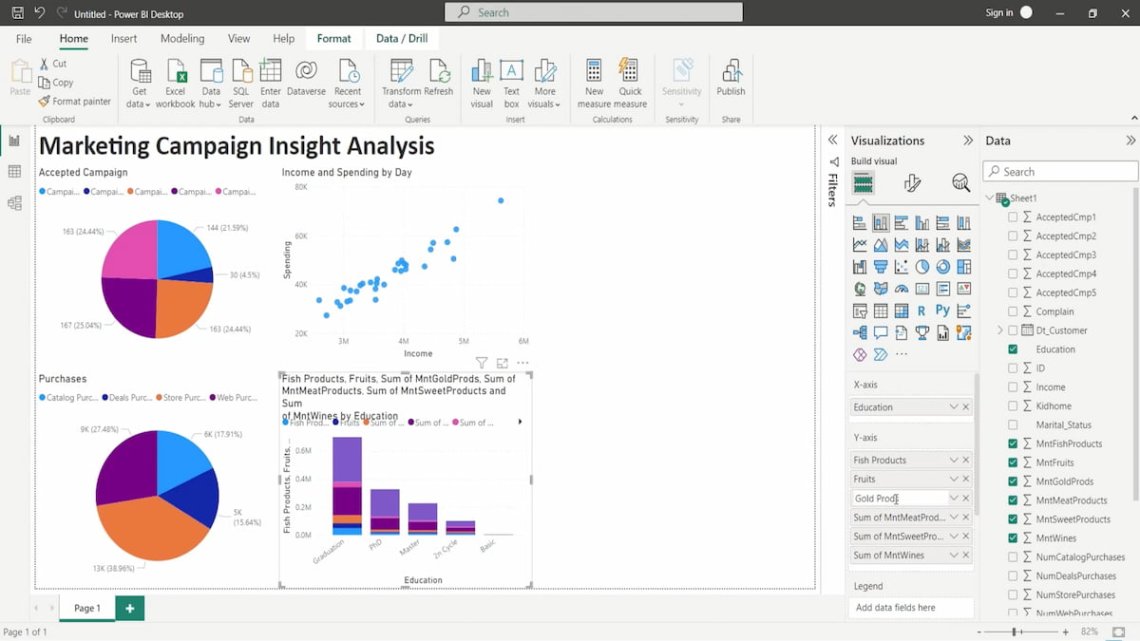
01 General digital marketing campaigns report
The king of all reports, the one to bring them all and in the darkness bind them. Oops, sorry, not this story!
Now, seriously, the general marketing report combines key metrics from various marketing channels to give an overall view of your marketing performance.
It creates a big picture and is warm-welcomed by every CMO and other C-level VIPs.
Top tool: PowerBI
02 Website traffic report
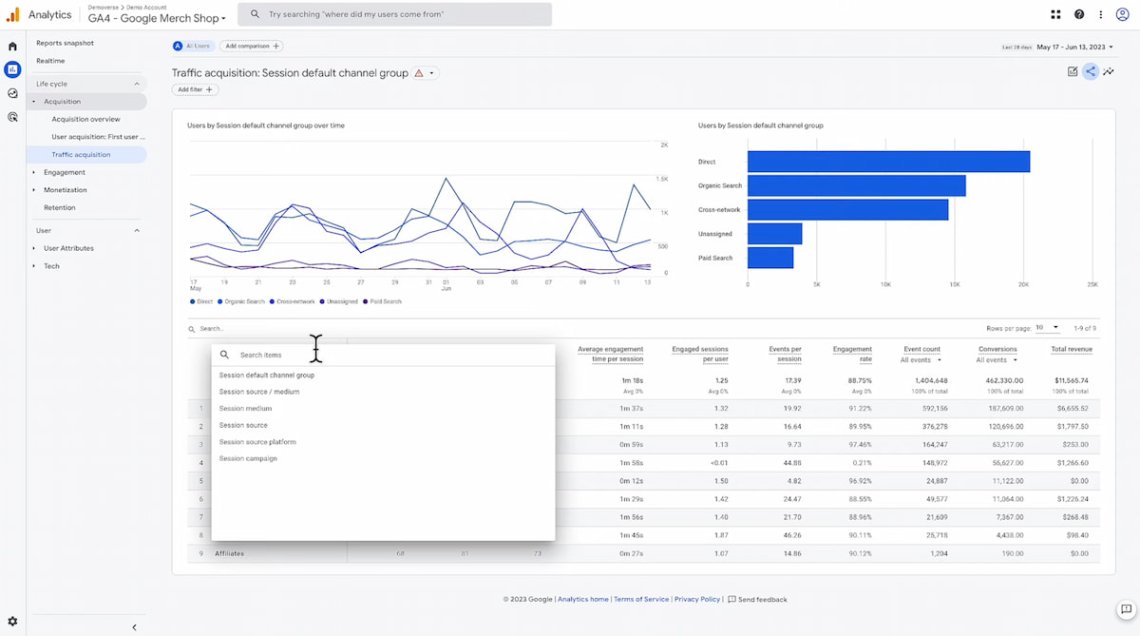
Your website is like your home address for your business.
Therefore, tracking website traffic is like monitoring how many people enter your house (website visits), where they come from, and how they behave when they’re in.
Great for understanding your audience and optimizing user experience.
Top tool: Google Analytics
03 Brand reputation marketing report
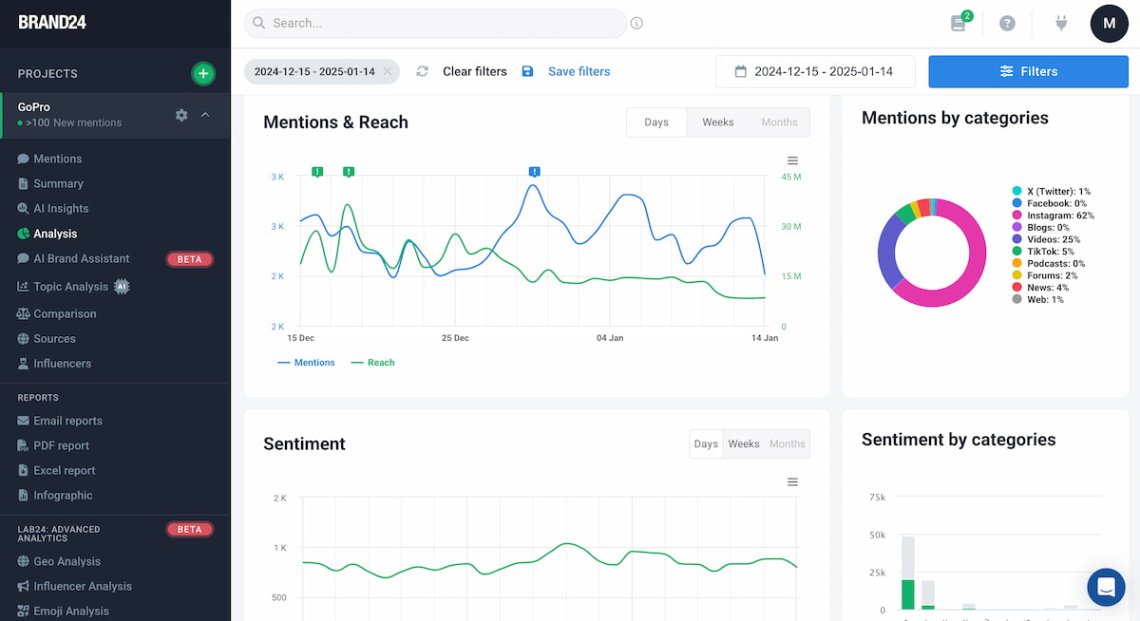
It tracks online mentions & customer reviews, and does the sentiment analysis of your brand.
The best for managing public perception and evaluating brand awareness & trust.
Top tool: Brand24
04 SEO marketing report
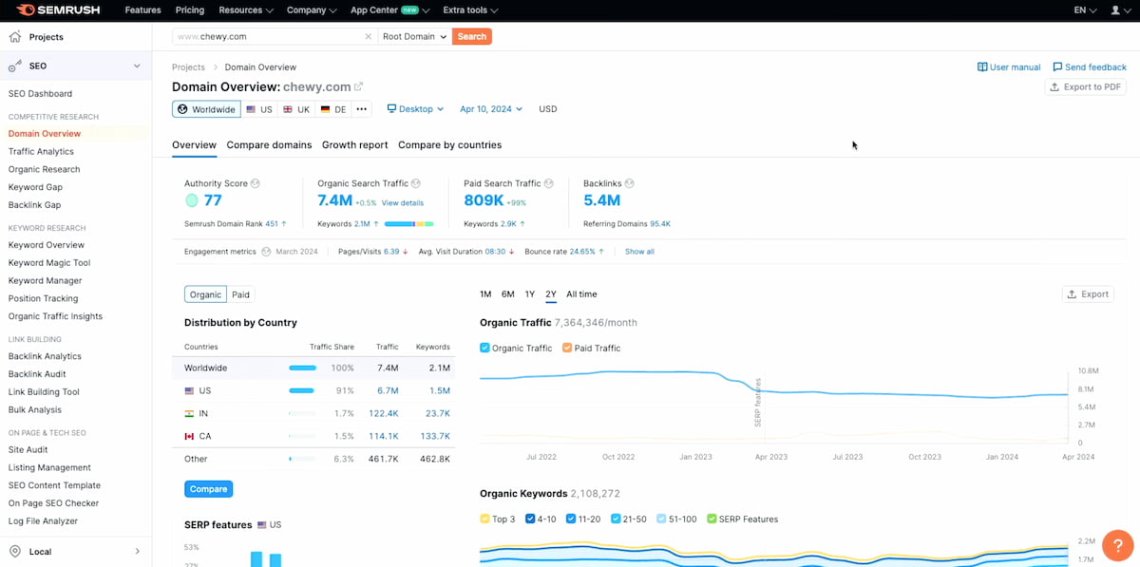
This report evaluates search engine optimization efforts like keyword rankings, organic traffic metrics, or backlink performance.
Perfect for knowing your website & brand visibility, as well as content marketing strategy.
Top tool: Semrush
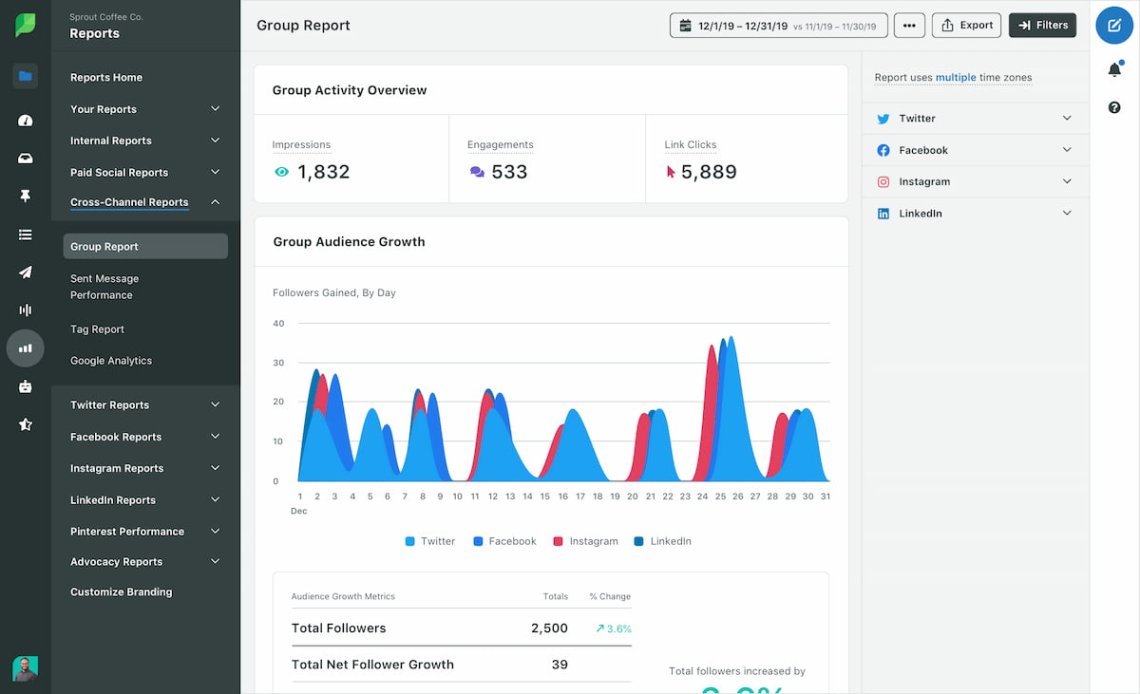
05 Social media marketing report
The social media report tracks performance data across social platforms like Facebook, Instagram, X (Twitter), etc. It includes metrics such as engagement rates, follower growth, content reach, and more.
Indispensable for understanding audience interactions and refining social media strategies.
Top tool: Sprout Social
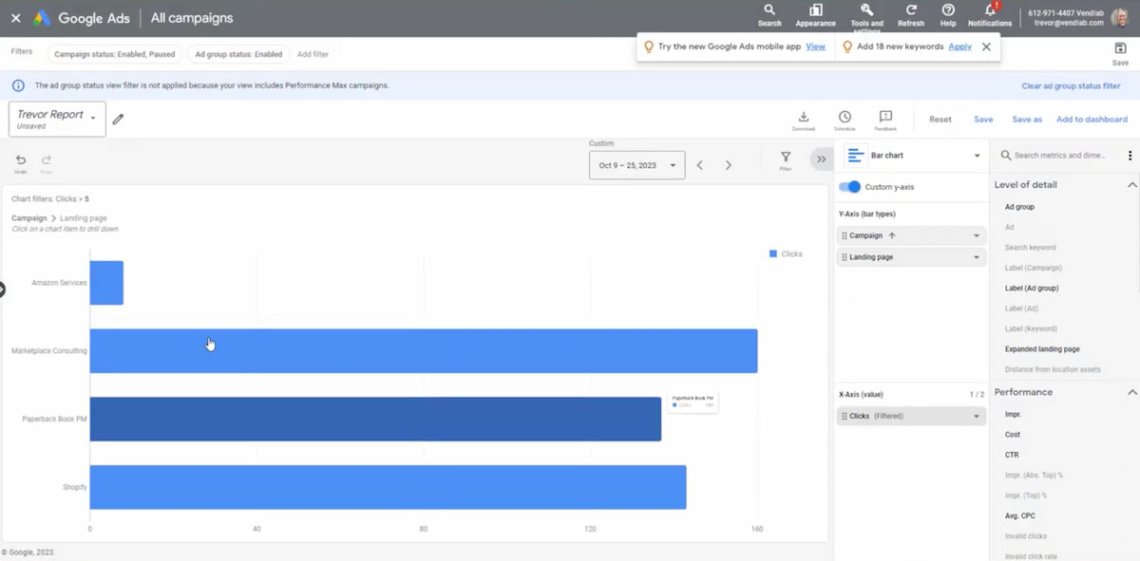
06 Advertising campaigns report
It presents metrics like impressions, clicks, and ROI for paid ad campaigns.
Key for evaluating ad effectiveness and managing budgets.
Top tool: Google Ads / Meta Ads Manager
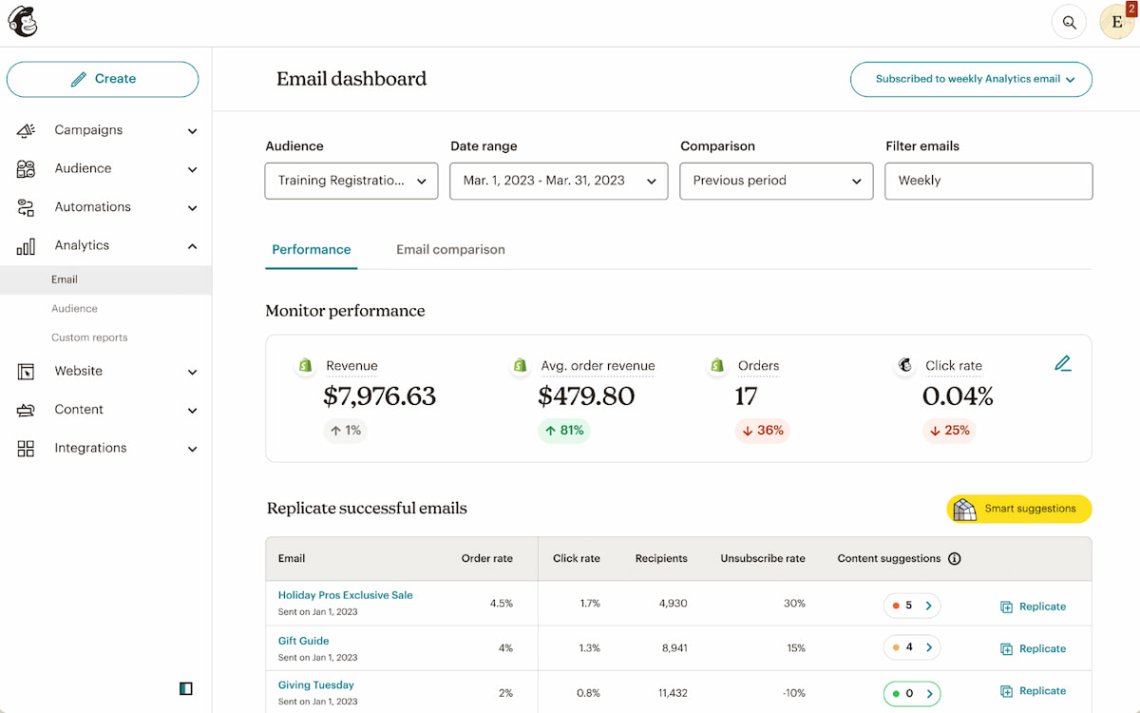
07 Email marketing report
Email marketing report includes open rates, click-through rates, and conversions from email campaigns.
It helps refine email strategies to improve engagement and results.
Top tool: Mailchimp
Why marketing report template is your best friend?
Regardless of what type of report you’re working on right now or what marketing data you’re going to present, the best tip I can give you to streamline your work is to use a marketing report template!
First and foremost, marketing report template provides a ready-made structure that saves you a loooot of time – especially if you’re obliged to present your marketing efforts regularly.
Secondly, such a well-designed report template helps to present your data clearly. That’s important because it makes it easier for stakeholders to understand marketing performance at a glance.
Most tools I presented before allow you to create templates.
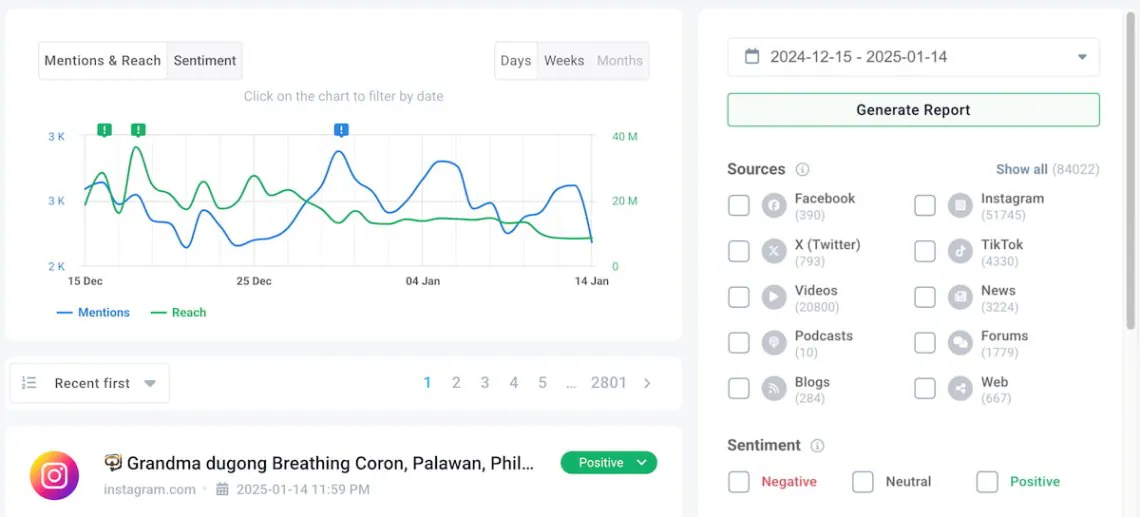
For example, Brand24 – the top media monitoring tool for measuring your brand mentions, sentiment, and reputation – works perfectly in terms of generating and sharing marketing reports.
All you need to do is:
- Define the scope of your data (like sources, type of sentiment, date range, etc.),
- Click “Generate report”, and
- Waiting for 10 seconds.
Yes, it’s THAT simple!
How to create a good marketing report? 6 steps
Okay, using a marketing report template is fine. But to make the most of this document and really impact your organization’s decision-making process, you should follow these six good practices.
01 Choose your goals
First and foremost, you must clarify the goals your marketing report should serve. They ensure that your marketing report is a purposeful and effective tool, not just a collection of data.
But how to choose them wisely?
Well, the best starting point is asking yourself and your stakeholders a few key questions:
- What decisions will this report influence? Are you trying to evaluate past performance, refine ongoing campaigns, or plan future strategies?
- Who is the target audience for this report? Tailor your goals and presentation style to whether the report is for your marketing team, clients, or C-level executives.
- What specific metrics matter to these goals? Align your report’s content with KPIs that directly reflect the goals, such as conversions, ROI, or engagement rates.
💡 Pro Tip: SMARTER goals
You probably have heard about the SMART framework. But there’s a new way of goals perception hidden behind the acronym SMARTER:
Specific – effective planning requires narrowing your goals
Measurable – your goals and progress must be possible to measure
Achievable – set goals that are possible to execute
Relevant – aligned with the overall business & marketing strategy
Time-based – have a clear timeline and deadlines
Evaluated – regularly assess your progress to keep your goals realistic
Reward – appreciate all the people involved in the success and reward them!
02 Decide on the time frames
An effective marketing report is not a one-time event. It should be created regularly to track progress and identify trends over time.
Don’t get me wrong, no one (maybe except your boss) will force you to produce comprehensive weekly marketing reports.
However, consistent reporting is crucial for monitoring performance and making informed decisions.
The frequency of your reports depends on your goals, audience, and the type of data you’re analyzing.
Here’s how to decide on time frames:
- Weekly marketing reports: Ideal for measuring short-term campaigns or agile marketing teams. These reports provide quick updates on progress and help identify any immediate issues.
- Monthly marketing reports: Perfect for monitoring broader trends and evaluating mid-term objectives. They provide a comprehensive overview without overwhelming stakeholders.
- Quarterly marketing reports: Best for presenting strategic insights, measuring long-term progress, and tracking quarterly marketing KPIs.
- Annual marketing report: Include a summary of the year’s performance, major achievements, challenges, marketing budget overview, and strategic insights. Highlight key metrics, ROI, and lessons learned to guide future strategies.
💡 Pro Tip: Automated reports
Advanced marketing tools like Brand24 can send you automatic reports.
AI Insights – one of the most helpful features in the Brand24 toolkit – sends regular emails summarizing your brand insights, sharing trends, and suggesting recommendations for the future.

03 Choose key metrics
Regardless of the type of marketing report you create, the goals you choose, or the time frames you select, an inevitable element you must include is a set of marketing metrics.
These indicators serve as the backbone of your marketing report, offering measurable insights into your performance.
Besides, I will share a small secret with you: all the managers and C-levels are crazy about numbers! So, if you want to grab their attention and prove the value of your work, focus on providing the right numbers.
Remember, though, that you should choose metrics that are not just impressive but also meaningful. Your primary focus should be to do your work well, not to please your boss. If it’s otherwise, better run away!
Okay, and what metrics should you choose for your report? Well, I could say the favorite sentence of all marketers, which is: it depends.
However, there are some universal metrics to include in most marketing reports:
- Cost per acquisition (CPA)
- The volume of mentions
- Cost per Lead (CPL)
- Social media reach and non-social reach
- Customer Lifetime Value (CLV)
- Click-through rate (CTR)
- Brand sentiment
- Market Qualified Leads (MQL) to Sales Qualified Leads (SQL) ratio
- Return on Investment (ROI)
- Engagement
If you need more ideas, I strongly encourage you to read this article about marketing metrics written by my experienced colleague.
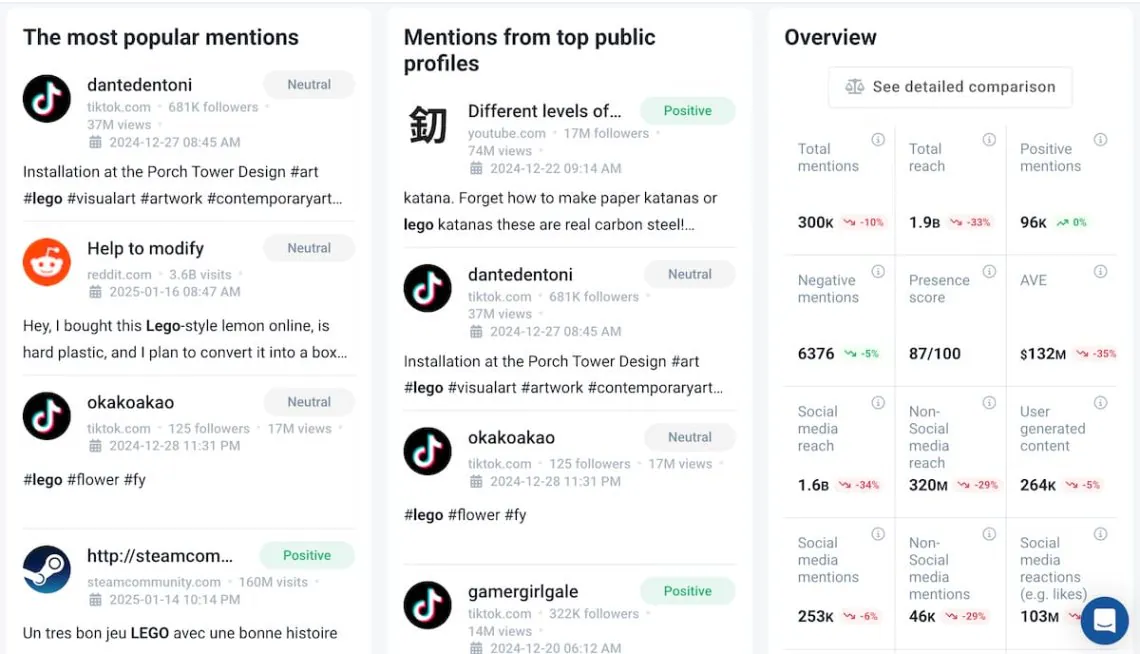
04 Remember about data visualizations
Okay, it’s time to say it loudly: your goals and metrics are essential, but if you want your digital marketing report to have a real impact, it must look great!
I mean, you don’t have to be hyper-detail-oriented and make your report look like a masterpiece of contemporary art. The clue is to create your report visually appealing and easy to read.
Why?
Because people are visual creatures. Visualizing data is definitely the simplest and most impactful way to present and explain your marketing data in an easy-to-understand way.
Remember that no matter how good your data is, a cluttered, text-heavy report can overwhelm and confuse your audience.
Fine, and what types of visuals can you use?
These are:
- Charts, graphs, and diagrams to show data trends and comparisons.
- Infographics to summarize key points visually.
- Images and screenshots to provide real-world examples.
- Tables to organize detailed data clearly.
- Heatmaps to show users’ behavior.
- Videos to present dynamic campaign previews.
- GIFs and Memes to make your report more engaging.
05 Add context to data
Numbers on their own can be impressive, but without context, they’re just numbers.
To make your marketing report meaningful and actionable, you need to explain why the data matters and what it means for your strategy.
Here is how you can do it in practice:
- Explain the “why” by highlighting the reasons behind significant changes or trends.
For example: “Our organic traffic increased by 10% this month due to the launch of our new blog series targeting high-volume keywords.
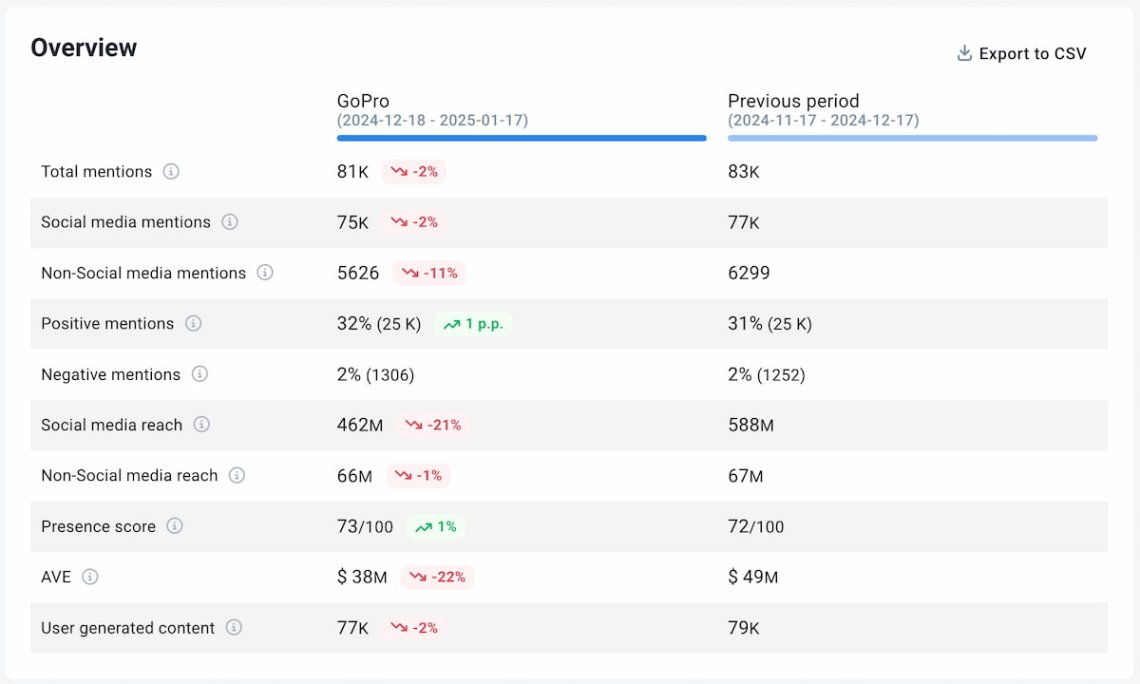
- Provide benchmarks by comparing your metrics to past performance or competitors to give stakeholders perspective.
For that purpose, you can use Brand24’s comparison features, such as Compare Periods and Compare Projects.
These two features present great benchmarks for your marketing activities in the form of tables and simple graphs.
Copy and paste them into your marketing report!
- Tell a story by translating the data into a narrative that explains what worked, what didn’t, and how future efforts can be optimized.
According to calculations made by Professor Jennifer Aeker (a behavioral scientist from Standford University), stories are remembered 22 times more than facts alone!
- Include actionable insights and recommendations by suggesting improvements or next steps based on the data.
Marketing reports are not only about translating mysterious numbers into understandable conclusions but also about finding opportunities for growth.
💡 Pro Tip: Use AI tools in your marketing analytics
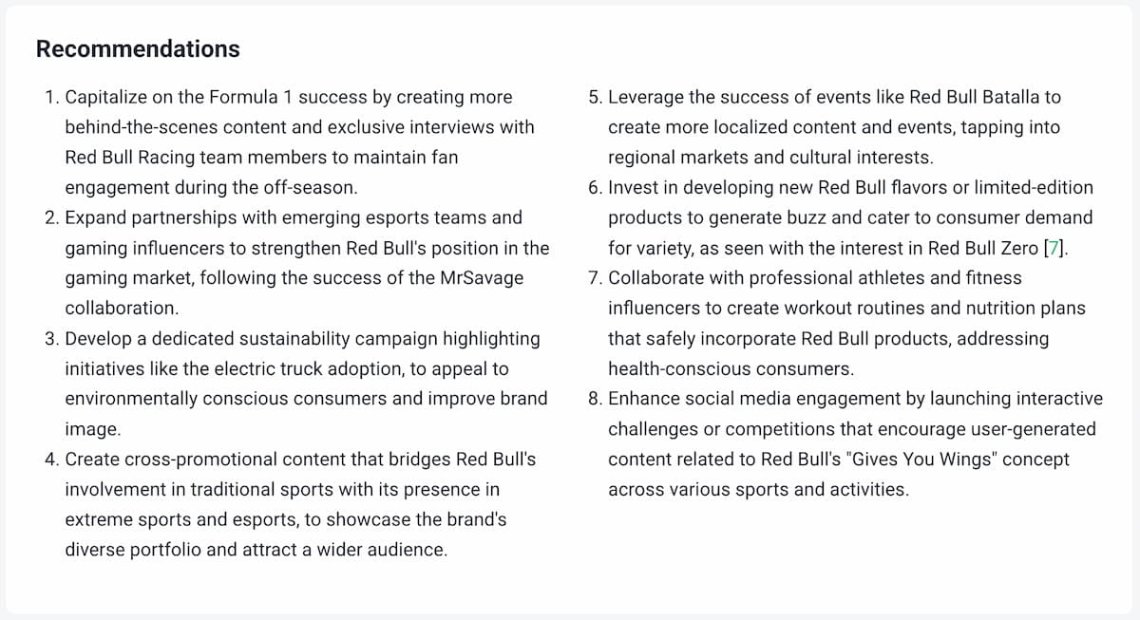
AI tools can be utterly helpful in discovering interesting insights and sharing recommendations.
For example, Brand24’s AI Insights provides you with personalized recommendations based on the internal data from your project.
06 Keep it simple and focused
Last but not least, double-check if your marketing report is straightforward and easy to digest.
Overloading it with unnecessary details or complex data can confuse your audience and weaken the impact of your insights.
Here’s how to keep your marketing report focused:
- Prioritize relevance: Include only the metrics, visuals, and insights that directly support your goals.
- Use clear language: Avoid jargon and keep explanations concise & easy to understand.
- Organize logically: Structure your report with clear sections (e.g., goals, performance, insights, recommendations).
- Summarize key points: Add an executive summary or highlight key takeaways at the beginning for quick reference.
- Review and refine: Ensure your report is error-free, visually appealing, and aligned with your objectives.
Conclusion
Creating a marketing report might seem like a complex task, but with clear goals, well-thought-out time frames, the right metrics, and effective visualizations, it becomes a powerful tool to drive success.
A well-structured report helps you understand what’s working, identify areas for improvement, and align your efforts with business goals.
Whether it’s a weekly update or an annual summary, consistency is key to tracking progress and optimizing strategies.
Tools like Brand24 can simplify the process, providing insights and automating reports to save time.
Remember to always add context to your data and keep your brand report focused and actionable.
Ultimately, a great marketing report isn’t just about presenting numbers – it’s about telling a story that inspires better decisions.
Now, it’s your turn to create a report that makes an impact!
Final thoughts:
- AI features like Brand24’s AI Insights can simplify the process. They help you discover trends, provide trends, and suggest personalized recommendations to save time and boost effectiveness.
- Use comparisons to add context and value to your report. For example, compare current campaign performance with previous ones or benchmark your data against industry rivals to discover progress and opportunities.
- Visual storytelling enhances report clarity and impact. Use elements like infographics, heatmaps, or screenshots to make complex data easier to understand and more engaging for stakeholders.
Start a Brand24 free 14-day trial and create your marketing report in just a few clicks!


