Table of contents
2M Marketers

Ever heard about BeReal? It quickly gathered tons of users who loved its fresh, authentic vibe. At its peak, BeReal had over 20 million people using it daily, and its downloads were through the roof.
But here’s the twist – despite its hot start, BeReal’s growth cooled off fast. By mid-2023, daily downloads had dropped by 78% from the previous year. This sharp drop is a warning: even the hottest apps can get lost without closely monitoring SaaS marketing metrics and adjusting strategies accordingly.
So, which metrics should you monitor? How? Let’s dig in!
Tracking SaaS marketing metrics is crucial for evaluating the performance and growth of your SaaS business. They provide a comprehensive view of your marketing efforts, help you make informed decisions for future strategies, and measure the achievement of business goals.
Key Saas marketing metrics to track:
01 Unique Visitors
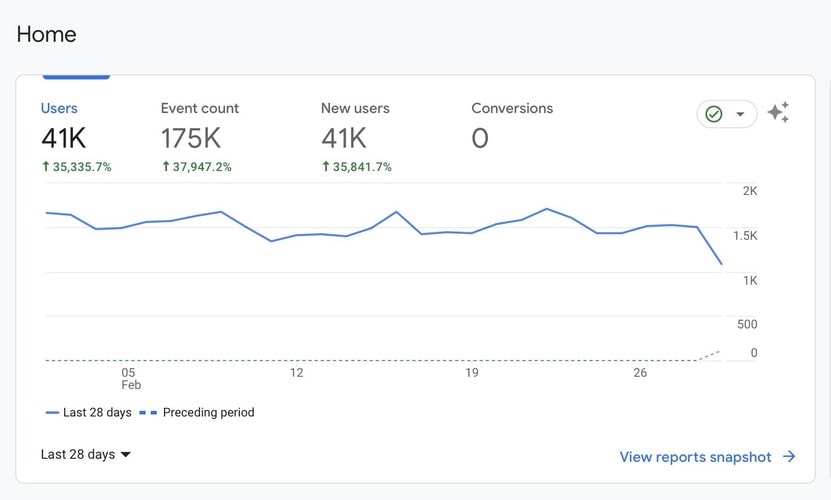
Unique Visitors metric measures the number of distinct individuals who visit a website within a specified period. How often they return doesn’t matter – they’ll only count once.
Why does this metric matter?
It keeps your data honest and your expectations grounded.
Suppose you have 10,000 website traffic and only 2k people generated it. In that case, you might overestimate the reach of your marketing efforts, mistakenly thinking they’re drawing a bigger crowd than they really are.
This metric is essential for understanding your website’s reach and effectiveness at attracting new audiences.
Plus, it is especially valuable for understanding the impact of specific marketing campaigns or changes to the site. So, if you want to test new strategies – I highly recommend tracking this metric.
However, remember that repeated visits from the same people are a good sign.
It suggests that these visitors are interested in your product and might be considering buying it if they haven’t already.
High traffic and a low number of unique visitors can mean that your product or service catches people’s attention and keeps them interested.
How to measure?
To measure Unique Visitors, you can use web analytics tools like Google Analytics, which automatically track and report this data based on user IP addresses and browser cookies.
02 The volume of mentions
The Volume of Mentions tracks how often your brand or product is mentioned across various platforms, including social media, blogs, and news sites.
Even if you plan a marketing campaign on a specific platform – it will likely go beyond that.
Being aware of the conversations around your brand and responding swiftly is crucial for improving relationships with your customers and potential clients.
Plus, more advanced media monitoring tools can also provide insights into public sentiment, reach, and emerging trends, which helps you understand your audience.
For SaaS companies, tracking online mentions can:
- Improve your brand awareness within your specific market.
- Shed light on customer sentiment and reveal what users think about your platform’s functionality (and overall value proposition).
- Deliver data on your brand performance, the impact of your marketing strategies, and how well they connect with your intended audience.
- Provide insights into your brand’s health.
- Identify loyal users and potential brand advocates who are key to driving growth and promoting your service through word-of-mouth and online endorsements.
How to measure?
You need advanced social listening tools like Brand24, Brandwatch, or Hootsuite. These can collect mentions from multiple sources and provide deeper analytics.
For example, Brand24 data sources include:
- Social media platforms such as Facebook, Instagram, LinkedIn, YouTube, Twitter, TikTok, Reddit, Quora, Telegram, and Twitch
- Review sites such as TripAdvisor, Yelp, Booking, App Store, Google Play, Trustpilot
- Blogs
- Video platforms
- Podcasts
- Discussion forums
- Newsletters
- Online news sources
- Other publicly available sources
This is what a mention looks like in the tool’s dashboard:
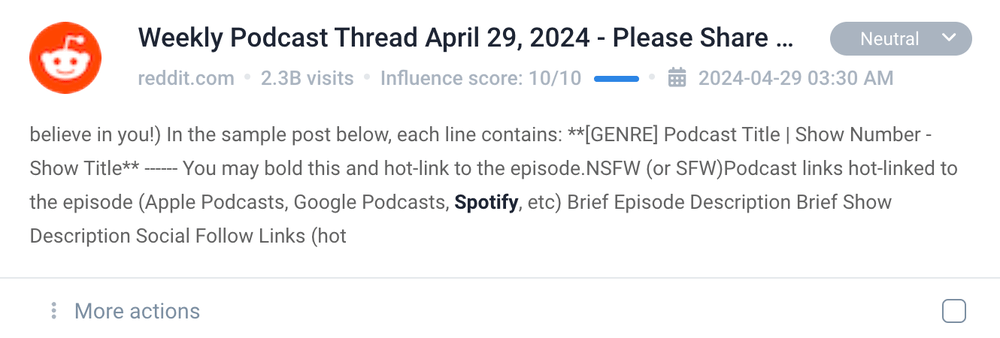
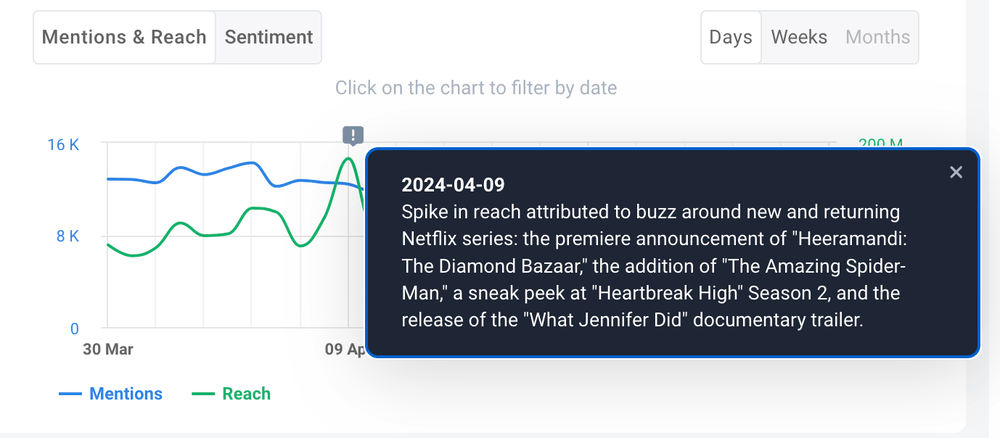
Plus, the tool can also detect anomalies in your mentions volume. This feature indicates spikes in popularity or any issues requiring attention.
Just like this AI tool did for Netflix.
Are you excited about the new Spider-Man movie, or maybe you’re more into the latest Bollywood hits?
No matter your preference, the hype around these releases is real, and with the Anomaly Detector, I was ahead of the curve!
03 Leads by Lifecycle Stage
Leads by Lifecycle Stage segments leads based on their progress through the sales funnel – from initial contact (new leads) to a closed sale (converted leads).
This metric monitors how leads move through your marketing and sales processes.
It can help you determine strategies to improve the number of leads that become actual customers.
Essentially, leads are split into two types:
- Marketing qualified leads (MQLs)
These are potential customers who are interested in what you’re offering but aren’t quite ready to buy yet. They’re perfect for targeted marketing that nudges them closer to a purchase. - Sales qualified leads (SQLs)
These leads have been checked out by both marketing and sales teams and are ready to move forward in the buying process.
How to measure?
Measure it by using your CRM to track leads automatically. It will sort them by their activities and how engaged they are.
This helps you see how well you’re turning MQLs into SQLs, manage costs per lead, and find better ways to get more sales-qualified leads.
04 Lead Velocity Rate (LVR)
Lead Velocity Rate (LVR) measures the growth in the number of new qualified leads from one period to the next.
It provides insights into the effectiveness of your marketing strategies and can predict future revenue growth.
LVR is the best way to understand the growth of marketing qualified leads (MQLs) and their progress toward becoming sales-qualified leads (SQLs).
How to measure?
Calculate LVR by:
- Subtracting the number of qualified leads at the start of a period from the number at the end
- Dividing by the number at the start
- Multiplying by 100 to express it as a percentage
LVR = (Number of qualified leads in the current month – Number of qualified leads last month) ÷ Number of qualified leads last month x 100
Let’s calculate it together!
Suppose this month your SaaS company generated 260 SQLs, compared to 200 SQLs last month. Here’s how to calculate the Lead Velocity Rate (LVR):
- 260 SQLs (this month) – 200 SQLs (last month) = 60 SQLs increase
- 60 / 200 = 0.30
- 0.30 x 100 = 30% Lead Velocity Rate
So, your sales qualified leads have increased by 30% month-over-month (MoM).
05 Social Media & Non-Social Reach
In SaaS marketing, keeping track of your brand’s online presence is crucial.
In general: the higher the social media reach, the better brand recognition and engagement.
But it’s also important to look beyond social media.
Non-social reach includes your visibility on blogs, forums, and news sites.
This gives you a fuller picture of how people see your brand across the internet, which is key for managing your reputation and tweaking your marketing strategies effectively.
How to measure?
The easiest way to monitor this metric is by using tools for social listening.
These tools can track where and how often your brand is mentioned across different channels. It’s a real game-changer for brand reputation management.
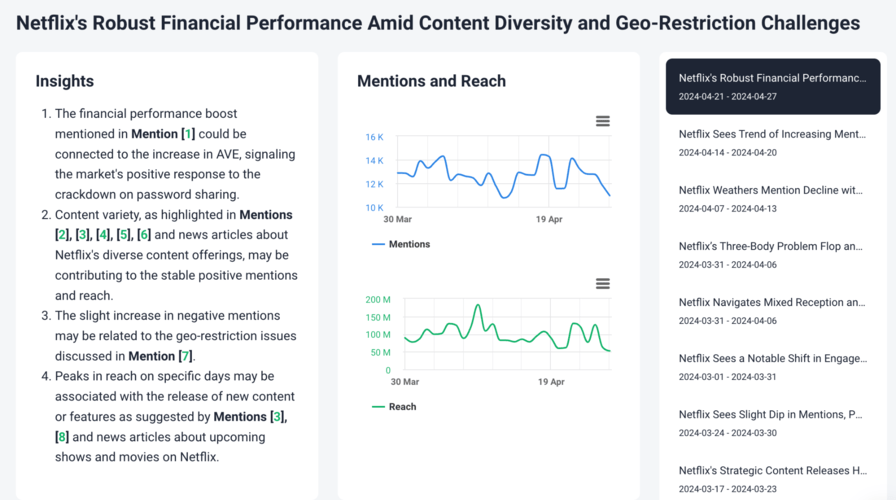
Brand24 also helps analyze the data. Advanced AI technology can summarize your project, find the most influential people, analyze the sentiment, and many more.
Here’s an example of the AI-based summary:
And a list of the most influential people related to a brand:
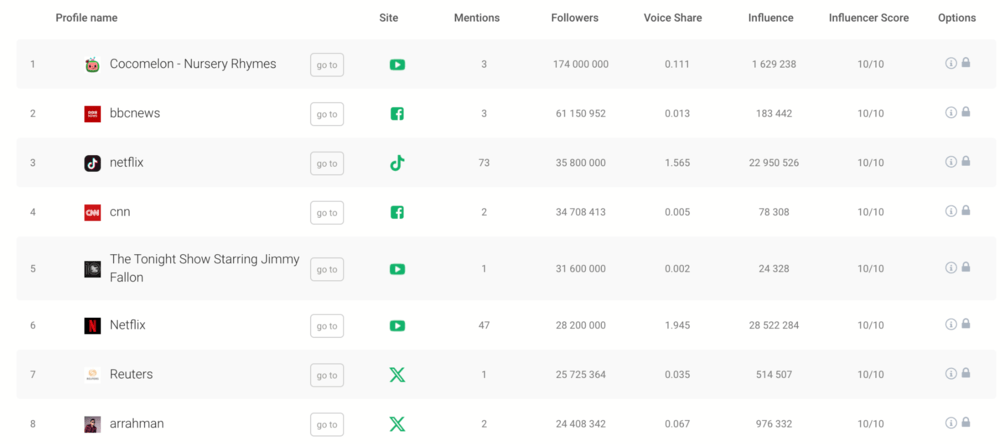
06 Lead-to-Customer Rate
Lead-to-Customer Rate calculates the percentage of leads that convert into paying customers.
This metric is the one if you want to improve your sales funnel and the effectiveness of your sales team.
It provides clear insights into how well your business converts potential interest into actual sales.
How to measure?
Calculating the Lead-to-Customer Rate (LCR) is super easy. You just need to follow these two steps:
- Divide the number of customers you’ve acquired in a period by the total number of leads you started with at the beginning of that period.
- Multiply that result by 100 to turn it into a percentage.
Here’s what the formula looks like:
LCR = (Number of leads at the start of the month ÷ Number of customers acquired in the current month) x100
Let’s go through an example to see how it works in real life:
Your SaaS company began the month with 200 leads. By the end of the month, you successfully converted 80 of these leads into customers. To find your Lead-to-Customer Rate, you would calculate it like this:
LCR=(80200)×100=40%LCR=(20080)×100=40%
This means that 40% of your leads turned into customers this month. This rate is helpful as it shows how effectively your team converts potential leads into actual customers.
07 Monthly Recurring Revenue (MRR)
Monthly Recurring Revenue (MRR) measures the predictable and stable revenue that a company expects to receive monthly from its customers.
It is critical for SaaS and other subscription-based businesses to understand cash flow and forecast future financial health.
It lets you observe stable revenue trends, identify potential issues early, and make informed strategic decisions based on reliable, consistent revenue data.
In the long run, monitoring MRR helps manage customer churn and adapt marketing strategies to ensure business growth.
How to measure?
To calculate MRR, you simply multiply the number of customers by the average revenue per user (ARPU).
Here’s the formula:
MRR = (Number of customers × Average Revenue per User)
For example, if your subscription plan costs $250 per month and you have 800 subscribers, then your calculation for MRR would look like this:
MRR=800 users×$250=$200,000
But what if you offer different pricing for specific plans?
If your service offers multiple pricing tiers, you must first calculate the average revenue per user. Let’s say you have 800 customers on a $250 plan and another 400 on a $350 plan.
Here’s how you would calculate the combined MRR:
$250×800=$200,000
$350×400=$140,000
Total revenue=$200,000+$140,000=$340,000
Average revenue per user=$340,0001,200=$283.33
Thus, the MRR with the mixed plans would be:
MRR=1,200 users×$283.33=$339,996
08 Churn Rate
The Churn Rate quantifies the percentage of customers who cancel or don’t renew their subscriptions within a given period.
Understanding and managing customer churn is crucial for all subscription-based businesses.
Why?
It indicates recurring revenue and customer lifetime value.
The significance of churn rate lies in its ability to monitor customer retention strategies and identify early warning signs.
How to measure?
Calculate the churn rate by dividing the number of customers lost during the period by the total number at the beginning of the period, then multiply by 100.
09 Customer Lifetime Value (CLV)
Customer Lifetime Value (CLV) estimates the total revenue a business can expect from a single customer account throughout their relationship.
CLV helps businesses understand how profitable long-term customer relationships are and decide how much to spend on keeping customers.
How to measure?
Calculate CLV by multiplying the average revenue per customer by the average customer lifespan:
LTV = (Customer Value x Average Customer Lifespan)
10 Customer Acquisition Cost (CAC)
Customer Acquisition Cost (CAC) measures the total cost of acquiring a new customer. It includes all marketing and sales expenses.
This metric is vital for evaluating the effectiveness and efficiency of marketing strategies.
How to measure?
Calculate CAC by dividing the total costs associated with acquisition by the number of new customers acquired.
11 CLV: CAC Ratio
This metric compares the lifetime value of a customer to the customer acquisition cost.
CLV: CAC ratio is crucial for determining the long-term viability of a company’s business model.
A higher ratio shows a good balance. It means that the customer greatly surpasses the cost of acquiring him.
How to measure?
Simply divide CLV by CAC 😉
12 Customer Engagement Score & Customer Health Score
You need more than just “good vibes” to keep your churn rate low. You should have a data-driven system that can spotlight customers who are thinking of canceling their subscriptions before they do so.
That’s where customer engagement and health scores come into play. You can measure them using some advanced monitoring tools.
- Customer Engagement Score (provides insights into how your customers interact with your service.)
Do they use your tool daily? Never exploring more advanced features?
Each action they take (or don’t take) gives you clues about how likely they are to stick around.
Setting up a tracking system might take a bit of elbow grease, but it’s a game-changer for keeping your churn rate down. When you know a customer’s every move, you can answer them with the right engagement strategies to keep them in.
- Customer Health Score (predicts whether customers will rather renew their subscription or ghost you when renewal time rolls around)
It’s all about categorizing your customers into three simple health statuses: good, average, or poor. But it’s more than just slapping on a label.
You need to dig into why they’re in each category so you can find ways to take care of them better.
For those in good health, it’s your time to upsell and deepen their commitment. Show them what more they can do with your premium features.
They’re already fans, so why not make them superfans?
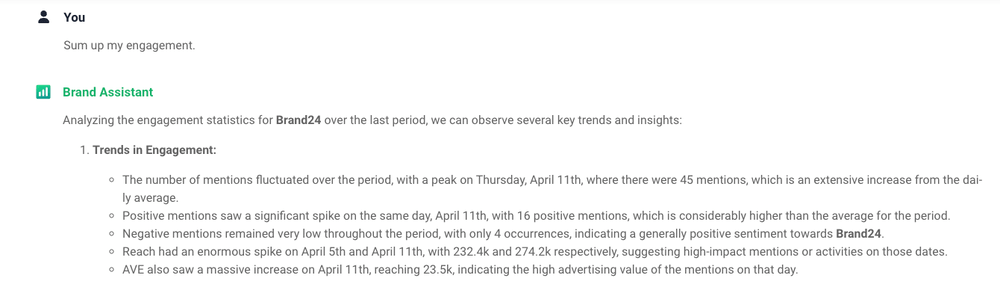
Ok, and what about the engagement around our brand? It’s also an important factor indicating the scores above.
Lucky us, it’s super easy to access data about it.
You can simply go to the Brand24 > Brand Assistant and ask him to summarize your engagement:
13 Revenue Churn
Revenue Churn measures the monthly money your SaaS loses when customers leave or downgrade.
It can also indicate if there’s a problem with customer satisfaction or if your product doesn’t quite fit the market.
How to measure?
Add up all the revenue lost from customers who canceled or switched to a cheaper plan during a specific period.
Divide this number by the total revenue at the beginning of that period and multiply by 100 to get your churn rate as a percentage.
Revenue Churn Rate = (Lost revenue ÷ Total revenue) x 100
Regularly monitoring this metric is vital for maintaining a healthy revenue stream.
14 Net Promoter Score (NPS)
Net Promoter Score (NPS) measures how likely your customers are to recommend your product to others.
It’s a direct indicator of customer loyalty and satisfaction. This score aims to find detractors and understand why they aren’t satisfied with your product.
Yep, we want it to be as BIG as possible!
A higher score means more customers are happy and likely to recommend your product.
How to measure?
Most brands conduct a survey, asking their customers to rate, on a scale from 0 to 10, their likelihood of recommending your product.
They include questions like:
- What do you like most about our product?
- How easy is it to use our product?
- Are there any features you think are missing from our product?
Then, group their responses into Promoters (9-10), Passives (7-8), and Detractors (0-6).
And now, the fun part!
Calculate NPS by subtracting the percentage of Detractors from the percentage of Promoters.
15 Annual Recurring Revenue (ARR)
Annual Recurring Revenue (ARR) shows the predictable revenue your SaaS expects to receive each year from all subscriptions.
Understanding your company’s financial health and growth over time is crucial. It helps investors and team members understand your company’s revenue stability and growth prospects.
How to measure?
To calculate ARR, follow this formula:
ARR = [Total contract revenue] / [Number of years].
PS For varied pricing models, add up the annual value of all subscriptions.
16 Activation Rate
The activation rate tracks how many new users take their first action.
It shows they’re getting value from your product. This metric can also predict whether users will continue using your product.
How to measure?
Calculate the Activation Rate by dividing the number of users who complete a key action (like setting up their account) by the total number of new sign-ups, then multiply by 100.
Activation Rate = (Number of setting-ups ÷ Total number of sign-ups) x100
This helps you understand the effectiveness of your onboarding process and improve user experience.
Tip: Advanced tools can analyze metrics for you
Ever felt overwhelmed by the volume of data you need to sift through to understand your SaaS business’s performance?
You’re not alone.
Handling analytics can sometimes feel like you’re lost in a maze of numbers… Wouldn’t it be great to have a simpler way to navigate this?
My tip is to consider tools that use AI technology. These serve more as navigators, not just analytical tools.
After all, it’s about making your data work for you, not the other way around!
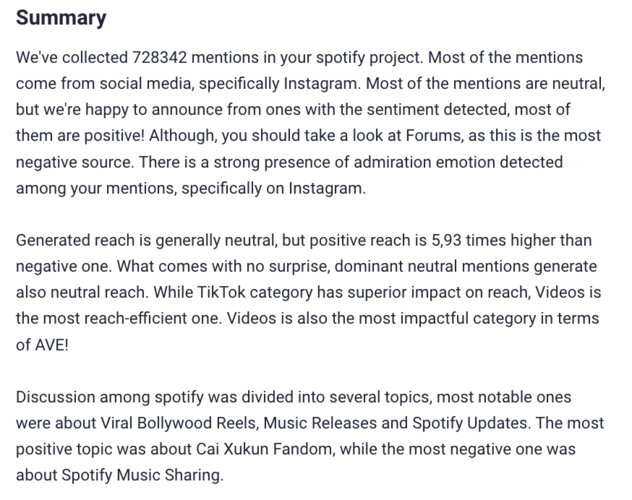
Brand24’s Metrics Analysis tab presents trends, sentiment analysis, and crucial stats in an easy-to-understand dashboard.
Plus, you get a simplified summary with all crucial information about your Saas marketing metrics:
But does it capture how people really feel about my brand? Will I have to go back to those stats to learn more?
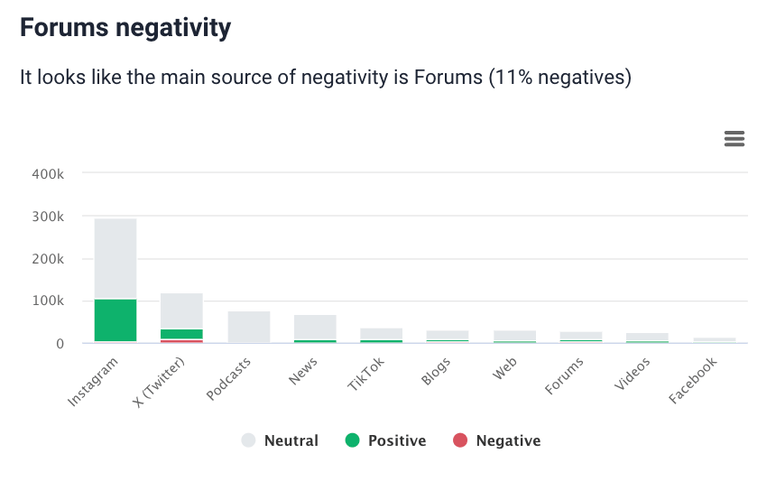
Brand24 provides a sentiment breakdown:
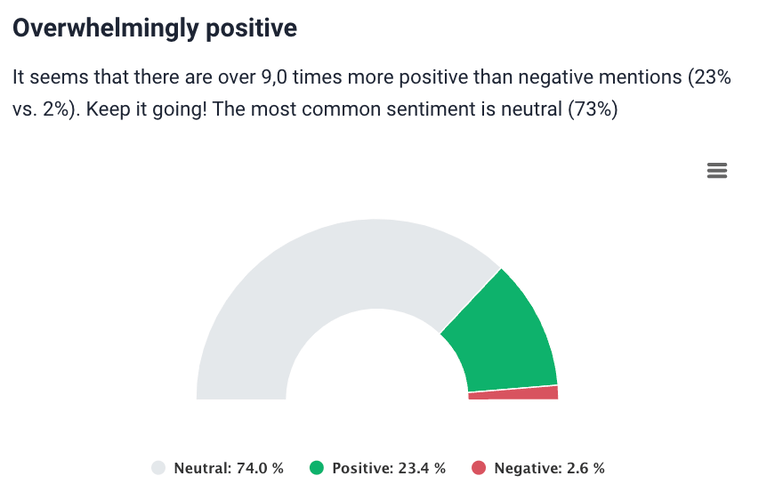
It helps you find out:
- Which channels are resonating positively with my audience?
- Where do I need improvements?
- Do people like my brand?
Ok, but it’s pretty basic, and… you love details, huh?
So do I.
That’s why I find this feature especially interesting.
Brand24’s emotion analysis identifies specific emotions associated with your brand, providing a detailed analysis of public perception:
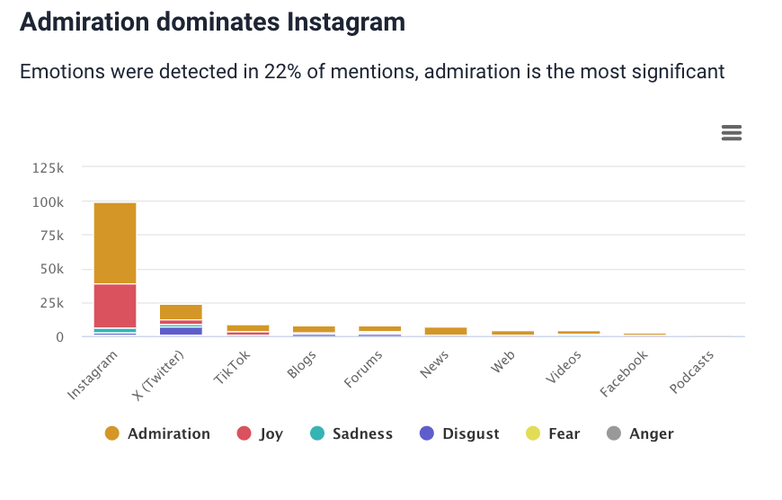
The tool also breaks down the emotional responses associated with your brand, giving you a clear picture of how your audience feels.
And how about optimizing marketing efforts?
Brand24 also helps you identify which marketing channels give you the most visibility:
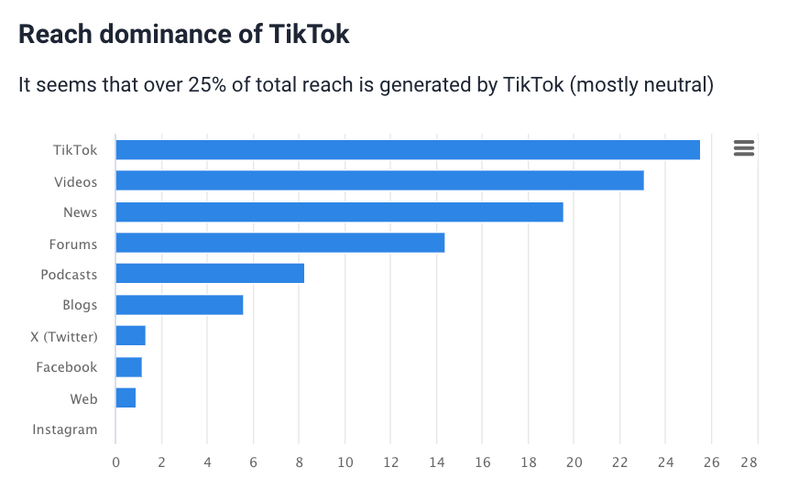
And which need some special attention:
This insight helps you optimize your marketing spend, focusing on channels that amplify your reach.
Curious how the key players are performing on the market? Check real-time metrics for IKEA, Nike, or Airbnb using the Brand Checker.
Conclusion
With all these metrics in mind, how to find the optimal approach for tracking your SaaS marketing performance?
Basic analytics and manual tracking might get the job done for small SaaS startups.
However, as your brand expands and complexities grow, our minds’ limitations quickly become apparent.
This is where I recommend a more comprehensive tool. It offers deeper analysis and AI-based conclusions automatically. So it can save invaluable time and improve efficiency.
Final thoughts:
- Engagement is key. Regularly interacting with your data (as you would with customers) can turn metrics into strategic planning.
- Don’t just collect data, use it. Dive deep into what your metrics tell you about customer behaviors, product performance, and market trends.
- Streamline to empower. Embrace tools that enhance your analytics without adding to your workload. The right tool doesn’t complicate -it clarifies.
Ready to elevate your SaaS metrics strategy? Start a Brand24 trial and unlock the full potential of comprehensive data analysis!