Table of contents
2M Marketers

“We think our customers will love it!” And maybe they will. But “we think,” “we believe,” and “it feels like” can only get a marketing team so far. At some point, you need to check what customers are actually saying, searching for, buying, and choosing instead.
That’s where the market research tools come into play. I’ve narrowed the field down to the 20 best that can help you understand customers, competitors, trends, and more. Let’s dig in!
Top 20 market research tools for 2026
| Tool | Best For | Starting Price |
|---|---|---|
|
1
|
Tracking online conversations and consumer insights
|
$199/month
|
|
Running complex surveys and advanced research studies
|
Custom pricing
|
|
|
3
|
Understanding who your audience is and how they behave
|
$150/user/month
|
|
Comparing competitors, traffic, and online market demand
|
From $99/month
|
|
|
Creating and analyzing surveys
|
$30/user/month
|
|
|
6
|
Getting consumer feedback and follow-up insights
|
Custom pricing
|
|
7
|
Creating polished, customer-friendly surveys
|
$28/month
|
|
Checking search interest, seasonality, and trends
|
Free
|
|
|
9
|
Researching search demand, keywords, and competitors
|
$139/month
|
|
10
|
Analyzing large volumes of consumer conversations
|
Custom pricing
|
|
11
|
Finding topics and content that attract attention
|
$199/month
|
|
Building, distributing, and analyzing surveys
|
$79/month
|
|
|
13
|
Combining and visualizing research from multiple sources
|
$75/user/month
|
|
14
|
Finding market size, industry data, and forecasts
|
$199/month
|
|
Discovering the questions people search for
|
$20/month
|
|
|
Turning audience research into buyer personas
|
Free
|
|
|
Researching U.S. demographics, locations, and businesses
|
Free
|
|
|
Finding public opinion and social trend data
|
Free
|
|
|
19
|
Mapping customer journeys and comparing audience segments
|
$36/user/month
|
|
20
|
Researching software competitors through customer reviews
|
Free
|


Ever sat in a meeting where everyone had a slightly different idea of who the customer is, what they want, and where the market is heading? Same.
At that point, you need data that can actually settle the debate.
That’s what I looked for in these tools. Can they help figure out who you’re targeting, what your customers actually want, what’s changing in the market, and what competitors are doing about it?
And, ideally, can they help you work out what to do next?
Because without that kind of insight, it’s much easier to misread the market. Euromonitor found that 25% of new products tracked across key FMCG markets in 2023 and 2024 were already inactive by the end of 2024.
That’s a good reminder that assuming a product will land well and knowing there’s real demand for it are two very different things.
So, I tested and compared these 20 tools with real-life research tasks in mind: collecting data, spotting patterns, and turning them into next steps.
Some of these tools are brilliant at one specific job. Others can handle a much bigger chunk of your research process. I’ll show you where each one fits, what I found useful, and where I’d look elsewhere.
These tools cover very different parts of market research, so I didn’t compare them feature-for-feature.
Instead, I looked at their overall usefulness for market research:
- how many needs can they support,
- the quality and depth of the insights,
- how easy they are to use,
- and how well they help you understand what the data is actually telling you.
Where possible, I tested the tools hands-on using real research tasks. If I couldn’t access a tool directly, I relied on official documentation, product demos, and verified user reviews.
And one more thing for full transparency: Brand24 is the tool I know best because I work at Brand24. That doesn’t give it a free pass, though. I’ve judged it by the same criteria, including where it works well and where another tool may be the better fit.
01 Brand24
4.6/5
G2 (359 reviews)
4.7/5
Capterra (255 reviews)
14-day Free trial
From $199 / Month
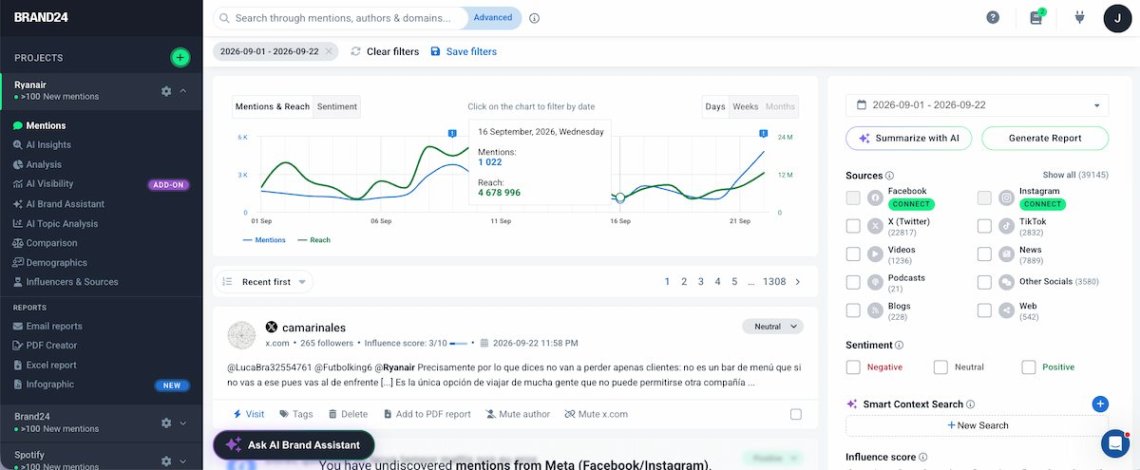
Brand24 is a social listening and media monitoring tool that can aid you in market research by keeping tabs on customer conversations already happening online.
It tracks mentions across 25+ million online sources, including social media, news, blogs, forums, reviews, podcasts, and video platforms.
Why did I choose Brand24?
Surveys are great for market research, but, personally, I find unprompted customer conversations way more valuable. Brand24 lets me in on those.
For market research, I find it most useful when I want to get outside my own brand bubble and see how people actually talk about a product, a problem, a competitor, or an entire category.
And I never limit a research project to a brand name alone. Monitoring category keywords, customer pain points, competitors, and emerging topics gives you a much broader picture.
Key features:
- AI Topic Analysis: Automatically identifies the main themes that keep appearing in your monitored mentions. Instead of reading thousands of posts yourself, you can quickly see what people talk about most and check each topic’s volume, reach, sentiment analysis, share of voice, emotions, and intent.
- Competitor comparison: Compare brands by metrics such as mention volume, sentiment, and reach. I use this for benchmarking and then dig into the actual mentions to understand why the numbers differ.
- AI Brand Assistant: Lets you ask questions directly about your project data, such as what customers complain about most or which competitor is gaining attention. It can also use real-time web search, which makes follow-up research much quicker.
- Mentions & advanced filtering: Search the underlying conversations and filter by source, sentiment, popularity, domain, author, and more.
Pros:
- Covers a wide range of public online conversations in one place.
- Gives you access to unprompted consumer opinions.
- AI features for finding patterns in large volumes of mentions.
- Real-time monitoring makes it useful for spotting changes and emerging conversations early.
- Useful for customer, competitor, category, and trend research.
Cons:
- It won’t replace survey or consumer-panel tools when you need structured responses from a defined sample.
- Broad or ambiguous keywords can require some filtering and query tweaking.
- Coverage varies between platforms, depending on what data each source makes available.
What I like most about Brand24 is the combination of listening and analysis.
I can start with thousands of unprompted conversations, spot recurring topics or shifts in sentiment, and then go straight to the posts behind them to see what drove the discussion.
I’d recommend it most for ongoing consumer, competitor, and market monitoring, especially if social conversations, reviews, forums, news, and other online sources matter to your research.
I wouldn’t use it as my only research tool if I needed representative survey data or detailed market sizing; that’s where something like Qualtrics, GWI, or Statista would take over.
02 Qualtrics
4.4/5
G2 (3,018 reviews)
N/A
Free demo available
Custom pricing
Qualtrics is probably the closest thing on this list to all-in-one market research software.
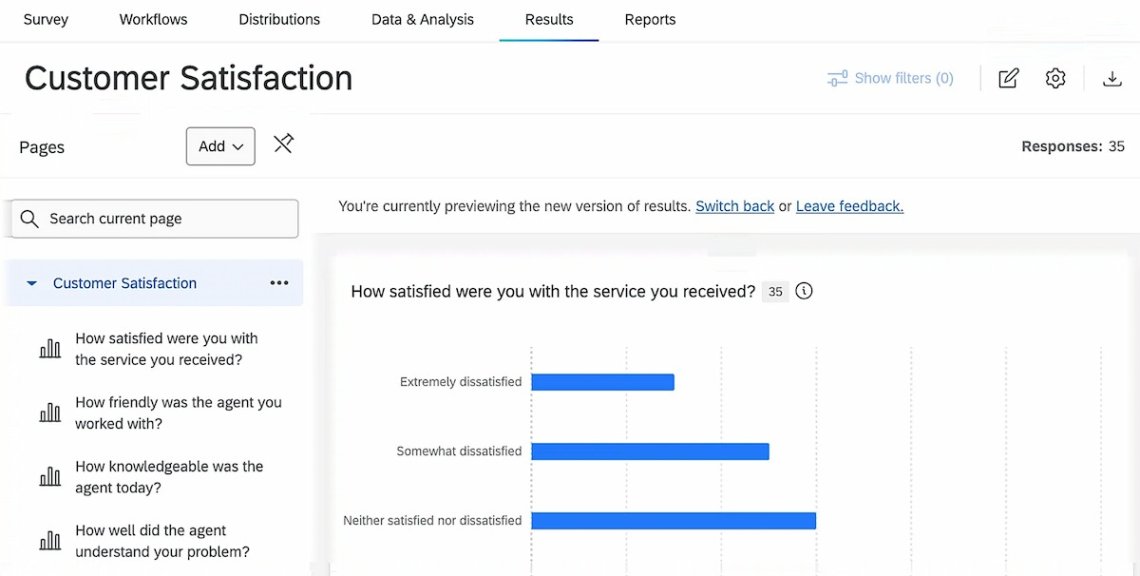
Surveys are at its core, but once you get into the platform, there’s a lot more going on: brand research, product testing, customer feedback, digital behavior, pricing studies, segmentation, and more.
Why did I choose Qualtrics?
I like how much attention Qualtrics gives to the context behind an answer.
Its digital analytics can connect survey feedback to clicks, scrolls, taps, and session replays, so if someone says your website was frustrating, you can actually see what stood in their way.
Key features:
- Advanced research methods: Go beyond standard questionnaires by splitting respondents into groups, running methods such as conjoint or MaxDiff, and then analyzing the results statistically. That depth is probably the biggest reason I’d pick Qualtrics over a lighter survey tool.
- Digital Experience Analytics: Connect survey responses with behavioral data from your website or app, including clicks, scroll depth, taps, and session replays to see what caused frustration.
- Conversational Feedback: If someone gives you the classic one-line answer like “fine,” “good,” or “not really,” the built-in AI follows up by asking the customer for more detail. As a result, you get feedback that you can actually act on. Very useful!
Pros:
- Very flexible survey logic and question setup.
- Covers product, pricing, brand, audience, UX, and customer research.
- Combines what customers say in reviews with behavioral data.
- Plenty of templates and guided methodologies if you don’t want to design every study from scratch.
Cons:
- There’s a definite learning curve once you move beyond basic surveys.
- Results can feel a little dense at first; it may take time to find the right summary or individual-response view.
- The number of options can feel overwhelming if you only need something simple.
Qualtrics is the one I’d choose if you’re dealing with several audience segments, need more detailed questionnaires, or want to connect survey responses to different stages of the customer journey.
A big plus is that survey creation, data collection, filtering, and analysis all live in one place, so you can manage almost the entire research process without stitching several tools together.
That’s also why I recommend it to teams that run research regularly. If you’re doing ongoing product, CX, pricing, or go-to-market studies, having everything under one roof saves a lot of back-and-forth.
For the occasional survey, though, it’s definitely overkill. In those cases, I’d go with SurveyMonkey instead.
03 GWI
4.4/5
G2 (202 reviews)
N/A
Free plan available
From $150 / User / Month
GWI is a consumer intelligence platform built around one very valuable thing: its own survey data.
Its flagship GWI Core study covers 53 markets, represents 3+ billion internet users, and is refreshed every quarter. With it, you can dig into everything from demographics and buying habits to attitudes, media use, interests, and brand preferences.
Why did I choose GWI?
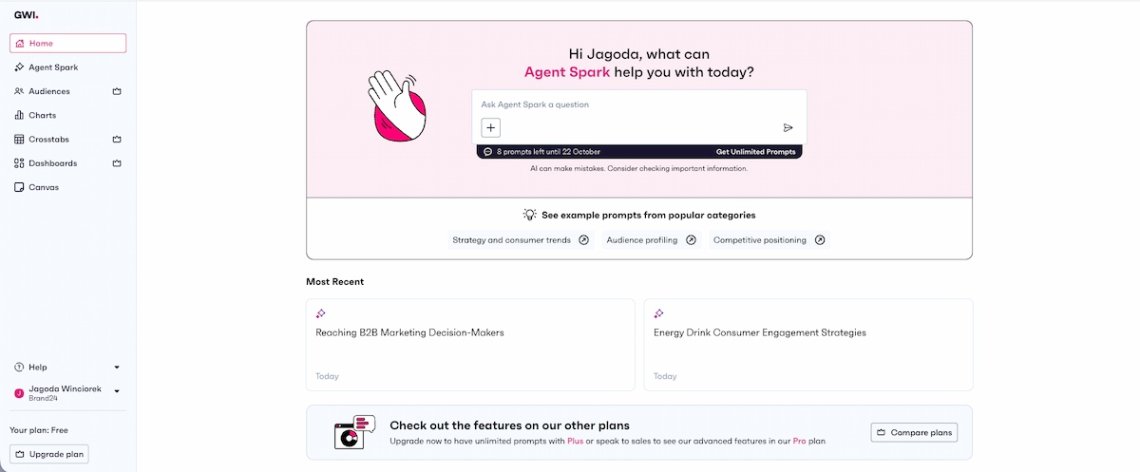
GWI’s survey data gives you a lot to play with, but Agent Spark, their own AI agent, is what really caught my attention.
Instead of digging through the data yourself every time, you can ask it questions in plain language and get answers based on GWI’s survey research, rather than a generic AI response with unclear sourcing.
And yes, you can ask it where to start, too.
Key features:
- Agent Spark: Ask questions about consumers in plain language and get answers based on GWI’s survey research. This is easily the most interesting feature for me.
- Audience builder: Define exactly who you want to study using demographics, attitudes, behaviors, interests, buying habits, media use, and plenty more.
- Crosstabs: Compare audiences, markets, or time periods. Incredibly useful for spotting patterns across different segments.
- Canvas & dashboards: Turn findings into charts, dashboards, reports, and presentation-ready slides without first moving everything into another tool.
Pros:
- Clean, easy-to-navigate interface.
- Uses GWI’s own ongoing consumer surveys.
- Covers 53 markets, making it well-suited for international research.
- Charts, dashboards, and Canvas make it easier to turn research into something you can share with the team.
Cons:
- Coverage is broad, but it won’t be equally deep for every niche market or geography.
- The more advanced research features sit behind paid plans, so costs can add up once several people on the team need access.
If my question was “Who exactly are we talking to, and what makes this audience tick?”, GWI would be high on my list.
After testing it, I think its biggest strength is how easily you can turn broad audience data into something much more usable.
You can build specific target groups, explore charts based on individual survey questions, ask Agent Spark to profile an audience for you, or generate a full PDF profile when you need something ready to share.
That’s why I’d recommend GWI most for segmentation, campaign planning, positioning, and comparing audiences across markets.
Just keep in mind that it’s built to understand broader consumer behavior patterns, not to follow customer conversations or sudden market shifts in real time.
04 Similarweb
4.4/5
G2 (1,214 reviews)
4.6/5
Capterra (261 reviews)
7-day Free trial
From $99 / Month
Similarweb is a market research tool that lets you size up competitors, traffic, search demand, and audience behavior based on what’s happening across the web.
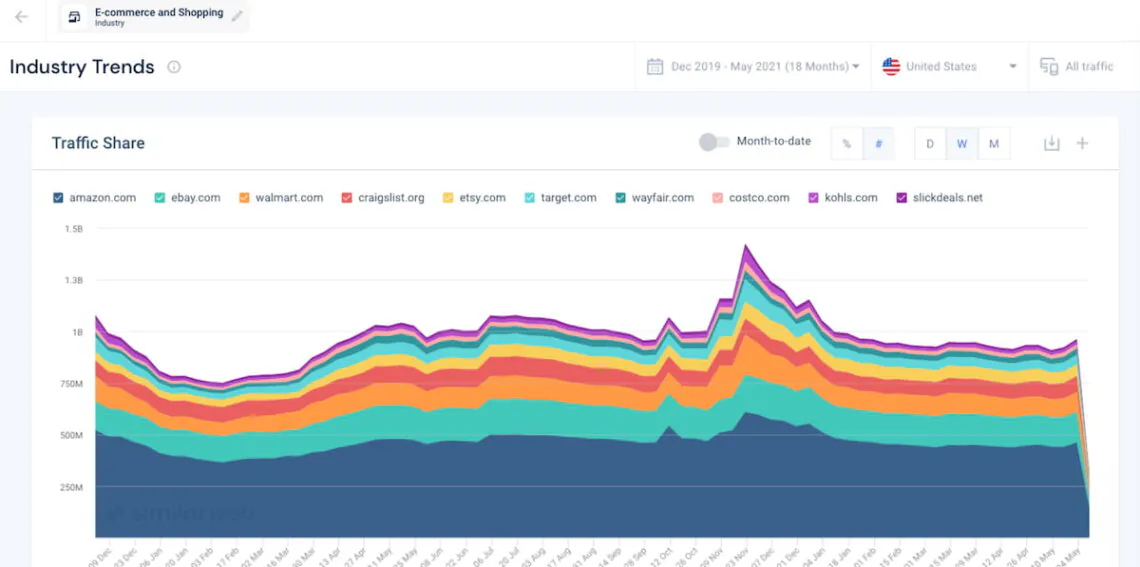
The competitor side is probably what it’s best known for, and rightly so. You can compare traffic, engagement, acquisition channels, keywords, audience overlap, and market share without having access to anyone else’s analytics.
Just remember that these are estimates, so I’d use them to spot patterns and direction rather than obsess over whether a competitor had exactly 2.4 million visits last month.
Why did I choose Similarweb?
It gives you a very practical view of how a market is moving online. You can see who’s gaining traffic, where demand is growing, which channels are driving it, and whether a trend is actually picking up steam.
I also really like the direction they’re taking with Demand Analysis. The AI Trend Analyzer spots unusual spikes in search demand and then digs into the keywords and real-world events behind them.
Key features:
- Market Analysis: See who the main players are, how they compare, and who’s gaining or losing ground. Solid starting point for any research project.
- Demand Analysis: Track what people are searching for and spot rising products, topics, or categories before they fully take off.
- Audience Analysis: Explore audience overlap, affinities, and behavior across competing sites. Very useful when you want to know whether two brands are actually chasing the same customers or just look similar on paper.
Pros:
- Gives you insight into competitors’ traffic and channels you normally couldn’t access.
- AI Trend Analyzer adds useful context to sudden shifts in search behavior.
- Covers traffic, search, audiences, competitors, and market trends.
- Visualizations are easy to turn into reports or presentations.
Cons:
- Traffic and engagement figures are estimates, so they won’t always match first-party analytics exactly.
- It tells you a lot about what people are doing online, but much less about why they feel that way than survey, interview, or social listening data.
- Many advanced research and AI features are available only on higher-tier plans.
If I wanted to understand how a market is moving online, Similarweb would be one of my first stops. Competitive landscape research and market sizing are its definite strengths.
It’s a clear go-to for strategy, market research, growth, and marketing teams that need to compare competitors, track demand, or assess where a market is gaining momentum.
Its biggest limitation is also pretty clear: digital behavior only tells part of the story. Similarweb can show you that searches for a product are rising or that a competitor has suddenly gained traffic; it won’t necessarily tell you what customers think.
05 SurveyMonkey
4.4/5
G2 (23,906 reviews)
4.6/5
Capterra (10,508 reviews)
Free plan available
From $30 / User / Month
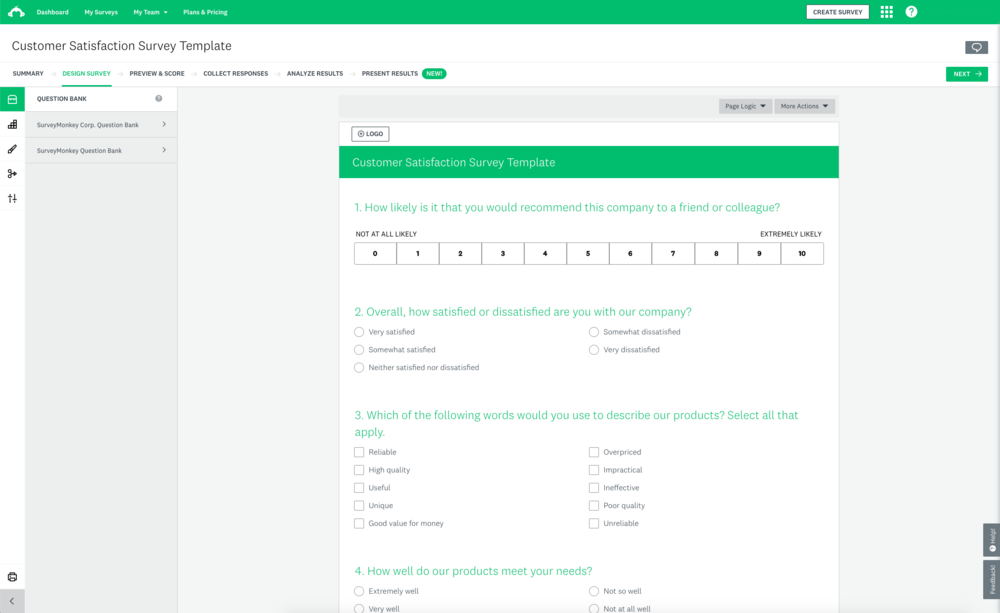
SurveyMonkey is a survey platform for collecting and analyzing feedback from customers, audiences, employees, or pretty much anyone you can convince to click your link.
As of 2026, AI is woven into the process, too. You can describe the survey you need and have SurveyMonkey draft it for you, import an existing questionnaire, or get help choosing question types as you build.
Why did I choose SurveyMonkey?
SurveyMonkey is simply my favorite of the straightforward survey tools on this list.
The interface is easy to get around, there are hundreds of templates to start with, and you can get a decent survey live without much experience.
Key features:
- Templates & survey logic: There are 500+ templates to start from, and you can adapt the survey to each respondent based on their answers. That means fewer irrelevant questions and a smoother experience for the person filling it out.
- Integrations: SurveyMonkey integrates with 200+ tools, so survey results can flow into the systems your team already uses, rather than becoming another isolated data source.
- AI survey builder: Give it a topic and a bit of context, and it drafts the survey for you. A very useful head start when you know what you want to learn but haven’t figured out how to ask it yet.
Pros:
- Very easy to learn and quick to get a survey live.
- Flexible enough for customer, product, brand, employee, and general market research.
- Results are easy to read and share without much setup.
- Large integration library makes it easy to fit survey data into existing workflows.
Cons:
- Costs climb once you need more advanced features or several team members.
- It doesn’t offer the same research depth as Qualtrics for more complex studies, such as conjoint analysis or advanced product and pricing research.
SurveyMonkey is the one I’d reach for when I know what I want to ask and just need a reliable way to ask it. Customer satisfaction, campaign feedback, concept validation, and audience questionnaires, all in one place.
I can see it working well across many different teams, simply because the learning curve is low and the use cases are broad. Whether it’s a marketing team testing a campaign or a product crew validating an idea, you can usually get from question to answers without much setup.
For everyday survey research, SurveyMonkey keeps things refreshingly simple.
06 Attest
4.5/5
G2 (168 reviews)
4.7/5
Capterra (6 reviews)
Free demo available
Custom pricing
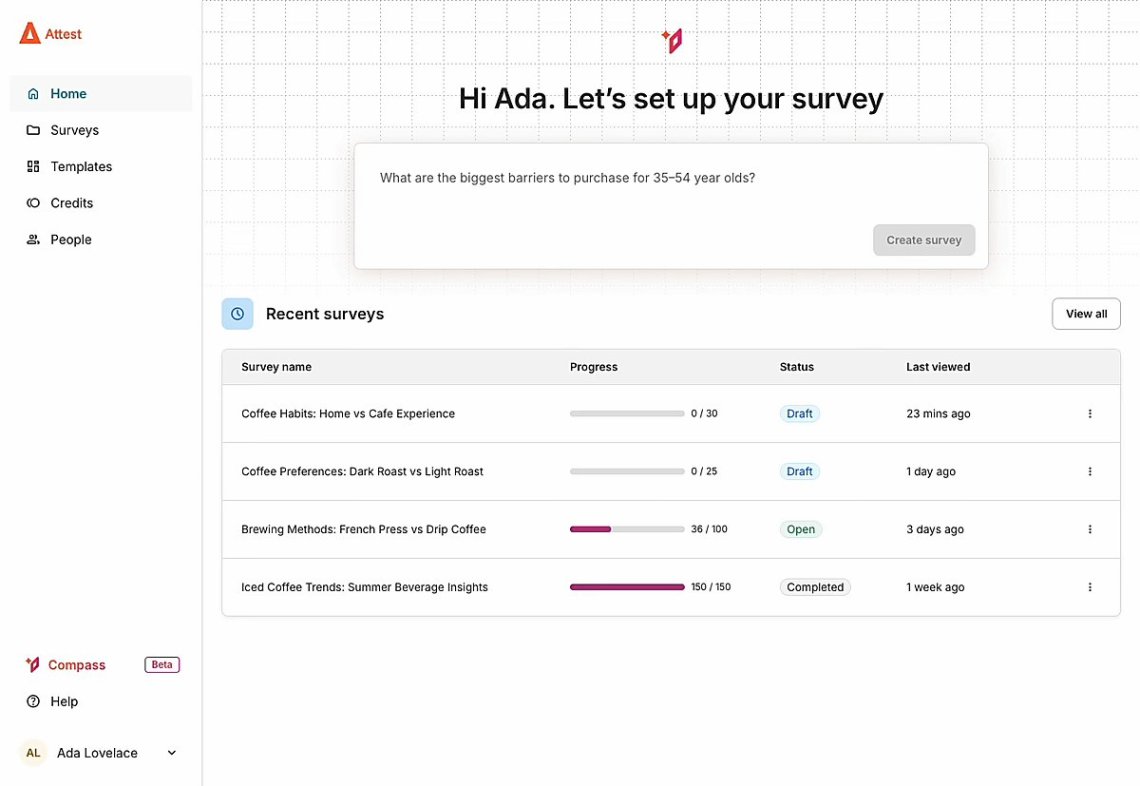
Attest is a market research platform built for fast consumer research, that doesn’t make the process feel overly technical.
You can run quantitative surveys, target people across 59 markets, and dig into the results, all in the same platform. So if you need to get a market research survey in front of a defined consumer audience, Attest covers the whole process.
There’s also a qualitative side that lets you follow up on survey results with AI-moderated interviews to understand the reasons behind the numbers.
Why did I choose Attest?
Attest is super convenient in that it gives you both sides of the picture. You can check whether an idea resonates, see how strong the signal is, and then dig into the reasons behind it without switching between tools.
Key features:
- Consumer surveys: Run quantitative research with targeted audiences across 59 markets, leveraging a network that reaches 150+ million consumers. You can narrow respondents by demographics and other targeting criteria, then compare segments to see where opinions or behaviors differ.
- AI-moderated interviews: Follow up quantitative findings with one-on-one interviews run by Attest’s AI moderator. It adapts to each respondent, probes for more detail when needed, and then analyzes the conversations to surface recurring themes and motivations behind the answers.
- Compass: Turn a research goal into a survey draft, refine questions, set up audience targeting, analyze results, and turn the findings into charts or shareable insight boards.
Pros:
- Easy to get around, even if market research isn’t your full-time job.
- Covers both quantitative surveys and qualitative follow-up.
- Fast turnaround on consumer feedback.
Cons:
- More complex studies take longer to set up and analyze.
- Survey rules feel restrictive if you need something more customized or unusual.
- Niche B2B audiences are harder to target.
- Qualitative results vary, so I wouldn’t treat AI-moderated interviews as a full replacement for deeper human-led research.
Compared with SurveyMonkey, Attest gives you more room to follow the initial survey with deeper qualitative research. So if your team needs answers fast, but a simple yes/no won’t cut it, I’d go for this one.
07 Typeform
4.5/5
G2 (1,014 reviews)
4.7/5
Capterra (979 reviews)
Free plan available
From $28 / Month
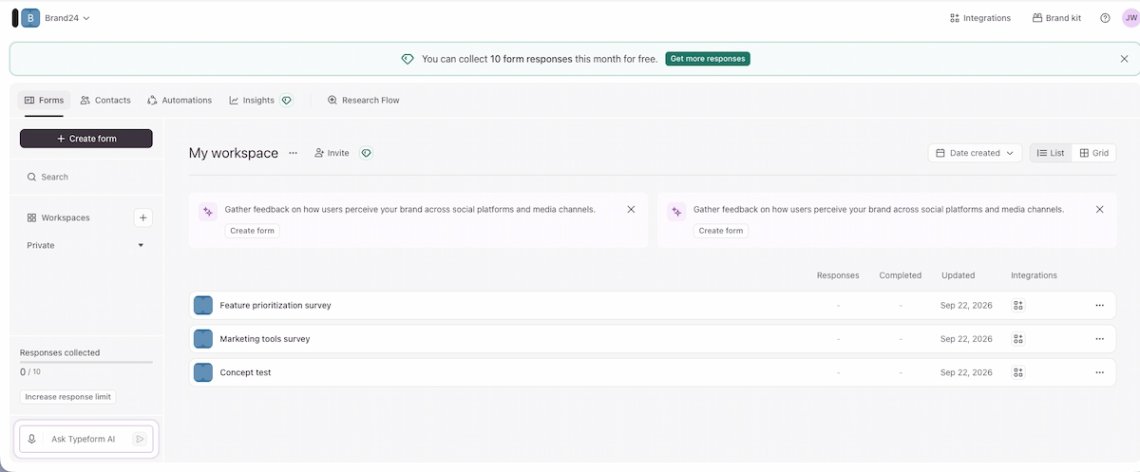
Typeform is a survey and form builder that places greater emphasis on how the survey feels to the person filling it out.
That’s its biggest strength for me. The forms look clean, questions appear one at a time, and you can customize the design to match your brand instead of sending people into something that looks like a boring spreadsheet.
Why did I choose Typeform?
Typeform keeps the experience clean, branded, and easy to follow, which makes it a strong option for customer-facing research where presentation matters as much as the questions themselves.
And honestly, if I’m asking someone to spend a few minutes filling out my survey, I’d rather make those few minutes as painless as possible.
Key features:
- Survey design: Customize fonts, colors, logos, backgrounds, and themes so customer-facing surveys actually look like part of your brand. On higher plans, Brand Kits let you save those assets and apply them consistently across forms and teams.
- Conditional logic: Create different survey paths based on previous answers, hide irrelevant questions or answer choices, and send different respondents to different sections or endings.
- Clarify with AI: Add an open-ended question, then have Typeform generate up to 2 personalized follow-up questions based on the respondent’s answer and earlier context. Works best when someone gives you a vague response, and you want a little more detail without having to follow up manually.
Pros:
- Makes surveys feel much more polished and pleasant to fill out.
- Strong branding options, so customer-facing research can still feel like part of your brand.
- Conditional logic keeps respondents from seeing questions that don’t apply to them.
- AI follow-ups help extract more detail from vague open-text answers.
- Works well for feedback, concept testing, UX research, and shorter customer studies.
Cons:
- The signature one-question-at-a-time format won’t suit every type of survey.
- Reporting is useful for everyday research, but it’s not built for very deep statistical analysis.
- Costs rise fast when you add more responses, seats, or advanced research features.
I see Typeform as the tool you pair with deeper research rather than as one that does everything itself.
For example, I’d happily use Typeform to collect customer feedback, then bring social listening tools into the mix to compare those answers with what people are saying online. Or pair it with Similarweb if I wanted to put those survey responses next to search and traffic behavior.
08 Google Trends
N/A
N/A
Free
Free
Google Trends is probably the simplest market research tool on this list. And I mean that as a compliment.
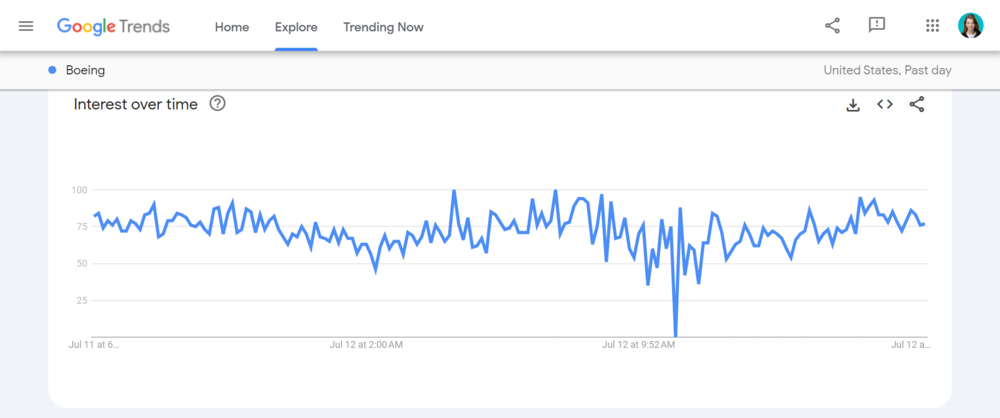
You type in a brand, product, category, or topic and immediately see how search interest has changed over time, where it’s strongest, and what related searches are gaining traction.
It works great as a quick reality check. Is that spike something new or just the same seasonal peak coming back around? Are people more interested in product A or product B?
Why did I choose Google Trends?
Sometimes you just need to check whether the interest you’re seeing is actually there.
Google Trends is one of the quickest ways I know to do that. It won’t give you the full market picture, but it can quickly tell you whether an assumption is worth investigating further.
Key features:
- Interest over time: Track whether search interest is growing, declining, seasonal, or relatively stable. You can also compare the current period with an earlier one, which I find especially useful for checking whether a sudden spike is genuinely unusual or something that happens every year.
- Interest by region: See where a topic is searched most often and drill down into regions, cities, and, in some countries, metro areas.
- Related & rising searches: Find queries people also search alongside your topic and see which ones are growing fastest. If Google marks a query as “Breakout,” it means search interest has increased by more than 5,000%, a good signal that something new may be emerging.
- Trending Now: Track searches currently surging across 100+ countries and regions, with data refreshed on average every 10 minutes. You can filter by timeframe, compare trends, and open related news to understand what may be driving the spike.
Pros:
- Completely free.
- Takes very little time to get useful directional data.
- Great for spotting seasonality, rising interest, and regional differences.
- Makes it easy to compare brands, products, categories, or topics.
- Related searches can uncover trends and questions worth researching further.
Cons:
- The 0–100 scores show relative search interest, not absolute search volume.
- Very niche or low-volume topics may not return enough useful data.
- It can show you that something is gaining attention, but usually not why.
For me, Google Trends is usually a starting point, not the final answer.
I’d use it to spot an interesting change, then move to Semrush if I wanted more detailed keyword and search volume data, or Similarweb if I wanted to understand the broader demand and competitive landscape.
For a tool that’s free and takes about a minute to check, though, it earns its place in the research stack.
09 Semrush
4.4/5
G2 (4,035 reviews)
4.6/5
Capterra (2,328 reviews)
7-day Free trial
From $139 / Month
I already use Semrush a lot for SEO, but plenty of the same data is useful well before you start thinking about keyword rankings.
With Semrush, you can see what people are searching for, how demand changes, which questions keep coming up, and where competitors are already getting visibility.
For me, that makes it useful for researching a market through search behavior.
Why did I choose Semrush?
Because search data can tell you an awful lot about what people want before they ever land on your website.
I like being able to start with one broad topic and keep pulling the thread: what else are people searching for, what questions do they ask, which parts of the topic have the most demand, and where are competitors already ahead?
Key features:
- Keyword Overview: Enter a keyword to check its national, global, or local search volume, intent, CPC, competition, 12-month trend, and related metrics. I use it as a first check to see whether there’s meaningful demand behind a topic before digging deeper.
- Keyword Gap: Compare your domain with up to five competitors and see the keywords they rank for that you don’t, along with shared and unique search terms. I find this particularly useful for spotting topics, needs, or stages of the customer journey you may have overlooked.
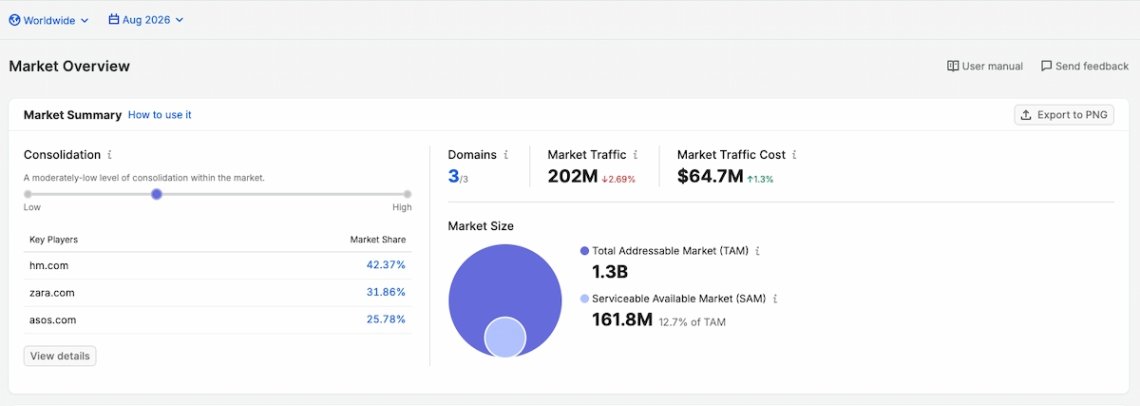
- Market Overview: Semrush’s separate Traffic & Market toolkit zooms out from individual keywords to the wider market. You can compare competitors, see who’s gaining ground, and estimate TAM and SAM to better understand the market.
Pros:
- Excellent for uncovering the language customers actually use in their searches.
- Makes it easy to compare your search presence with competitors.
- Useful for both broad market exploration and very specific niche research.
- Search intent helps separate casual information-seeking from more commercial demand.
Cons:
- Search data tells you what people look for, but not necessarily why they want it or how they feel about it.
- The paid plans can get expensive once you need several toolkits or users.
If Google Trends tells me interest is moving, I go to Semrush next to figure out what people are actually searching for, how much demand there is, and which competitors are already capturing it.
From there, it’s much easier to see which topics deserve more attention and where the strongest opportunities might be.
I’d recommend it most to growth and marketing teams that want to use search behavior as a window into market demand, customer needs, and competitor activity.
10 Brandwatch
4.4/5
G2 (728 reviews)
4.2/5
Capterra (255 reviews)
No free trial
Custom pricing
Brandwatch is a consumer intelligence platform built for researching what people say online on a pretty serious scale.
It gives you access to conversations from more than 100 million online sources, with a huge historical archive stretching back years.
This is definitely one of the more research-heavy tools on the list. There’s a lot you can slice, segment, compare, and analyze, which is great when you have a complex question at hand.
Why did I choose Brandwatch?
For me, the big reason is the depth of the data.
If you want to understand how a category has changed over several years, compare different consumer groups, or dig into a large volume of conversations about a market, Brandwatch gives you plenty of room to do so.
Key features:
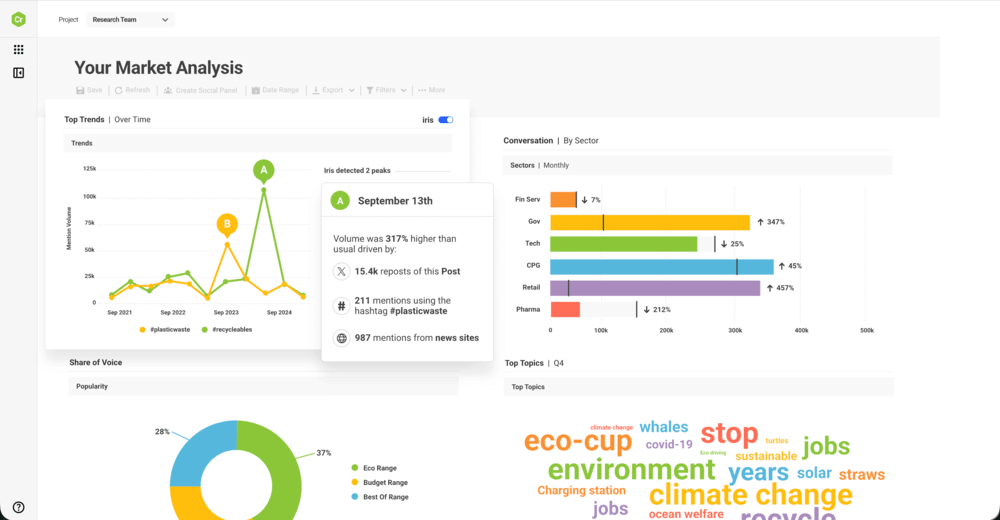
- Consumer Research: Search and analyze conversations from 100M+ online sources, with historical data going back to 2008. You can also bring in first-party text data, such as surveys, support tickets, or call logs, and analyze it alongside online conversations.
- Iris AI: Brandwatch’s AI assistant turns large datasets into summaries and insights, helping you get through the analysis stage without manually combing through everything yourself.
- Audience & conversation segmentation: Break conversations into categories or audience groups and compare how different segments behave, talk, and respond.
Pros:
- Huge amount of historical and real-time consumer conversation data.
- Very strong segmentation and customization options for deeper research.
- Lets you combine online conversations with your own first-party text data.
- AI features help make very large datasets easier to work through.
Cons:
- There’s a learning curve to using the more advanced research and segmentation features.
- It’s a lot of platform if your research needs are relatively straightforward.
- Pricing isn’t publicly listed, and there’s no self-serve free trial for Consumer Intelligence.
Brandwatch is the one I’d choose for large, complex research projects: several markets, years of historical conversation, multiple audience segments, or a category with a huge amount of discussion to untangle.
I’d put it in the hands of insights, strategy, and enterprise marketing teams that need to compare consumer behavior across audiences, markets, and time periods.
For a quick pulse check, though, I’d go with a lighter social listening tool.
11 BuzzSumo
4.5/5
G2 (107 reviews)
4.5/5
Capterra (146 reviews)
7-day Free trial
From $199 / Month
BuzzSumo is a content research tool that helps you see what people are reading, sharing, asking about, and paying attention to online.
You can search a topic, competitor, or domain and quickly see which articles have performed best, which stories are starting to take off, and what questions keep coming up around the subject.
Its Content Analyzer tracks 8 billion pieces of content across 195 countries and 170+ languages, with up to five years of historical data. That gives you a solid foundation for determining which topics and formats resonate with your audience.
Why did I choose BuzzSumo?
Because it gives you intel not only on what people search for, but also what gets their attention once it’s published. That’s where BuzzSumo excels.
Key features:
- Content Analyzer: Search BuzzSumo’s archive to see which content gets the most shares, links, and engagement. You can filter by date, country, language, content type, publisher size, and more, then compare performance across up to five years of data.
- Question Analyzer: Search questions people are asking across 100,000+ forums, including Reddit and Quora. Results are grouped by question type, which makes it easier to spot recurring concerns, comparisons, and gaps in what people still want answered.
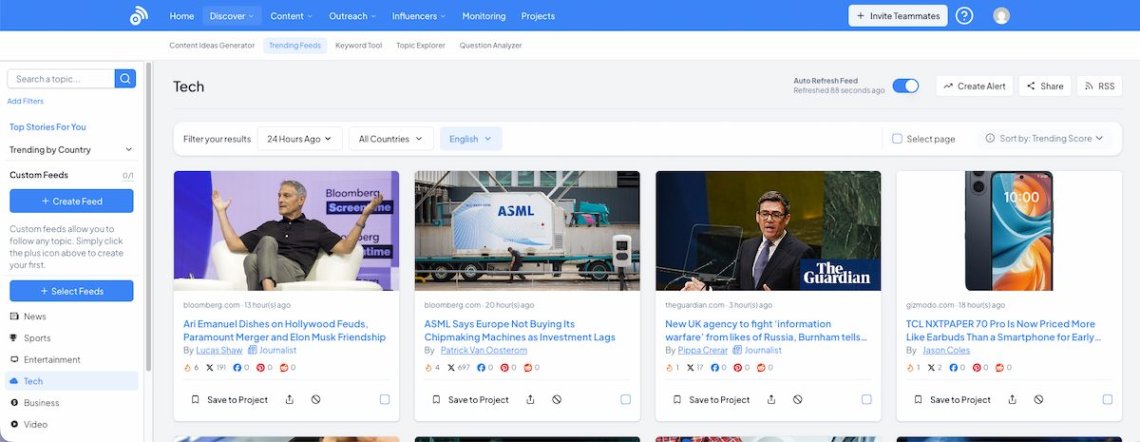
- Trending Feeds: Track stories gaining traction right now and build custom feeds around topics, domains, or countries. Each result includes a Trending Score based on how quickly it’s being shared, so you can separate genuinely rising stories from popular content.
- Competitor content research: search a competitor’s domain to see which pieces, formats, and topics generate the strongest engagement and backlinks over time.
Pros:
- Makes it easy to see which topics and content angles already have audience traction.
- Historical engagement data for separating one-off hits from topics that perform consistently.
- Strong for competitor analysis and content-gap research.
Cons:
- It tells you much more about content behavior than demographics or broader consumer attitudes.
- It’s not a replacement for surveys, panels, or deeper social listening research.
BuzzSumo gives you a unique look into what your audience actually cares enough to read, share, or ask about.
Just keep in mind that attention isn’t the same thing as demand. A topic getting loads of shares or engagement doesn’t automatically mean people are ready to buy anything related to it.
Still, as a way to spot what’s resonating, which questions keep coming up, and where audience interest is building, it’s a useful extra layer of market context.
12 Startquestion
N/A
N/A
14-day Free trial
From $79 / Month
Startquestion is a survey and feedback platform for running customer, user, employee, and market research.
You can use it to test ideas before entering a market, learn more about an existing audience, validate assumptions, or simply ask customers the questions your analytics can’t answer for you.
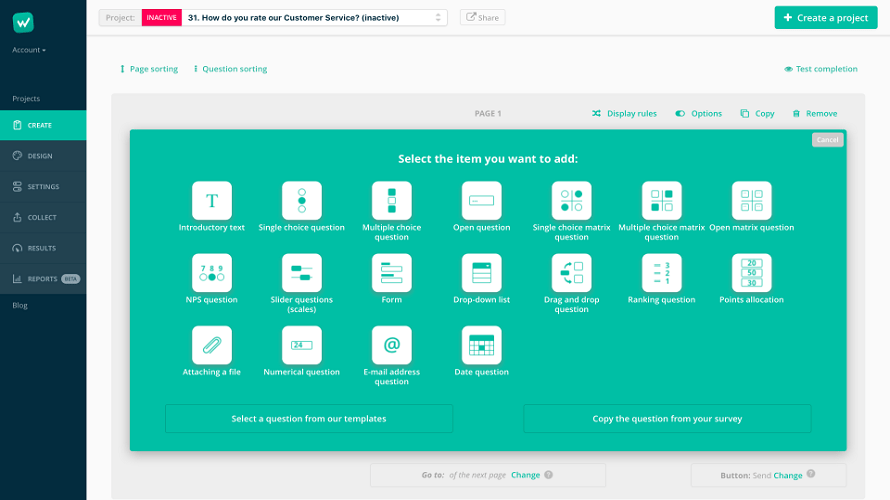
There are ready-made templates and different question types to work with, including multiple-choice, open-ended, rating scales, and matrices. You can also customize the survey with your own logo, colors, and fonts.
Why did I choose Startquestion?
With Startquestion, you can draft the survey with AI, adapt the questions and branding, send it to the right audience, and analyze the responses all in one place. That end-to-end simplicity is what earns it a spot here.
Key features:
- Ready-made templates & question types: Start with 150+ survey templates and adapt them with multiple-choice, open-ended, rating, matrix, and other question formats. You can also add logic and personalization so respondents only see questions relevant to them.
- AI Survey Creator: Describe your research objectives, and Startquestion drafts the questionnaire for you, including the survey structure, question wording, and response options.
- Real-time analysis & reports: Filter and segment responses, track trends and rankings, and share findings through live reports or recurring PDF reports.
Pros:
- Covers survey creation, distribution, analysis, and reporting.
- Automation options for recurring research.
- Segmentation and filtering tools for when responses begin to come in.
- Easy enough to use.
Cons:
- Doesn’t draw conclusions from analyses.
- Some useful features, including multilingual surveys, advanced reporting, and AI analysis of open-ended responses, are reserved for higher plans.
- The cheaper plans have response and seat limits, so growing research programs may need to move up a tier fairly quickly.
I think Startquestion would work best for small and mid-sized marketing or product teams that run surveys regularly but don’t need something as heavy as Qualtrics.
It could also work nicely alongside media monitoring tools like Brand24 or Brandwatch: use Startquestion to ask customers directly, then compare those answers with the unprompted conversations you’re seeing online. That will give you both sides of the story.
13 Tableau
4.4/5
G2 (4,222 reviews)
4.6/5
Capterra (2,361 reviews)
14-day Free trial
From $75 / User / Month
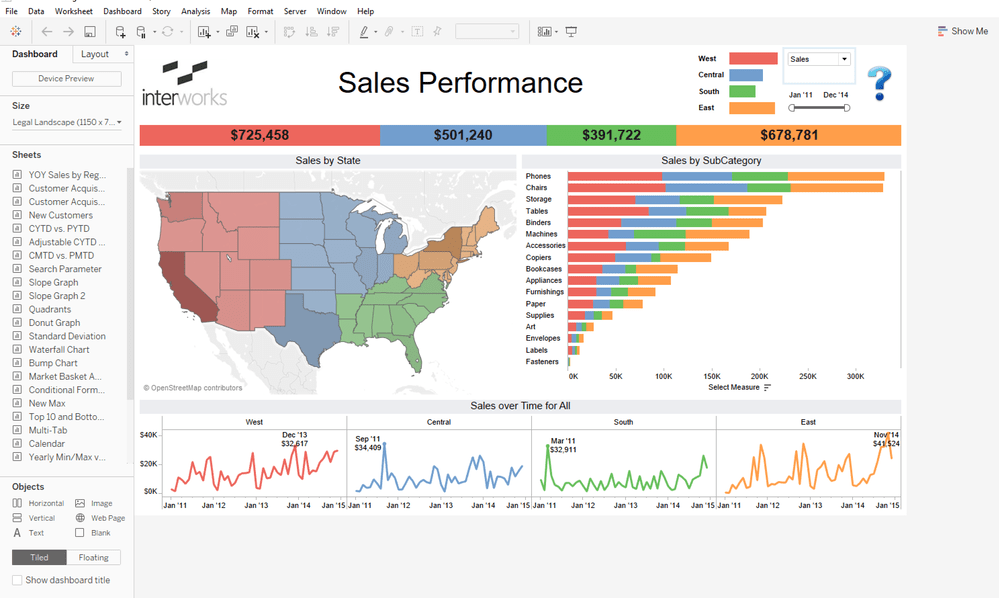
Tableau is a business intelligence tool for data visualization. It won’t find respondents, monitor conversations, or tell you what people are searching for.
Instead, you bring the data to Tableau and use it to turn spreadsheets, survey results, analytics, sales data, and other sources into something much easier to explore.
Why did I choose Tableau?
Tableau fills an important gap in marketing research, compared to other tools on this list. Instead of collecting new market research data, it helps you bring together the data you’ve already gathered and make sense of it in one place.
And when I tested Tableau, I noticed that the first useful insights often came from simply putting two datasets side by side.
A pattern that was easy to miss in separate spreadsheets became pretty obvious once I could filter and compare them in one view. That’s why I find Tableau so useful.
Key features:
- Interactive dashboards: Turn research data into dashboards people can filter, explore, and drill into.
- Multiple data connections: Bring together data from spreadsheets, text files, databases, cloud platforms, and sources such as Salesforce or Google Analytics.
- Data visualization: Turn larger datasets into charts, comparisons, and interactive maps, including choropleth, point distribution, heat, and flow maps.
Pros:
- Can combine multiple research and business data sources in one place.
- Possibility to share research with clients, leadership, or other teams.
- Free desktop edition gives individual users a way to work with Tableau without immediately paying for a full deployment.
Cons:
- It doesn’t collect research data itself, so you’ll need other tools to feed it.
- There’s a learning curve once you move beyond basic charts and dashboards.
- Paid team setups can become expensive quickly.
For me, Tableau comes into play once I’ve gathered market data from a few sources and want to build a single shared view of the findings.
For example, you could pull survey findings from Startquestion, search or competitor data from Semrush, and your own sales or analytics data into one dashboard.
That way, instead of presenting each data source in isolation, you can actually see how the different pieces of your market research fit together.
14 Statista
4.4/5
G2 (30 reviews)
N/A
Free plan available
From $199 / Month
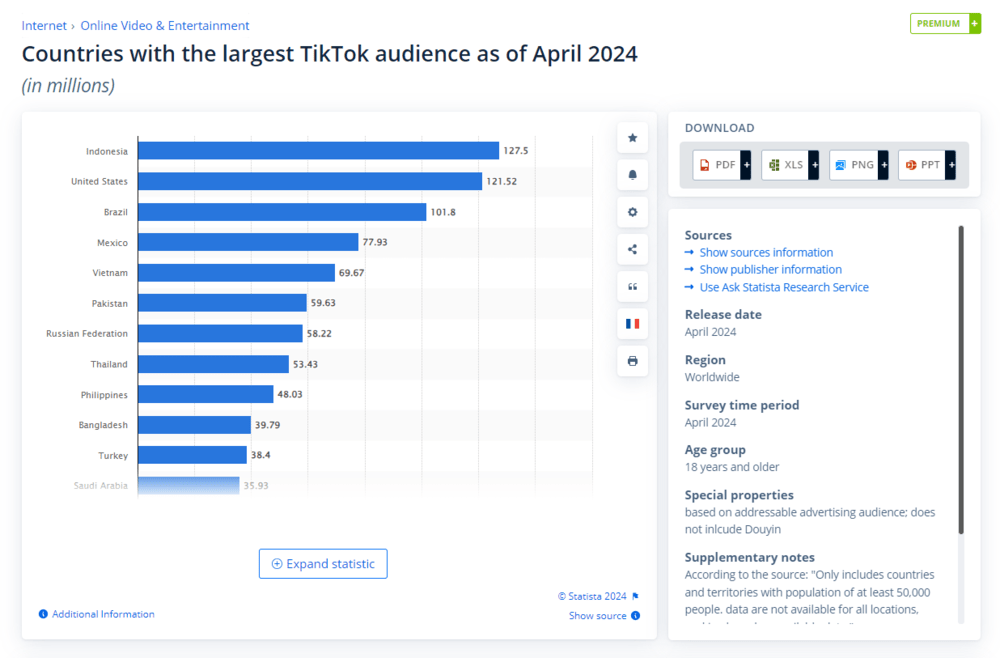
Statista is basically a huge market data aggregator.
It brings together statistics, market research reports, forecasts, and consumer and market data from thousands of sources across industries and countries.
If there’s a number I’m struggling to find elsewhere, Statista is usually one of the first places I check.
Why did I choose Statista?
Because sometimes you don’t need to run new research at all. You just need to find out what’s already known.
Statista is great for that first layer of market research: market size, growth, consumer behavior, company data, industry benchmarks, and forecasts.
Key features:
- Market Insights: Explore market size, revenue, growth, forecasts, and other indicators across industries and countries.
- Consumer Insights: Dig into consumer behavior, attitudes, brand usage, demographics, and purchasing habits. You can even build audience segments and compare them to see where behaviors or preferences differ.
- Statistics & reports: Search across 80,000+ topics, 170+ industries, and 50,000+ sources, with more than 32,000 studies available in the research database.
Pros:
- Brings information from many reputable sources into one place.
- Clear visualizations make complex datasets much easier to digest.
- Forecasts add useful context when you’re looking at where a market might be heading.
Cons:
- Many of the most useful datasets and reports are behind paid plans.
- Existing data won’t answer questions specific to your exact product or audience.
For me, Statista is one of the first places to check before collecting any new data.
I’d use it to build the broader market picture first, then bring in something like Startquestion or Attest if I still needed answers specific to my audience, product, or idea.
15 AnswerThePublic
4.5/5
G2 (38 reviews)
4.6/5
Capterra (11 reviews)
7-day Free trial
From $20 / Month
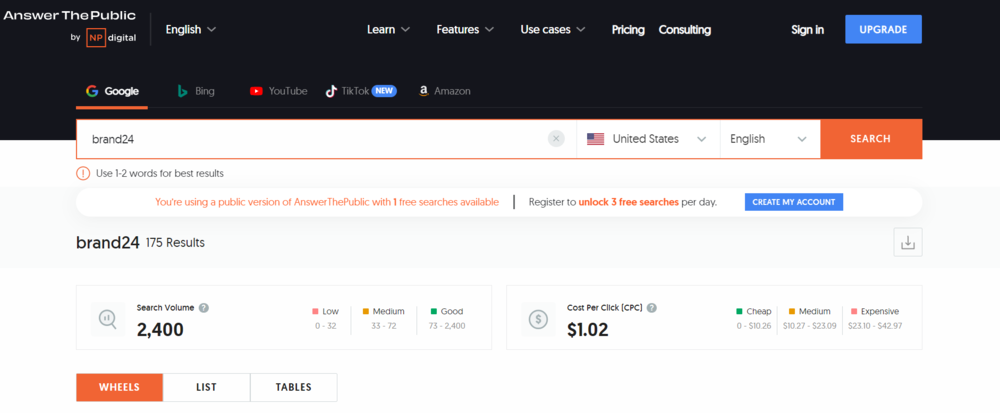
AnswerThePublic turns what people search for into a pretty revealing map of their questions, comparisons, problems, and interests.
Give it a topic, product, or brand, and it pulls together related searches from sources like Google, Bing, YouTube, TikTok, Amazon, and even AI platforms.
The classic question are still here, but you also get search volume, CPC data, historical comparisons, and alerts when search behavior on a topic starts to change.
Why did I choose AnswerThePublic?
I like AnswerThePublic because it allows me to get closer to the actual language customers use: what confuses them, what they compare, what they’re worried about, and what they need help choosing.
Key features:
- Question research: Enter a seed term and see the questions people are searching around it, grouped by words like what, why, how, can, and which. Very useful for spotting recurring concerns and knowledge gaps.
- Comparisons & prepositions: Explore searches built around terms such as vs, versus, with, without, for, near, and like. These can reveal competitors, desired features, use cases, local intent, and even different audience groups
- Search volume & CPC: Add some context to the ideas you uncover by checking estimated demand and commercial value.
- Search Listening alerts: Track selected searches over time and get notified when new questions or patterns appear. That turns AnswerThePublic from a one-off brainstorming tool into something you can use to keep an eye on changing customer interests.
Pros:
- Very quick way to uncover customer questions and pain points.
- Useful for exploring unfamiliar markets before you know exactly what to look for.
- Visual reports make large groups of searches easier to scan.
- Free access is enough to do some lightweight research.
Cons:
- Search behavior can reveal what people are curious about, but not necessarily what they think after buying or using a product.
- Search volume and CPC figures are estimates rather than first-party analytics.
I’d recommend AnswerThePublic to teams that are still shaping the questions they want to investigate.
It’s lighter than Semrush and much less about full competitive analysis, but that’s also the point.
Use it when you want to uncover the language, questions, and comparisons people are already using, then take the strongest themes into something like Startquestion or Attest for deeper validation.
16 Make My Persona
N/A
N/A
Free
Free
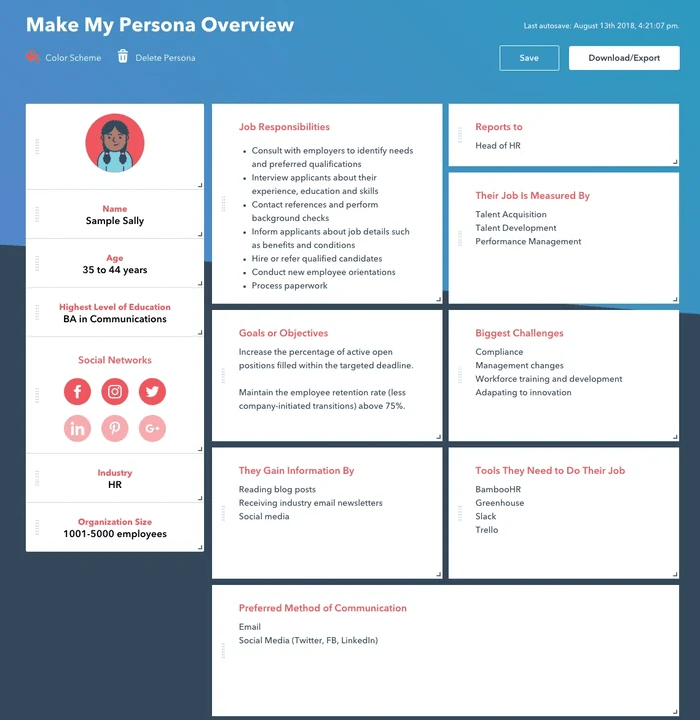
Make My Persona is HubSpot’s free AI persona generator for turning audience research into structured buyer personas.
You describe your target customer in plain language, and the tool builds a profile covering demographics, goals, responsibilities, pain points, behaviors, and communication preferences. You can then edit the result and export it as a shareable document.
The important bit, though: I wouldn’t treat the AI-generated details as research in themselves.
A good persona should still be grounded in actual customer data, interviews, surveys, reviews, or other evidence. HubSpot recommends building personas from real data and recurring patterns, too.
Why did I choose Make My Persona?
Once you’ve done the hard work of understanding your audience, you can plug in the details you already know and turn them into a clear persona without worrying about the layout, structure, or design.
It’s simple, it’s free, and for this particular job, I don’t really need it to be anything more.
Key features:
- AI persona generation: Describe your target customer, and get a structured persona covering demographics, goals, responsibilities, pain points, and other characteristics. The more context you provide, the more detailed the profile gets.
- Editable profiles: Review the generated persona and adjust any details that don’t match what you already know from customer research. I’d definitely treat the AI output as a starting point rather than evidence in itself.
- Shareable output: Download the finished persona as a polished document and use it across campaign briefs, content planning, sales training, or product discussions.
Pros:
- Completely free.
- Very quick way to turn audience research into a structured persona.
- Gives marketing, sales, and product teams one shared reference point.
Cons:
- It won’t do the actual customer research for you.
- AI-generated details can easily turn into assumptions if you don’t check them against real evidence.
- You can save up to three personas at a time, which may feel limiting if you’re working with lots of audience segments.
Make My Persona naturally comes into play after tools like Startquestion, Attest, or GWI have already helped you learn something meaningful about your audience.
17 Census Bureau
N/A
N/A
Free
Free
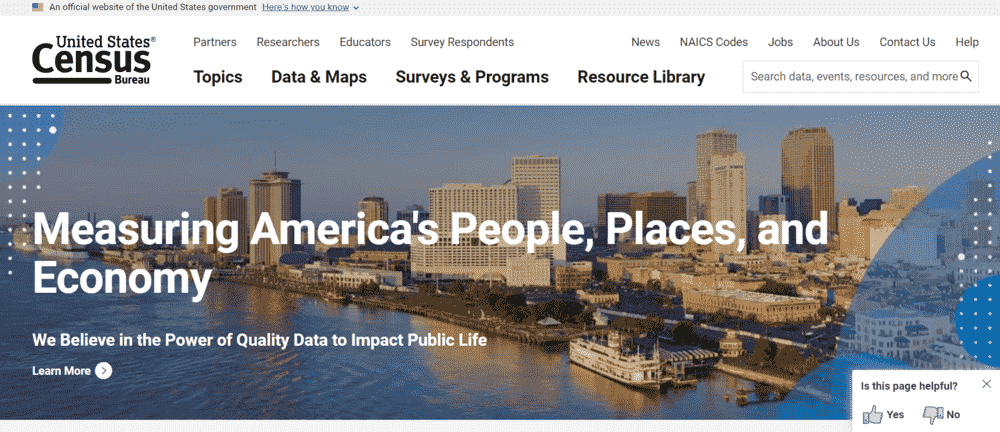
The U.S. Census Bureau is less a single market research tool and more a vast collection of free demographic, economic, and business data.
With it you can dig into population, income, education, housing, employment, industries, business activity, and plenty more, often down to a very specific geographic area.
And because the data comes directly from the Census Bureau’s own surveys and programs, it’s one of the first places I’d check before paying for third-party demographic data.
The catch is that it only covers the U.S. market.
Why did I choose the U.S. Census Bureau?
Because I seriously doubt most teams could collect demographic and economic data at this scale, or with the same level of accuracy, on their own.
If I were researching a U.S. market, audience, or expansion opportunity, I’d rather start with Census Bureau data than try to recreate that research myself.
Also, one of the first things I noticed with Census data is just how specific you can get geographically. National averages are easy to find elsewhere, but being able to narrow the data to a particular state, county, or local market makes it much more useful for actual market research.
Key features:
- Census data explorer: Search thousands of tables, build custom maps, and browse profiles covering 100,000+ U.S. geographies, from states and counties down to ZIP codes and congressional districts.
- Census Business Builder: Pull demographic, economic, and business data into one map-based view, then compare locations, rank areas, and download charts or reports. It’s built specifically for questions like where to open, expand, or assess a market.
- American Community Survey: Dig into annually updated data on 40+ topics, including income, education, employment, housing, commuting, and demographics.
Pros:
- Completely free.
- First-party U.S. government data.
- Lets you research very specific locations rather than relying only on national averages.
- Makes some of the heavier datasets much easier to explore visually.
Cons:
- It’s focused on the U.S., so it won’t help much with international market research.
- The sheer amount of data can be intimidating if you don’t already know which survey or table you need.
- Data freshness varies between datasets, so it’s not a source for real-time market changes.
I’d recommend the Census Bureau most for U.S.-focused market entry, location research, audience sizing, and demographic profiling.
It’ll give you the factual backbone: who lives there, what they earn, what businesses operate there, and how the area is changing.
From there, I’d add something like Attest or Brandwatch if I also needed to understand what those people think, want, or talk about.
18 Pew Research Center
N/A
N/A
Free
Free
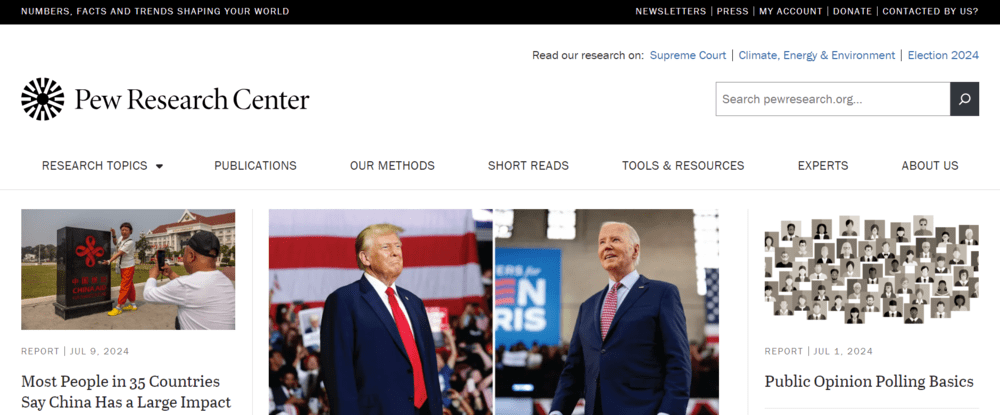
Pew Research Center is a non-profit organization that publishes public opinion polling, demographic research, and other data-driven studies on how people live, think, and behave.
Its research covers topics such as technology, media, work, education, demographics, social trends, and global attitudes.
Why did I choose Pew Research Center?
It’s pretty straightforward. The research is free, the methodology is transparent, and you get access to studies that would be difficult and expensive for most marketing teams to recreate.
Key features:
- Public opinion research: Explore surveys on attitudes, behaviors, values, and social trends across topics such as technology, media, work, education, and personal finances. Most U.S. surveys are run through Pew’s American Trends Panel of about 10,000 randomly selected adults, which gives the findings a strong methodological base.
- Demographic & social trends: Track how behaviors and attitudes change across generations and population groups, with research covering areas like work, family, education, finances, and broader U.S. population trends.
- International research: Go beyond the U.S. with cross-national studies and global attitude research. To date, the Center has conducted 800,000+ interviews in 110+ countries, with country-level methodology published alongside the research.
Pros:
- Completely free.
- Transparent methodology makes it easier to judge how much weight to give a finding.
- Historical research lets you see how opinions and behaviors have changed over time.
- Covers both U.S. and international topics.
Cons:
- You can only research the questions Pew has chosen to study.
- It won’t give you findings tailored to your particular product, brand, or customer segment.
- Coverage varies by topic and country, so you won’t always find data for a very specific niche.
- It’s a research library rather than an analysis platform, so you’ll still need to interpret the findings and connect them to your own market.
I’d recommend Pew most to strategy, insights, and marketing teams that need a broader context around an audience or market.
It pairs naturally with the Census Bureau: you can use Census data to understand who makes up a U.S. market, then check Pew for more context on how those people think or behave.
After that, your own surveys or customer research can fill in the questions specific to your business.
19 UXPressia
4.5/5
G2 (37 reviews)
4.8/5
Capterra (80 reviews)
Free plan available
From $36 / User / Month
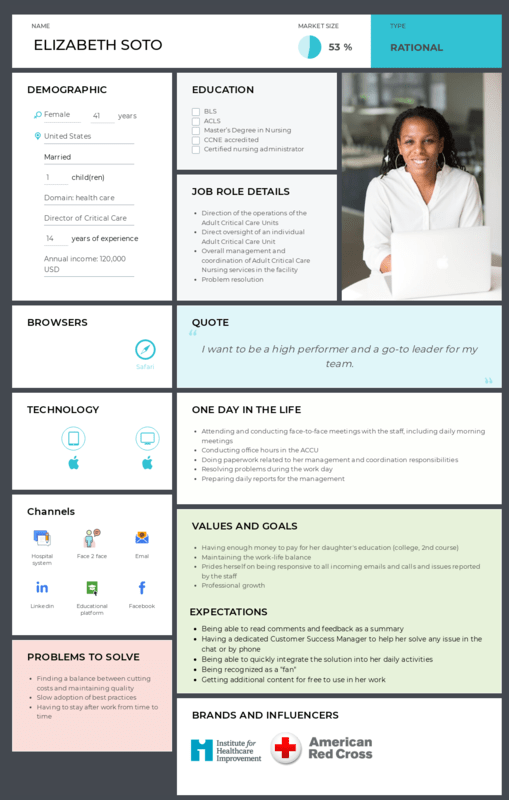
UXPressia helps you organize what you’ve learned about customers into visual personas and maps of their experience with your business.
You can create marketing, buyer, employee, or user personas, add details about their goals, behaviors, frustrations, and background.
But personas are only part of it.
You can also map what customers experience at different stages of their journey, compare audience segments, and connect customer-facing problems with what’s happening behind the scenes in your business.
Why did I choose UXPressia?
I like that you can take several types of customer research and turn them into one concrete view of the experience.
For example, you can build a persona, map what that person does at each stage, add their goals, pain points, emotions, and touchpoints, and then compare that journey with another segment.
Key features:
- Persona builder: Create marketing, B2B and B2C buyer, employee, or user personas with sections for goals, motivations, frustrations, behaviors, background, and more. You can build them manually or use AI to generate a first draft.
- Customer journey maps: Map what customers do, think, and feel across different stages, then add touchpoints, pain points, channels, metrics, and linked personas.
- AI Journey Assistant: Ask questions about an entire journey map, identify pain points, generate summaries, suggest improvements, or update sections through chat.
Pros:
- Turns audience research into something much easier for the whole team to understand and use.
- Strong collaboration features for teams working on research together.
Cons:
- It won’t collect the customer research for you.
- AI-generated details need to be checked before they are accepted as facts about your audience.
- The free plan gets restrictive once you’re managing more than a few personas or journeys.
I’d most recommend UXPressia to UX, CX, and product, teams that already conduct market research and want to make it easier to use across the business.
You could collect feedback with Attest or Startquestion, add unprompted customer conversations from Brand24, and then bring those findings into UXPressia to build your personas and map the customer journey.
And by the end of it, you’ll have a well-rounded picture of who your customer is, what they experience at each stage, and where the biggest friction points are.
20 G2
N/A
N/A
Free
Free
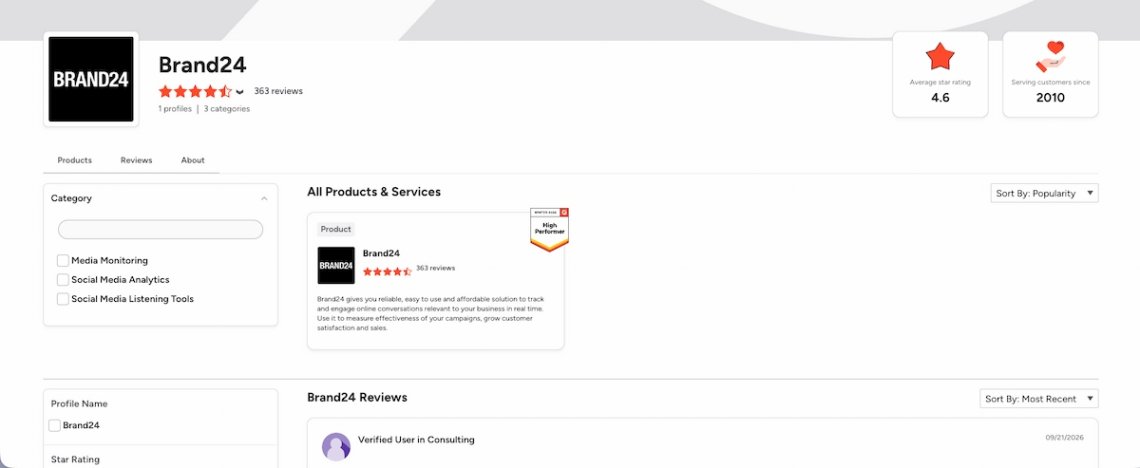
G2 is a software review platform, so its usefulness for market research is pretty specific: it lets you see what actual users like and dislike and compare across competing products.
And there’s a lot to work with. G2 currently has more than 3.6 million reviews across thousands of software products and categories.
You don’t need an account just to browse those reviews either, which makes it an easy place to drop into when you’re researching a competitor, category, or product problem.
Why did I choose G2?
Because competitor websites will tell you what their product does well. G2 is where I’d go to see where users agree… or disagree.
I always make sure to look past the overall rating and read the recurring pros and cons. If the same complaint keeps appearing across reviews, it can tell you a lot about unmet expectations, weak spots in the category, or opportunities to differentiate your own product.
Key features:
- Pros & cons: G2 groups recurring strengths and weaknesses from recent reviews into common themes, so you can see what users repeatedly praise or complain about without reading every review one by one. The summaries are based on reviews from the previous 18 months and update monthly.
- Product comparisons: Compare up to four products side by side using ratings and real user feedback.
- Software categories: Explore whole software categories to see the main players, alternatives, and how products compare within the same market.
Pros:
- Free to browse.
- Gives you direct access to feedback from people actually using competing software.
- Useful for spotting recurring complaints, missing features, and product strengths.
- Makes competitor comparisons much quicker.
- Especially useful for B2B SaaS and software market research.
Cons:
- It’s mainly useful for software and technology markets.
- Reviews are still individual experiences, not market trends.
- Popular products usually have much richer review data than newer or niche competitors.
A simple research exercise I actually use: open your three main competitors, scan the most recent reviews, and note the complaints or compliments that keep coming back.
Those patterns are usually far more useful than any one rating. They can show you where competitors are falling short, what customers genuinely value, and which expectations shape the whole category.
That makes G2 well-suited for product marketing, competitive intelligence, product, and content teams working in software.
What are the most important features of a great market research tool?
After going through these 20 tools, one thing should be pretty clear: there’s no universal checklist for a “great” market research tool.
A survey tool, a social listening platform, a public data source, and a visualization tool perform completely different functions.
So instead of counting available features, I’d start with the research question you’re trying to answer.
01 Start with what you actually need to learn
This is the easiest way to narrow the list down.
| If you need to… | Start with tools like… |
|---|---|
|
Run surveys and collect direct feedback
|
SurveyMonkey, Typeform, Startquestion, Attest, Qualtrics
|
|
Track online conversations and opinions
|
Brand24, Brandwatch
|
|
Research search demand and customer queries
|
Google Trends, Semrush, AnswerThePublic
|
|
Study competitors
|
Similarweb, Semrush, G2
|
|
Spot trending topics and content
|
BuzzSumo, Semrush, Brand24
|
|
Understand audiences and consumer behavior
|
GWI, Statista, Pew Research Center, Brand24
|
|
Build personas and customer journeys
|
Make My Persona, UXPressia
|
|
Combine and visualize your own data
|
Tableau, Pew Research Center
|
|
Find market data and forecasts
|
Statista, Pew Research Center, U.S. Census Bureau, GWI
|
If I need representative consumer feedback, for example, a brilliant social listening platform still won’t replace a survey panel.
And if I only want to check whether interest in a category is growing, I probably don’t need an enterprise research suite to do it.
02 Check where the data actually comes from
This is one feature I would treat as non-negotiable.
Before trusting a finding, check what sits behind it. Is the tool using first-party survey data? Public government datasets? Estimated website traffic? Online conversations?
Also, check how recent the data is and whether that level of freshness fits your question.
Real-time data is incredibly useful when you’re monitoring conversations or emerging trends. It matters much less when you’re researching demographics, long-term market growth, or public opinion.
03 Decide whether you need data collection, analysis, or both
This can save you from paying for a tool that solves only half the problem.
Some tools mainly collect the evidence. Think surveys in Attest or online mentions in Brand24.
Others help you analyze or organize data you already have. Tableau is a good example.
Before buying anything, check which stage is currently slowing down your research. You may not need another data source, but rather some help in making sense of the data you already have.
That’s where platforms like Insights24 come in.
Its analysts pull together Brand24 findings with SEO and market data, then investigate specific business questions – for example, why a competitor is gaining ground, which product features are pushing sentiment up or down, or where customer perception starts to weaken.
A dashboard can show that sentiment dropped, a competitor gained visibility, or a topic suddenly took off, but it usually won’t explain why. They are great at showing patterns and changes, but human analysis connects those signals, adds business context, and helps teams understand what they should do next.

04 Find AI tools that actually take work off your plate
I definitely wouldn’t go with the rule of “more AI = better.”
The best AI tools for market research are the ones that genuinely take work off your plate.
That might mean automatically identifying themes across thousands of mentions, drafting a survey, or allowing you to ask direct questions about a research dataset.
That’s useful.
An AI button added to the dashboard just because every product apparently needs one in 2026? Less convincing.
So I’d look at what the AI actually does, what data it works from, and whether you can still check the evidence behind its answer.
05 Check how easy it is to share your findings
Research rarely ends with the person who ran it.
If you’re presenting findings to leadership, clients, product teams, or other marketers, pay attention to the reporting side too.
Depending on your workflow, that might mean:
- clear charts and visualizations,
- customizable reports,
- shareable or interactive dashboards,
- easy exports,
- collaboration features,
- filters that let different teams explore the data themselves.
06 Be realistic about your budget
You can do a surprising amount of market research for free.
Google Trends can show you changes in search interest. The U.S. Census Bureau and the Pew Research Center provide access to large public datasets. G2 provides software teams with thousands of customer reviews to sift through. Make My Persona can help package audience research at no cost.
Paid tools become worthwhile when you need more data, better targeting, automation, recurring research, advanced analysis, or several people working from the same platform.
Conclusion
Don’t choose a market research tool by the length of its feature list. Choose it based on the gap in your research.
Need to know what customers say when nobody is asking? Start with Brand24 or Brandwatch.
Need direct answers from a defined audience? Go to Attest, SurveyMonkey, Startquestion, or Qualtrics.
Need to understand search demand, competitors, or market size? That’s where Semrush, Similarweb, Google Trends, GWI, and Statista come in.
And in many cases, one tool won’t be enough. The strongest setup is usually a mix: one source for behavior, one for opinions, and one for broader market context.
And if your research objectives call for deeper qualitative feedback, you can pair these tools with traditional market research methods like interviews or focus groups.
My rule is simple: every tool in your research stack should answer a question that the others can’t.
FAQ
Market research tools cover different parts of the research process. Survey tools like SurveyMonkey, Attest, and Qualtrics collect direct feedback; social listening tools like Brand24 and Brandwatch analyze online conversations; and search and competitor tools like Semrush, Similarweb, and Google Trends help you study demand and market activity.
You can also use secondary data sources such as Statista, Pew Research Center, and the U.S. Census Bureau, or tools like Tableau and UXPressia to organize and present what you’ve already learned.
The best free market research tools include Google Trends, the U.S. Census Bureau, Pew Research Center, G2, and Make My Persona.
Together, they can cover search trends, demographics, public opinion, research on software competitors, and basic audience profiling.
For deeper market research, look at Qualtrics, GWI, Brandwatch, Similarweb, Statista, and Tableau.
Qualtrics is particularly strong for complex surveys and research methods, GWI for detailed audience analysis, Brandwatch for large-scale consumer conversations, Similarweb for markets and competitors, and Statista for existing market data and forecasts. Tableau becomes useful when you need to combine several research sources and analyze them together.
Some of the best AI market research tools are Brand24, Qualtrics, GWI, Attest, Brandwatch, and Startquestion.
They use AI for different jobs: Brand24 finds patterns in large volumes of online conversations, Qualtrics and Attest help with survey research and analysis, GWI lets you query consumer data in natural language, Brandwatch helps analyze large datasets, and Startquestion can generate surveys from a research goal.
The important part isn’t how much AI a tool has, though. Choose based on which part of the research process you actually want AI to speed up.