Table of contents
How to Create a Facebook Analytics Report? Template & Example [2026]
Reporting is one of those tedious tasks that many marketers leave until the last minute. It requires experience to choose the right metrics to filter through a flood of numbers. Then, just when your brain’s already fried, you need to make it all look good. Charts, graphs, and diagrams that are easy to study? Another challenge. But here’s the good news: AI can change this game!
In this article, I’ll show you how to make a Facebook analytics report shorter than usual, use report templates, and apply AI tools.
Quick summary
- Facebook analytics provide important data on page performance, content effectiveness, and audience behavior. Digging into this data regularly gives you a clearer picture of how well your content reaches your target audience.
- Make it a habit to check key social media metrics like sentiment, reach, and impressions regularly. These numbers reveal what’s working and what’s not.
- Advanced tools like Brand24 and Meta Business Suite take your reporting to the next level. They simplify complex data, track cross-channel performance, and even offer smart recommendations to optimize strategy confidently.
Let’s dive in!
What is a Facebook analytics report?
A Facebook analytics report is a document or an interactive dashboard highlighting your Facebook Page performance.
It pulls together key metrics to show how your content is doing, who you’re reaching, and whether your efforts are paying off.
But let’s be honest. When you hear “report,” your brain probably goes, “Ugh, not this again.” Most marketers either rush through it at the last minute or avoid it (hey, we’ve all been there).
But what if we flipped the script?
Whether you’re trying to figure out if your Facebook marketing strategy is working, see if your page is growing, or spot areas for improvement. A report isn’t just another to-do. It’s your shortcut to clarity.
These reports are for anyone who uses Facebook professionally and wants to get as many page insights as possible, including:
- Social media managers
- Agencies
- Enterprises
Facebook analytics report template
It’s good to notice that Facebook Analytics is no longer available. The Meta Business Suite replaced it in June 2021.
That’s where you can source basic activity reports, run Facebook ads campaigns, or access Facebook insights data. But to be honest, looking for a deep analysis, this native app can be not enough. Especially for big-scale companies and enterprises.
Nowadays, a better option is to analyze your Facebook analytics data, gather in-depth insights, spy on competitors, speed up the reporting process, and provide recommendations.
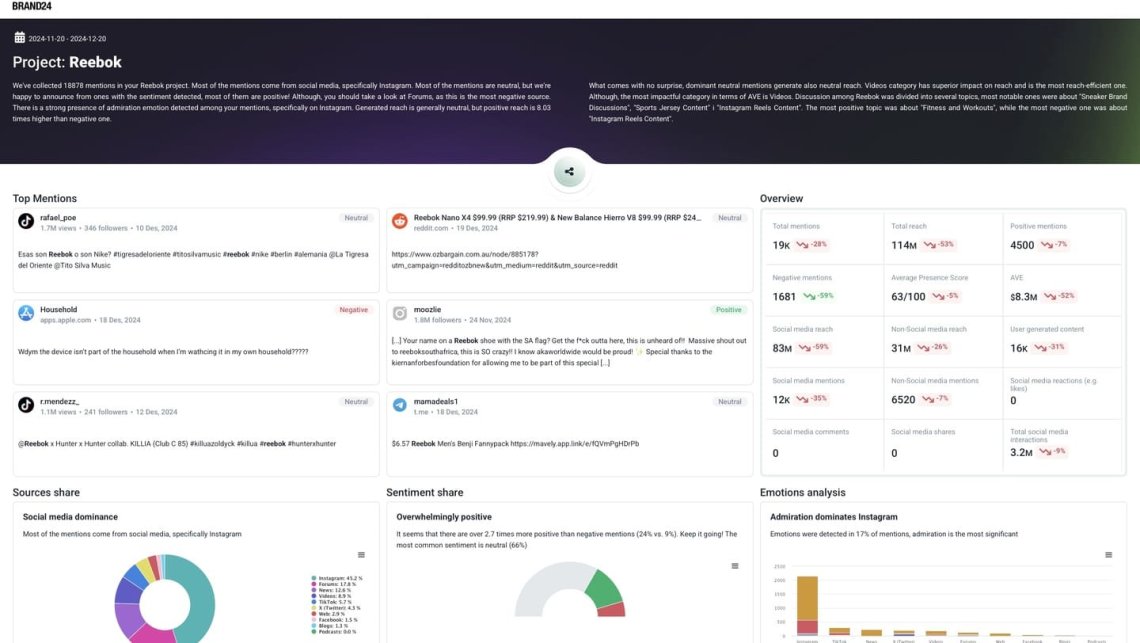
Here, I generate some examples of reports to show you what is waiting there for you. Check it out:
What I like the most about Brand24’s Facebook reporting options:
- Easy to share with my team
Slack integration makes it simple to send reports directly to the team without extra steps. It saves time and keeps everyone aligned. - Cross-channel performance view
I can see how Facebook performs alongside other social media channels. It helps me understand the bigger picture and gather all the relevant data. - Tracks non-social sources
That can change a lot! Big magazines write articles about brands or use Facebook posts. I can find it out easily and count those mentions in my Facebook report. - Through deeper competitor and influencer analysis
I get valuable insights into what competitors and influencers are doing, which helps with benchmarking, content ideas, and potential collaborations. - AI-powered insights
AI summarizes trends, identifies spikes in mentions, and points out what’s driving the conversation on my Facebook page. Making it easier and faster to fill out any Facebook insights report template with meaningful takeaways.
How to get a Facebook analytics report? 9 steps
01 Choose your goals
Each final version of analytics reports always depends on the goals that you have chosen.
The more clearly your goals are defined, the better. They help shape your marketing strategy, focus your marketing efforts, and pinpoint the most relevant Facebook insights to track.
Most common Facebook analytics report goals:
- Measure brand awareness
- Evaluate engagement levels
- Understand audience demographics
- Drive website traffic
- Compare performance across channels
- Monitor sentiment & brand mentions
- Report on Facebook marketing campaign impact
02 Choose key metrics
As you can see, there are various goals you might set. Based on those, custom metrics to focus on your Facebook analytics report.
If you aim to increase reach or brand visibility, your report will center around performance metrics like impressions and post reach.
Some core metrics should always be included in Facebook’s analytics reports. Those key metrics provide a clear picture of a page’s performance and serve as a basis for shaping and enhancing the overall marketing strategy.
List of all the important Facebook metrics:
- Engagement metrics
- Post impressions
- The volume of mentions
- Social media reach
- Page followers
- Sentiment
- Click-through rate (CTR)
- Advertising Value Equivalency (AVE)
I’ve found that many marketers who use Meta Business Suite struggle with two of these metrics.
What is an impression on Facebook and reach?
- Facebook post reach = People
- Facebook post impressions = Views
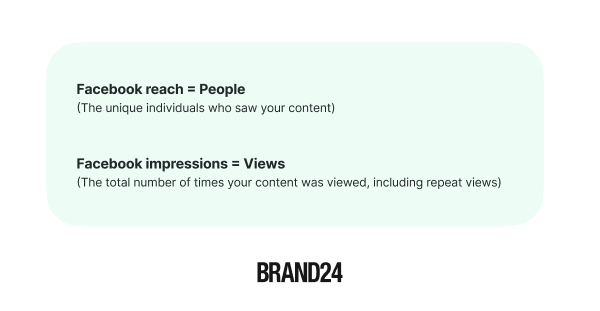
Read more about Facebook metrics.
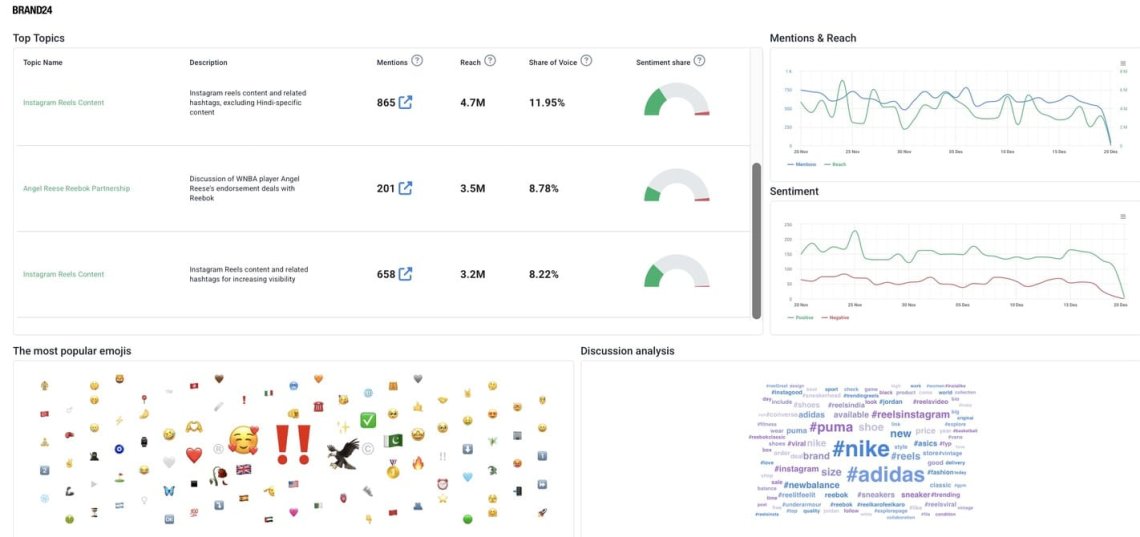
03 Remember about data visualizations
In fact, human brains are adapted to process images faster than text. They’re easier to understand, faster to remember, and much more engaging than blocks of words, right?
This means that if you want your message to stick, get noticed, or impact decisions, visuals are not optional – they are essential.
That’s why it’s a great idea to choose a reporting tool that offers a full range of visuals for report templates. This way, I don’t waste additional time creating them in Canva or Excel.
Helpful visuals to include in your social media report:
- Charts, graphs, and diagrams
- Infographics
- Images and screenshots
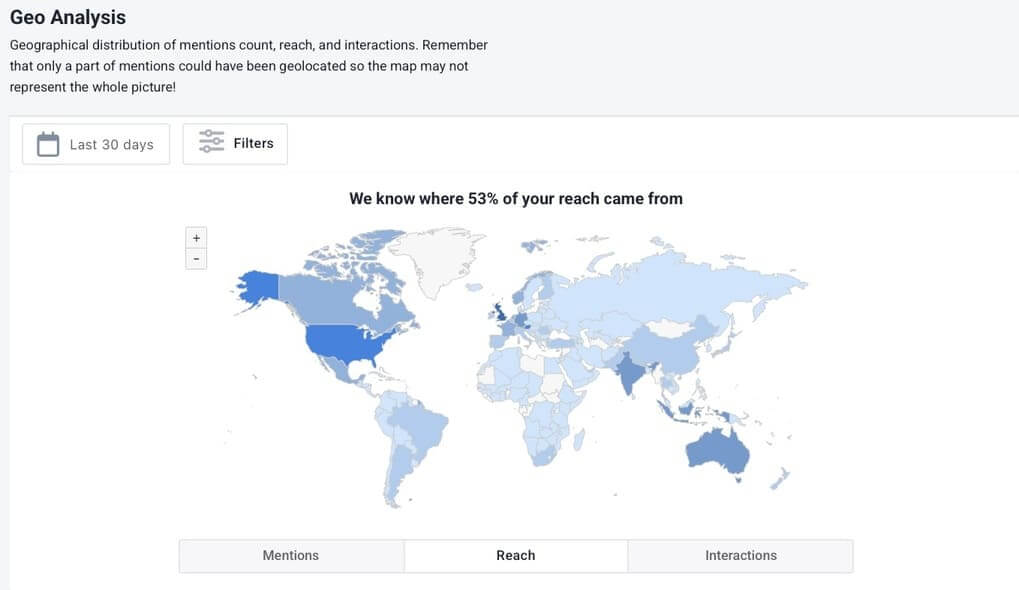
- Maps
04 Present campaign insights
Raw data isn’t helpful on its own.
You can have all the Facebook metrics before you and still wonder: “What does this mean for my Facebook page analytics?”
That’s exactly when it’s time to move beyond numbers and transform them into actionable insights.
For instance, let’s look at how the new Red Bull flavors for 2025, pink grapefruit and wild berries, are performing in terms of audience engagement and reach.
Take a look at the chart example: the orange color in the bar graph represents the emotion of admiration, while the blue color indicates disgust.
When you see orange starting to overtake blue, that’s a positive sign. Especially for newly launched products!
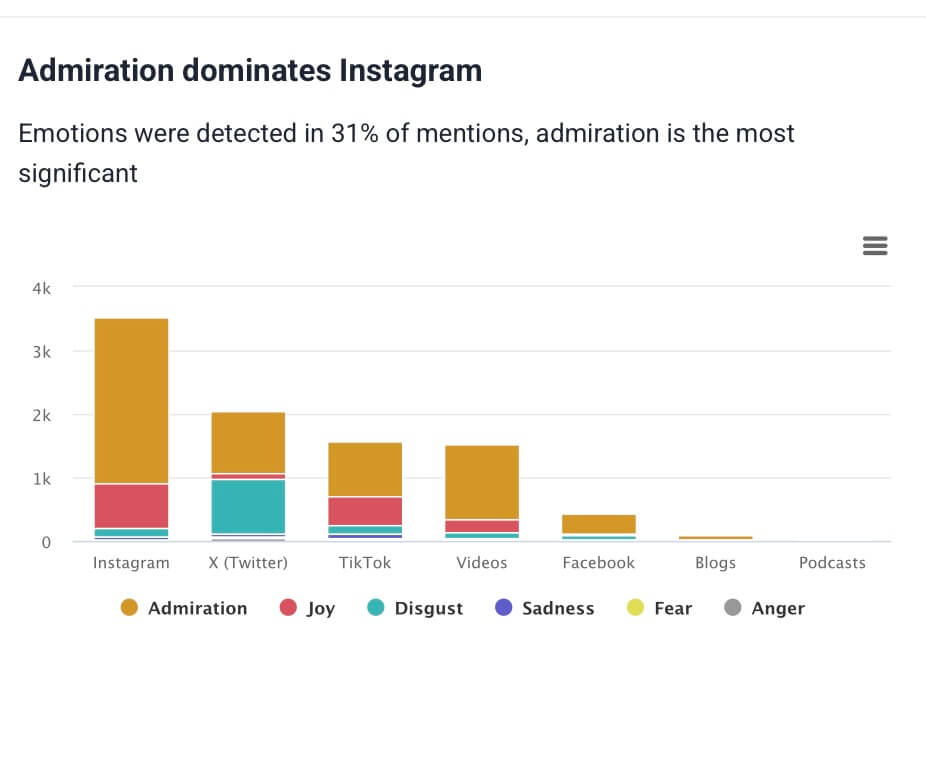
Analyzing those emotional mentions opens the door to deeper, actionable customer insights. It’s not just about numbers anymore.
It’s about understanding how people feel about your brand or new product and using positive and negative feedback to move forward smarter.
05 Compare data with previous periods
I do like to run.
And here’s the thing! If I didn’t track my times, distances, or progress week to week, how would I ever know if I was improving?
The same goes for Facebook page analytics.
Without gathering and analyzing your data over time, you’re running blind. You might feel like your content strategy and marketing campaigns are doing well. But the numbers will tell you the truth:
- Are your engagement rates growing?
- Did your new campaign outperform the last one?
- Is your Facebook page growing faster than your competitors?
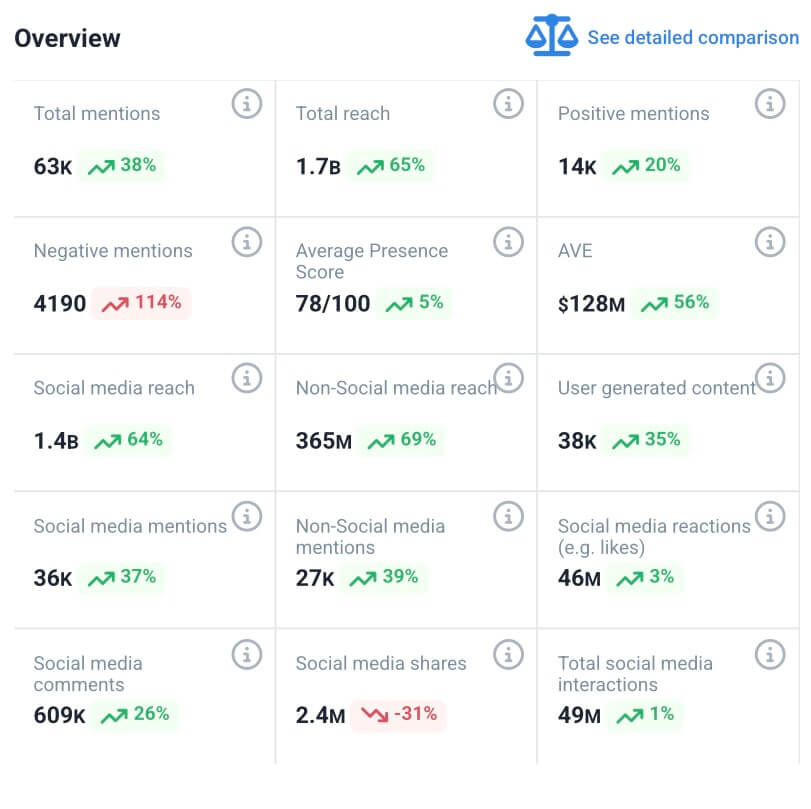
In Brand24, I can easily select a specific time period based on what I need. Whether it’s year-over-year, month-to-month, or week-to-week. This means I can quickly separate each phase of a Facebook ads campaign and compare them with just a few clicks.
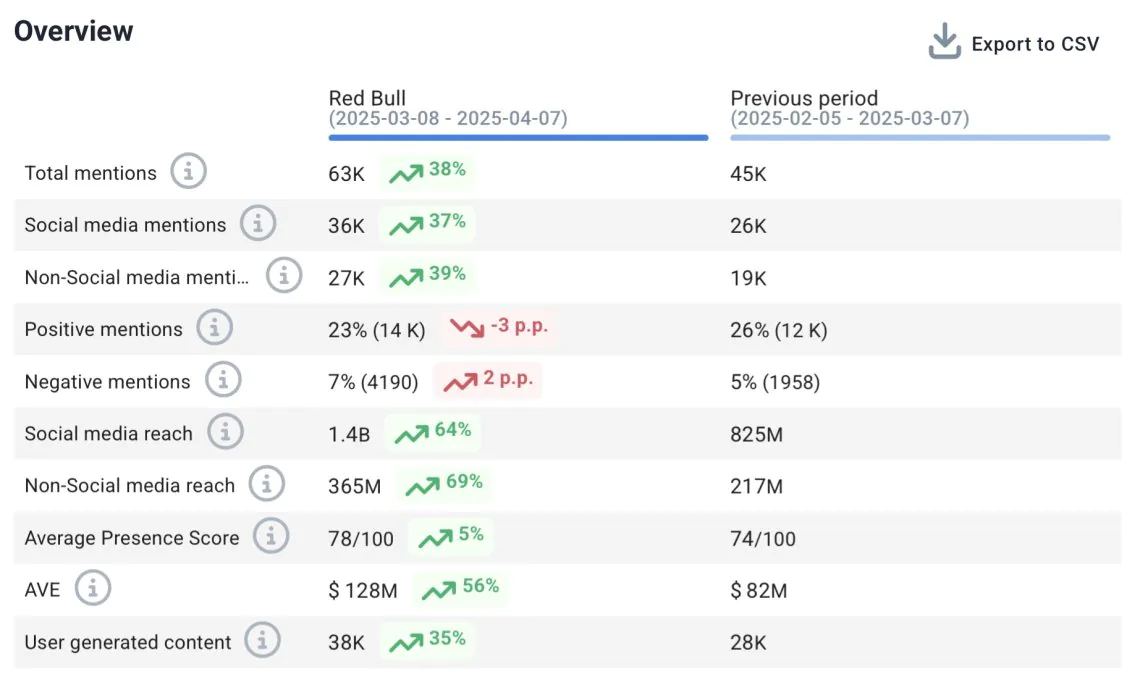
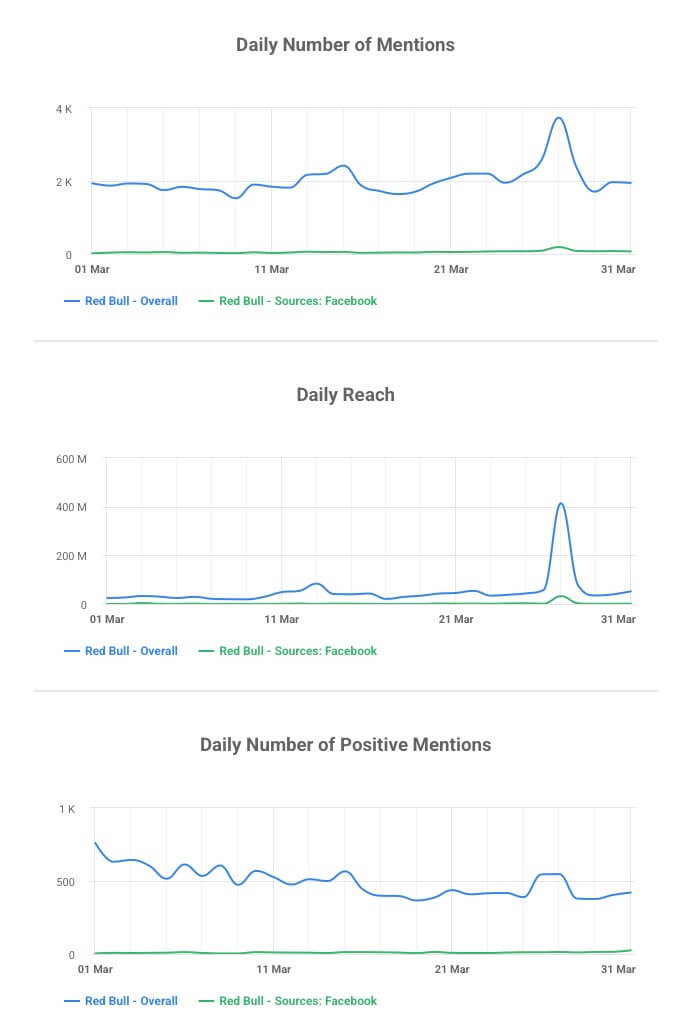
For example, I just checked Red Bull’s Facebook page analytics and compared its Facebook performance to the previous 30 days.
As you can see, it’s going quite well. Even if they notice a drop in positive and negative mentions, which may be a perfectly regular sign with such a big spike in the reach of the new campaign.
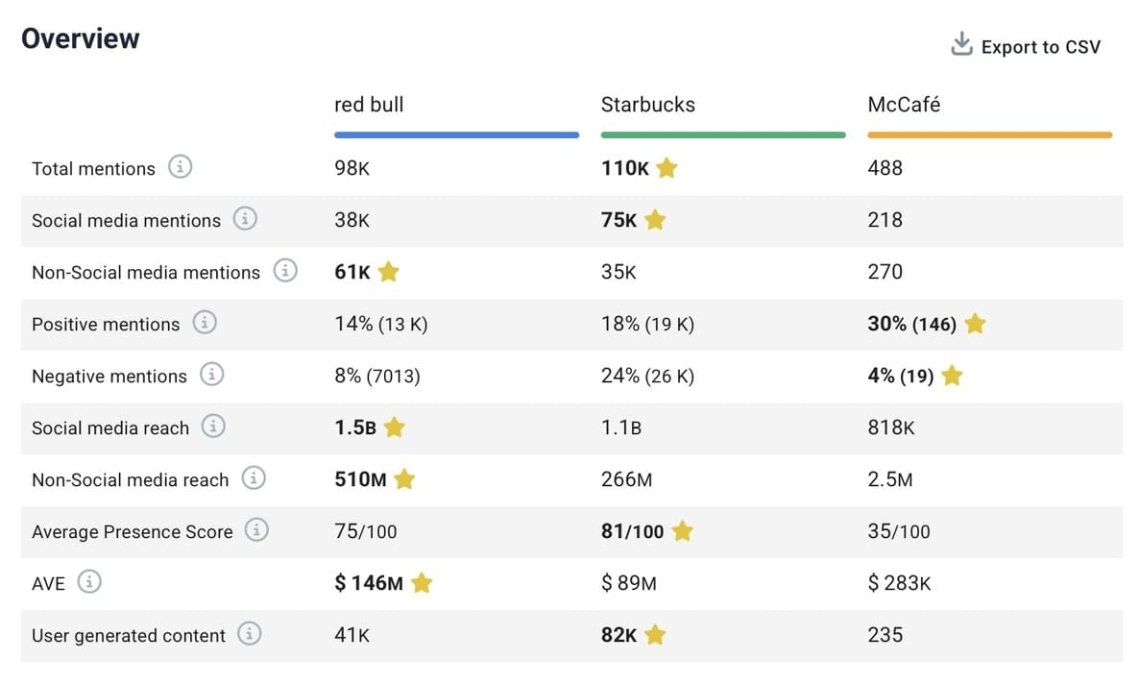
06 Compare data with rivals
It’s one thing to compare Facebook page performance over time—but it’s a whole new level when you compare it with your competitors.
Why? Because context is everything.
I might see my engagement growing in the monthly summary of my Facebook report. And feel like I’m doing great. But the truth is that if my competitor doubles their numbers in the same period.
I probably would have never realized without these features in my reporting tool.
Look here, how easy is that:
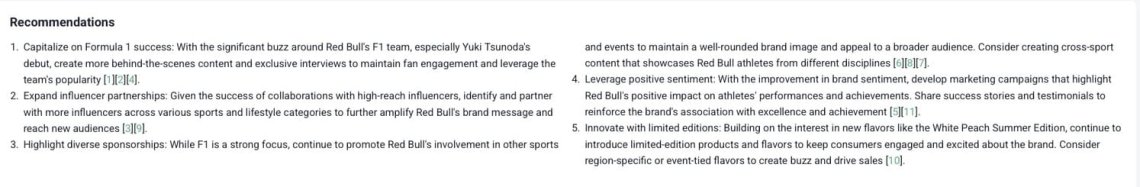
07 Include plans and recommendations
What’s the point of a Facebook report if it doesn’t lead anywhere?
Of course, it’s great to see what’s happening now on the Facebook page in numbers. But the real value comes from analyzing that data. Making practical conclusions and then using them for specific actions, shaping strategies.
A well-structured Facebook insights report template makes this process even smoother.
That’s where recommendations come in.
A strong report doesn’t just reflect the past—it shapes the future. It should help answer questions like:
- What should I continue doing?
- What needs to change?
- What’s the next best move?
You can use your own experience and knowledge to do this. But it is always best to double-check and get another opinion to ensure you don’t miss anything.
08 Add summary
These points might not seem obvious at first. But for me, it’s key to creating a Facebook analytics report that’s actually useful for everyone.
Always wrap up your report with a short, clear performance summary.
Why?
- When I’m skimming for key takeaways or jumping back into the report later, I can instantly find what matters most.
- It’s also super helpful for external teams or stakeholders who don’t need all the details but still need to understand the essentials.
When someone picks up your report, they should catch the key points quickly. Without reading the entire document.
What a Great Summary Should Include:
- A brief overview of performance: are you meeting goals, or is something off-track?
- The most important findings, trends, or patterns you’ve noticed
- Actionable recommendations based on the data and actionable insights
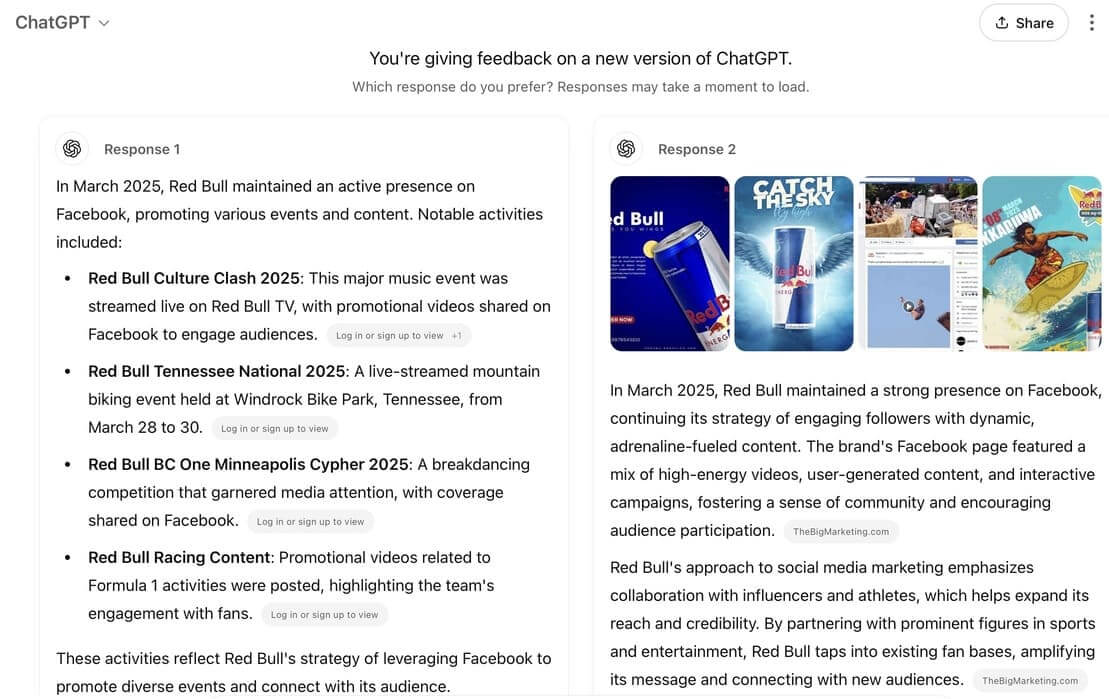
I’m pretty sure most people use ChatGPT or other available options. It’s also a good option. However, Pullnswers can be too general or not based on relevant data.
That’s where AI Brand Assistant shines.
Because it combines:
- The power of ChatGPT’s AI language capabilities
- With real-time, specific data from your Facebook page and other sources
This means you’re getting data-backed, tailored recommendations that actually fit your goals and your current results.
Check it out, here it’s a report generated by ChatGPT:
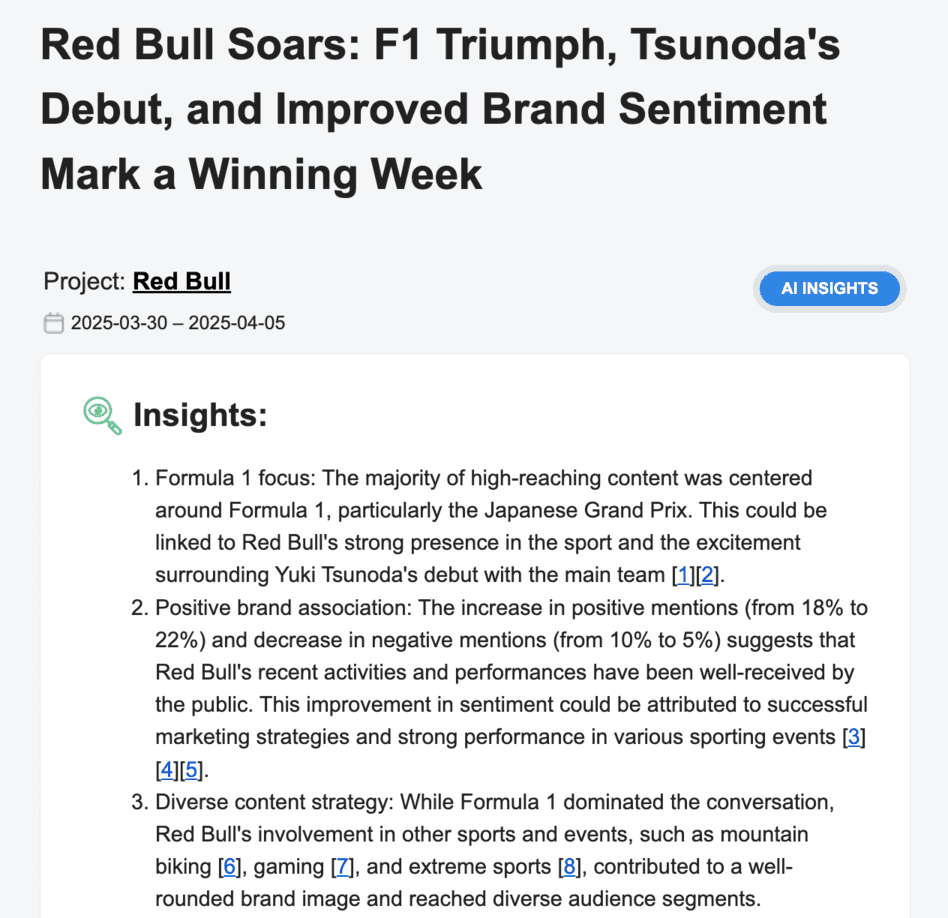
And here it is generated by Brand24:
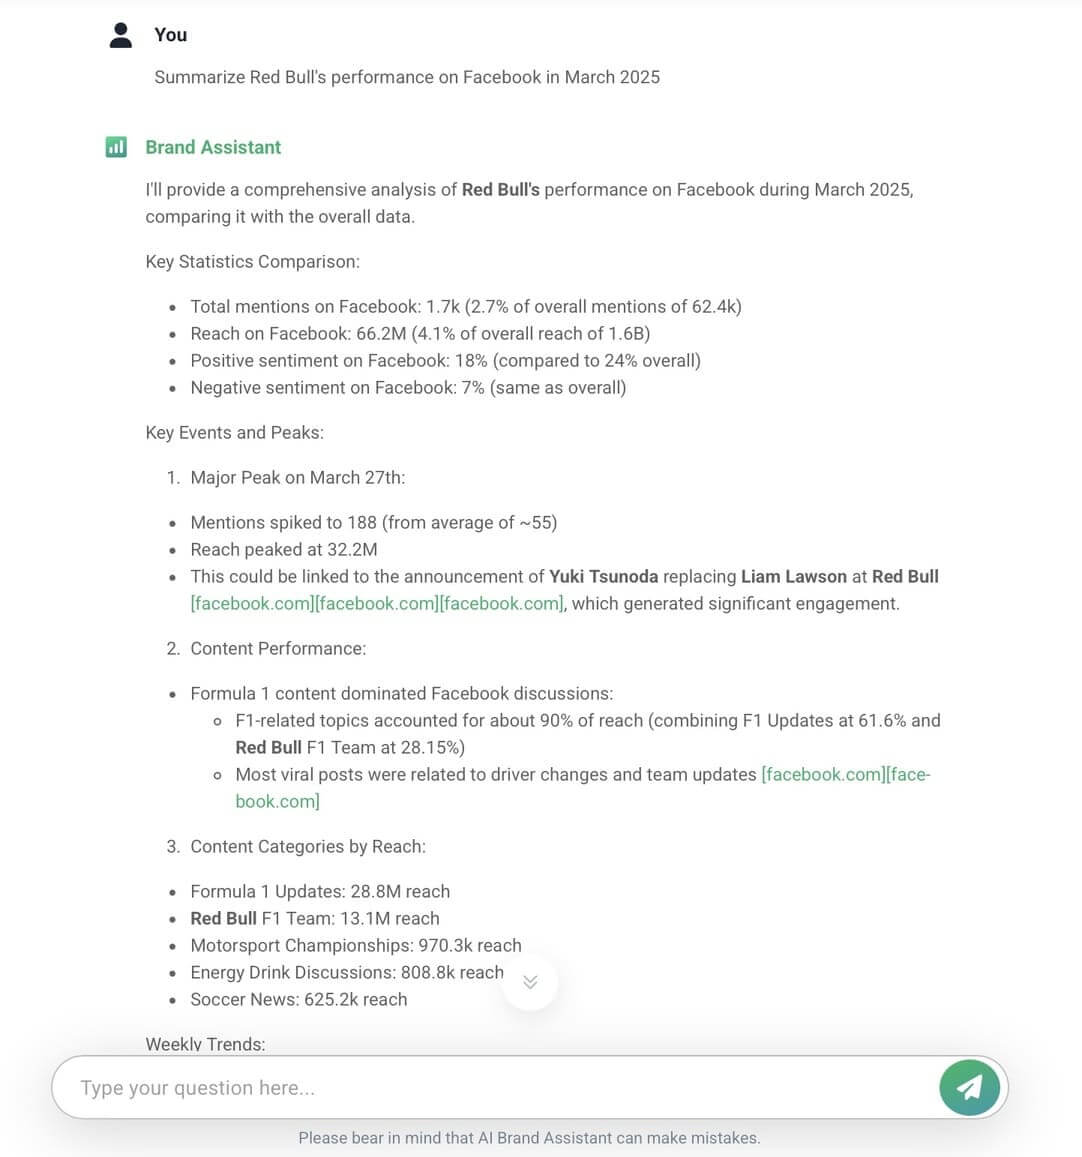
I found the most influential posts, key mentions, and a full sentiment analysis and trend breakdown around Red Bull.
Below that, there were helpful diagrams perfect for the Facebook analytics report:
09 Automate your reports
Many tools allow you to automate your reporting, and it’s a game-changer.
Reports are generated and sent automatically to my email on my chosen schedule.
This means you no longer have to worry about manually creating or sending reports. Simply set it and forget it—let the tool handle the rest!
Regular reporting is the key to spotting key Facebook insights, trends, and patterns on time.
Good practices in Facebook analytics report
Here are some tips to make your Facebook report like a pro!
01 Tailor the Report to Your Company’s Vibe
Every company has a unique tone and personality. Whether your brand is formal, friendly, or creative, ensure your Facebook report reflects that. You can use colors and fonts that align with your company’s style.
02 Customize Freely
Don’t feel restricted by templates! Customize your report layout and content to meet your specific needs. Select key metrics, visuals, and social media insights and adjust the structure to communicate your message best.
03 Keep It Simple
Less is often more.
Avoid overwhelming your audience with unnecessary data or too many complicated visuals.
04 Incorporate Data from Other Sources
Facebook data is valuable, but combining it with other social media data (platforms, Google Analytics, or sales data) through a business intelligence reporting tool can provide a fuller picture of your performance.
05 Choose the Best Format
Choose the best format for your audience’s needs. Do they prefer a PDF, Excel, an interactive dashboard, or PowerPoint presentation?
Make your report easy to access, share, and read using the best format for your team or stakeholders.
06 Little breaks
Make sure your audience has time to breathe and process all the data you’re sharing. A report packed with charts, numbers, and insights can quickly become overwhelming, even for the most data-savvy reader.
Add small pauses during the presentation, catchy headlines, or maybe even mems.

Conclusion
Creating a Facebook analytics report can be challenging. Especially if you’re still not using AI!
There are so many options out there. I’m pretty sure there’s one that fits you perfectly, making your Facebook analytics a fully automated process.
No more late nights, no more manual number crunching.
This is a game-changer if you’re in a marketing agency and spend your days creating single-client reports. You need fast access to the most relevant market insights. Flexible, easy-to-use Facebook insights report templates and clear performance data.
To make your report truly valuable, you need to:
- Select the right metrics that align with your report goal.
- Compare results over time or against competitors to have a reference point for assessing whether you are performing better.
- Include insights and recommendations based on the data for future improvements.
- Keep it clear and easy to digest by starting with a summary, adding graphs and other types of visualizations, and providing explanations where necessary.
Instead of doing everything alone, you can rely on AI analytics tools like Brand24. They can handle the entire process for you!

Article Reviewed by