Table of contents
2M Marketers

According to the Influencer Marketing Benchmark Report 2024, the influencer marketing industry will grow to about $24 BILLION by the end of this year! The money spent on influencer marketing speaks for itself; it’s one of the most important elements in the marketing strategy! You need to be able to measure the results of your influencer campaigns across different social media platforms. But what are the most crucial metrics and how to measure them? You’re about to find out in this article!
Tracking influencer marketing metrics gives many benefits. You get to know the preferences of your target audience, which can guide your content marketing strategy. Moreover, you can optimize your marketing campaigns and maximize your influencer marketing ROI.
Key influencer marketing metrics to track:
01 Audience engagement
According to the Influencer Marketing Benchmark Report 2024, audience engagement is the most common metric in more than 50% of influencer marketing campaigns.
It’s also one of the key performance indicators (KPIs) by which you can determine the preferences of your target audience.
You can see in black and white through the number of likes, comments, and shares of social media posts whether an influencer resonates with the audience.
If someone doesn’t like the influencer’s post, that person won’t leave a like. It’s obvious!
Certainly, when you note high engagement in a social media post, you will want to continue collaborating with the influencer. Changing your influencer marketing strategy might be worth doing if it’s the other way around.
High engagement may affect social media algorithms. For example, a TikTok video with many likes and comments will appear on the “for you” page.
How to measure?
There is a general formula to measure the Engagement Rate of influencer campaigns:
Engagement Rate [%] = total number of post interactions / follower count x 100
You can use this formula to calculate the Engagement Rate for one or many posts.
So let’s calculate the Engagement Rate of the energy drink brand CELSIUS’ influencer partnership with NFL player Mike Penix Jr.

We will consider only one post from this campaign – Instagram Reels (the one above).
Reel received 4543 likes and 20 comments, which gives 4563 interactions. The number of followers on Mike’s Instagram account (@themp9) is 100,000. So the Engagement Rate is 4.56% (4,563 / 100,000 x 100).
Nothing complicated!
But you don’t have to do it manually.
You can easily find free online calculators dedicated to specific social media platforms.
Hint: Don’t compare the campaign performance in terms of influencers from different groups. Always look at how big the influencer’s audience is. Micro-influencers usually gain a higher engagement than big accounts with millions of followers.
Track key influencer marketing metrics!
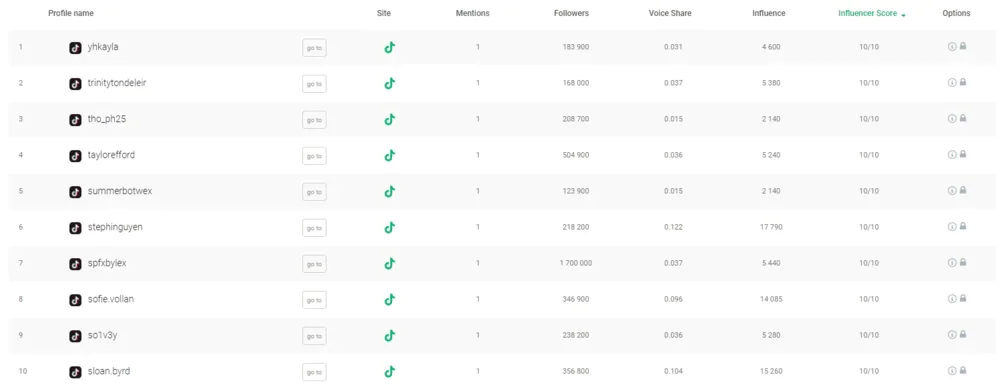
02 Influencer Score
Influencer Score helps quickly classify influencers for collaborations. It tells you whether a given person is a good fit for your campaign.
The higher the Influencer Score, the more popular the influencer is.
It’s up to you who you work with – a top influencer with a high Influencer Score or maybe someone less famous. The choice is yours!
How to measure?
I won’t bother you with unnecessary calculations. There are tools that measure this metric!
But I can tell you that the Influencer Score is calculated based on, among other things, the number of followers a creator has on a given social media channel and the influencer’s activity.
Influencer Score in Brand24 is expressed on a scale from 1 to 10, where 10 determines the most valuable creators.

03 Volume of mentions
This metric shows how many times your product or brand is mentioned.
The increase in the number of product or brand mentions after the new campaign launches can herald the influencer marketing success.
When people talk more about your brand on the Internet, it’s more likely to reach new potential customers and gain new followers on your channels.
How to measure?
Keep in mind that most media mentions do not appear on your marketing channels, and what’s more, they are not tagged either.
Therefore, a social media monitoring tool is necessary to measure this metric! Brand24 is a perfect example of such a tool.
It tracks mentions (even untagged ones!) from various online sources, not just social media.
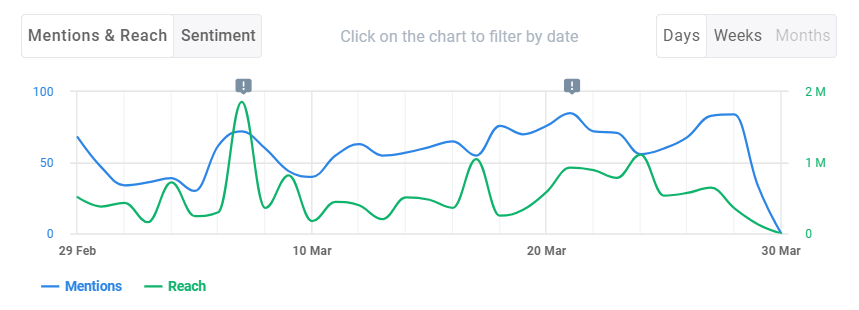
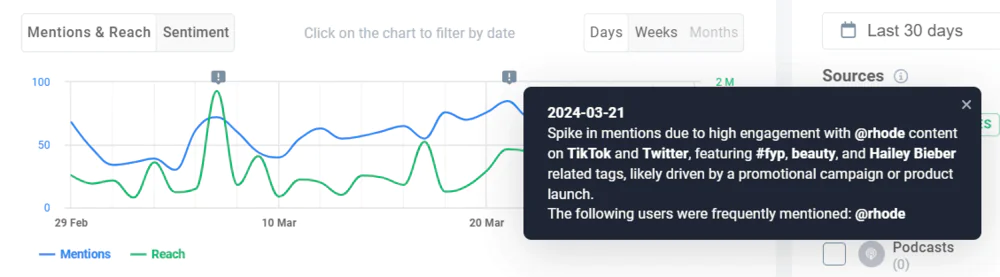
Brand24 also detects anomalies – what does it mean? It gives a concise explanation of the sudden increase in the number of mentions.
Track the volume of mentions!
04 Audience growth
This one of the key metrics shows the increase in the number of people who follow your brand account on social media.
It really matters when it comes to an influencer marketing campaign – it tells how many people start following you exactly over the campaign period.
If people start to follow your brand, it’s a good sign – they want to stay with you for longer!
Audience growth declined due to the influencer campaign? It’s time to change the strategy!
How to measure?
The following formula calculates the Audience Growth Rate:
Audience Growth Rate [%] = followers gained over the campaign period / the initial number of followers x 100
Imagine that your brand had 20,000 followers on Instagram at the beginning of March.
The campaign with Kendall Jenner lasted for the whole month, and as a result, your account grew to 60,000 followers. The Growth Rate is 200% (40,000 / 20,000 x 100).
WOW! Maybe you should think about a campaign with this influencer….
As you see, it’s a very simple metric for monitoring influencer campaigns. Simple enough that you don’t need any external tools… and you can save money to afford an influencer campaign with Kendall Jenner!
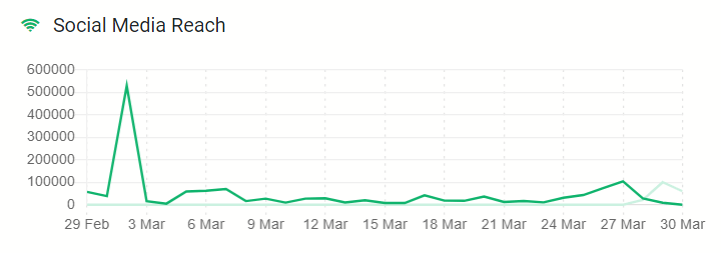
05 Social media reach
This metric presents the estimated number of people who saw influencer posts in cooperation with your brand.
It gives you an idea of how the influencer campaign spreads on socials.
Of course, the higher your social media reach, the better for you!
How to measure?
The only reliable way to measure it is to use a tool like Brand24.
Below is a graph of social media reach from the Brand24 dashboard. Look how simply and clearly it’s presented:
06 Website traffic
Another of the key metrics is website traffic. It tells how much the influencer encouraged potential customers to visit the brand’s website.
Many campaigns include tracked URLs and CTA encouraging the influencer’s followers to visit the brand’s website. Hence, website traffic is important for measuring the effectiveness of influencer campaigns.
How to measure?
To measure website traffic, it’s best to use Google Analytics (one of the top analytics tools).
Two good news! The first one: Google Analytics is free. The second: it allows you to measure traffic by its source.
So, you’ll easily see traffic from Instagram or a different social media platform where the campaign was run.
You can give an influencer URL with a specific UTM code attached, so Google Analytics can track how many people clicked it from the influencer’s recommendation.
You don’t have to configure anything; just pass the link to the influencer! You can use Bitly to create this kind of link.
07 Sentiment
Brand sentiment tracks whether the online conversations about your brand are positive, negative, or maybe neutral.
It’s a good complement to other key metrics, such as the volume of mentions and audience engagement.
Discovering the audience’s emotions allows you to assess whether the influencers selected for the campaign and the campaign itself are perceived well.
If the number of mentions with positive and neutral brand sentiment increases, it means that your brand awareness also increases.
But if there is a lot of negative sentiment, your marketing campaign might not be good.
How to measure?
Sentiment analysis must be done using a social listening tool, which is Brand24. It easily finds brand mentions and categorizes them.
All mentions are collected in one place as a page, but Brand24 also provides a line chart showing the sentiment of brand mentions over time.
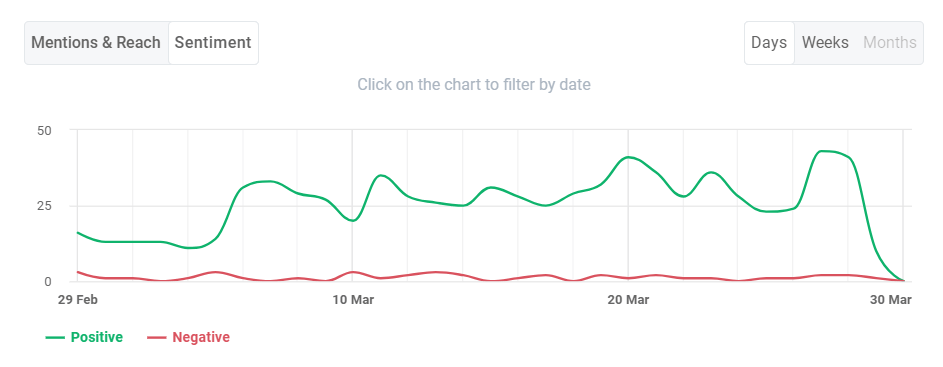
Analyze sentiment with Brand24!
08 Conversion
Conversion is the third most used metric in measuring influencer marketing success, according to the Influencer Marketing Benchmark Report 2024.
Conversion is successfully completing a specific goal. This goal, generally, is sales.
The most common conversion regarding influencer marketing is buying a product through a unique link or using promotional codes.
Influencers can share promo codes or unique trackable links with their followers as part of the campaign, as on the Instagram Story below.

How to measure?
There is a formula to calculate the Conversion Rate:
Conversion Rate [%] = total number of users who have completed a specific goal / the number of people exposed x 100
Assume that Cristiano Ronaldo, as part of a partnership with your brand, added an Insta Story with a link redirecting people to buy your product.
Within 24 hours, 600,500 people clicked the link, but only 20,000 bought your product using it. In this case, the Conversion Rate is 3.33% (20,000 / 600,500 x 100).
The conversion rate is tracked using analytics tools such as Google Analytics with the help of the above-mentioned links and codes.
09 Revenue
Revenue is important for calculating influencer marketing ROI (Return on Investment).
Thanks to measuring revenue, companies can estimate campaign ROI (Return on Investment) and determine which influencers cause positive ROI.
It’s also matters when it comes to influencer compensation.
How to measure?
Revenue generated due to influencer campaign (similarly to conversion) you can measure using:
- tools like Google Analytics
- direct sales on social media
- promotional codes

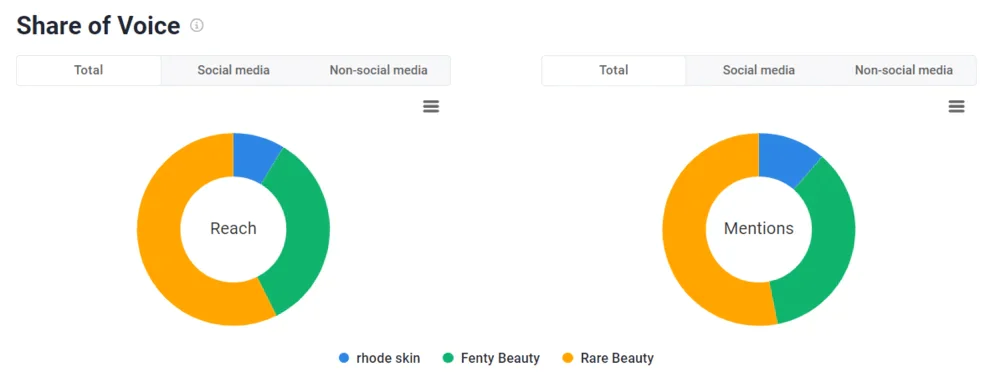
10 Share of Voice (SOV)
Share of Voice is a metric that helps understand what percentage of the conversations around a given topic is driven by your brand compared to your competitors.
How can SOV be useful in influencer marketing?
This metric shows the campaign’s effectiveness across the market both during and after its period.
How to measure?
Calculating the SOV manually is really a lot of work, but I’ll show you the formula anyway:
Share of Voice [%] = the total number of mentions of your brand / the total number of mentions of your competitors x 100
SOV can be measured for all social media mentions together or for each platform separately. I recommend the second option – this way, you can see which marketing channel works the best for your brand.
As you may realize, calculating SOV manually is quite complicated and time-consuming,
But okay, I will now move on to specific solutions – media monitoring tools. They collect and analyze relevant data and automatically calculate Share of Voice.
To check SOV in Brand24, all you have to do is set up a project for your brand and your competitors.
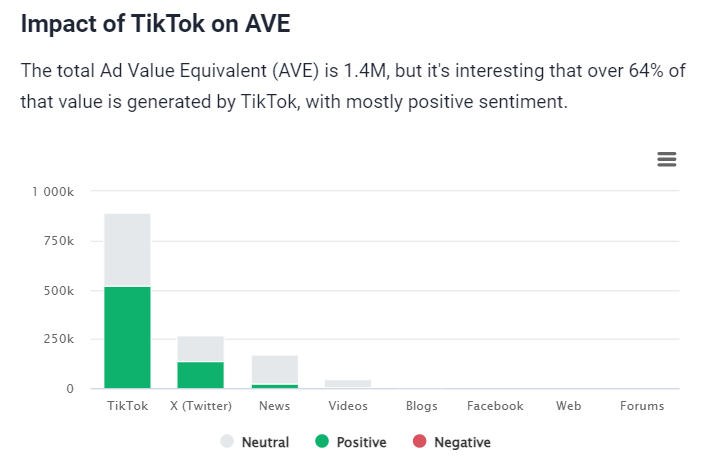
11 Advertising Value Equivalency (AVE)
Last but not least, I would like to present you with Advertising Value Equivalency (AVE).
AVE measures the value of media coverage of marketing campaigns. It’s expressed in U.S. dollars.
Basically, it shows how much money you would have to spend on paid advertising to get the number of online conversations you got from, among other things, an influencer campaign.
I know it sounds silly to you because the influencer campaign is, after all, a paid campaign.
But you do not pay for the effects of the campaign, that is precisely the number of mentions. That’s why AVE gives a very interesting overview of influencer marketing!
Combining AVE with other indicators is recommended to get a comprehensive picture of the effectiveness of influencer marketing strategies.
How to measure?
Of course, media monitoring tools will calculate the AVE for you!
But NOT EVERY tool offers AVE measurement, but fortunately, Brand24 does it!
Tip: Advanced tools can analyze metrics for you
Using an advanced tool is A MUST!
Tools like Brand24 will help you track influencer marketing success.
With Brand24 automatically collecting and analyzing all the data and giving you ready-to-use insights, you can greatly enhance your work and save time!
Instead of sitting in front of a computer and analyzing influencer marketing campaigns yourself, Brand24 will do it for you…. and you can use the saved time for an extra coffee break!
Also, another good news: purchasing this tool will not strain your marketing budget.
Wanna try Brand24 for free?
One of Brand24’s most powerful features is Metrics Analysis. As the feature’s name says, it analyzes the most relevant metrics. You can find them collected in one place together with valuable insights.
Everything is presented in a very simple and clear way. Even non-marketers, inexperienced marketers, and people outside the company will understand it!
Below, I will show you exactly what this AI-powered feature provides!
First of all, in Metrics Analysis, you have a neat summary of the project you are monitoring.
What is included in the summary?
This is simply a brief description of all metrics. You will find there information such as the number of collected mentions, the source from which most of them come, sentiment analysis highlights, and much more!
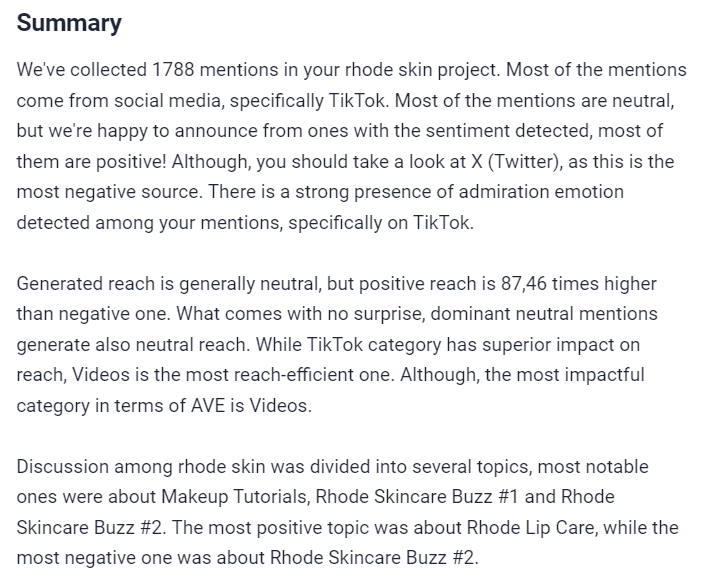
Of course, Brand24 analyzes positive, negative, and neutral mentions (I’ve mentioned this before), but it also automatically detects which source generates the most negative sentiment!
Brand24 works like emotion detection software – it detects not only sentiment but also emotions.
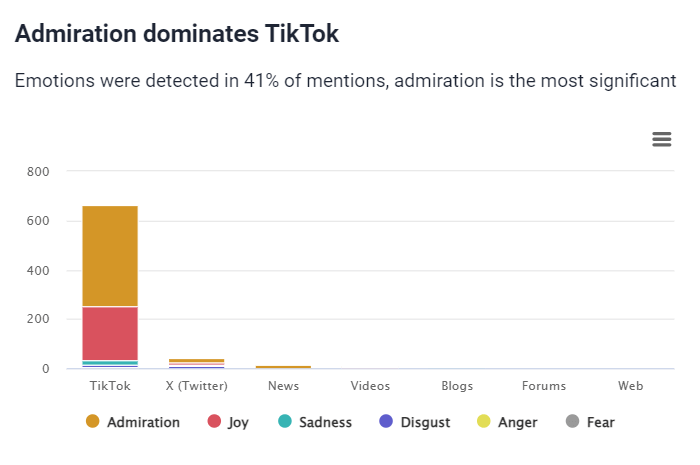
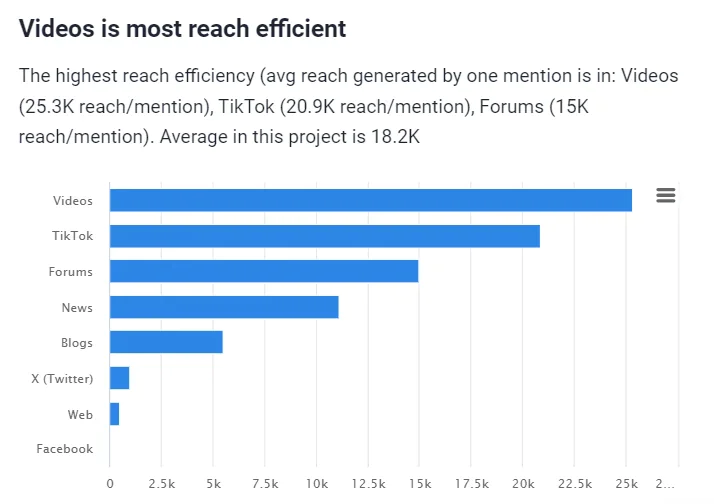
Another thing that you can find in Metrics Analysis is the reach efficiency. It presents the average reach generated by one mention in every source.
Track influencer marketing metrics and receive valuable insights!
Conclusion
Tracking influencer marketing metrics is a piece of cake only if you know what and how to do it!
You need a tool for that!
The well-chosen tool will not only hand data and analysis to you on a silver platter but also provide comprehensive insights.
This will save your valuable time, and you can make more effective decisions faster!
Final thoughts:
- Every brand should invest in influencer marketing. It impacts your business success!
- The main influencer marketing goals are to generate sales and increase brand awareness.
- The right influencer marketing metrics will show you how effective your campaigns are.
- Which of the mentioned metrics will be the most important for you? It depends on your campaign goals!
Not sure which tool you should use to track your future campaigns and influencer collaborations? Try Brand24 for free!