Table of contents
2M Marketers

With over 1.3 billion active users, of whom 90% follow at least one business, Instagram is a place to be for marketers. But success isn’t just about reaching a wide audience. It’s about engaging them effectively. This is where the important metrics come into play. So, ready to improve your Instagram presence?
Focusing on the right Instagram metrics is crucial to improving Instagram’s strategy in 2024. Keeping track of key metrics allows you to tailor your content to your target audience, boost engagement, and increase the number of followers. You should start by understanding metrics like follower growth rate, social media reach, and sentiment analysis if you want to build a strong Instagram presence.
In this guide, I’ll explore the most crucial Instagram metrics you need to track.
Plus, I’ll show you how you can use this data to gain insights, enhance your Instagram marketing campaigns, and finally drive engagement. Let’s dive in!
Instagram metrics to track:
01 Follower Growth Rate
The follower growth rate is about tracking how fast your Instagram community is growing.
It’s important because it shows your account’s popularity and indicates if your content strategy is working to attract new followers.
How to measure?
To calculate the growth rate, note the number of new followers over a specific period and divide it by the total number of followers, then multiply by 100.
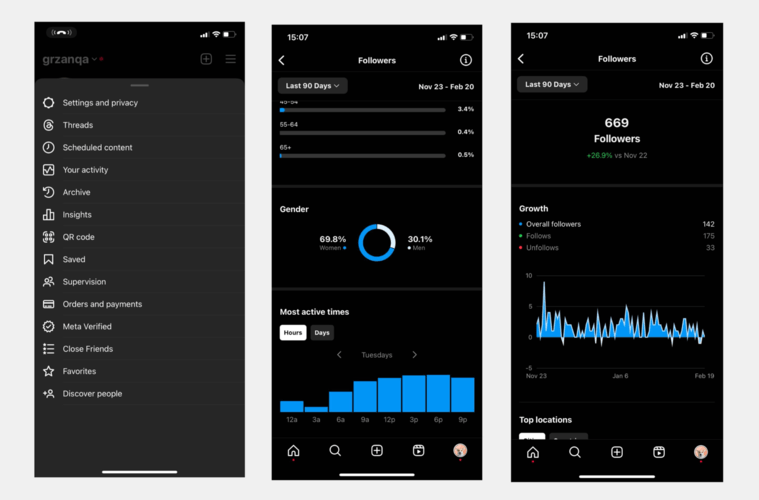
Instagram Insights gives you this information directly and shows how your follower count changes over time.
02 The volume of mentions
The volume of mentions is a very important Instagram metric. It tracks how many times your brand is mentioned across the platform.
This data is crucial because it shows directly how popular and visible your brand is online. The more mentions you have, the better (usually).
If managed well – Instagram mentions can lead to an increased number of followers, customers, and, ultimately, a bigger social media presence.
How to measure?
You can find mentions in your Instagram account. The ones added with “@” will appear in your notification list.
However, measuring them manually can be time-consuming and create room for errors. Plus, you get to see just the ones added tagged (as clickable links with the “@” symbol). And believe me, there are many more to find.
Lucky us, there are tools that work wonders for tracking mentions.
They can catch mentions of your brand from all over the internet (also those not tagged directly).
Take a look at the picture below. This is an untagged mention detected by Brand24:

Such a tool gives you real-time feedback about what people think of your brand. That’s how you can quickly jump into conversations, manage your reputation, and build stronger relationships with your target audience.
03 Engagement Rate
The Instagram engagement rate measures how much your audience interacts with your stories, posts, and Instagram reels through likes, comments, shares, and saves.
This rate is super important because it shows whether people see your content and if they like it enough to engage with it.
A high engagement rate usually means your content resonates well with your target audience.
How to measure?
To calculate your engagement rate, you can use the formula: (Total engagement / Total followers) x 100.
Imagine you’ve added a new Instagram post. Your content ends up getting 100 likes, and it reaches 800 people. To calculate the engagement rate for it, you would take the total number of likes (100) and divide it by the reach (800), then multiply by 100.
So, in this case, your post engagement rate would be 12.5% (100/800×100).
04 Social media reach
Reach on Instagram is all about counting the number of unique accounts (Instagram users) who see your posts, Instagram stories, or reels.
It is one of the most important Instagram metrics as it shows you how far and wide your content is spreading. The more people you reach, the more chances you have to make new followers and get your message out there.
But, remember – it’s a different thing than impressions.
Impressions measure the exact number of interactions with your content. So, if the same person sees your post three times – Instagram will count it as three impressions.
However, each user is only counted once in reach. That’s why it is a far more accurate way to measure how many people have seen your content.
How to measure?
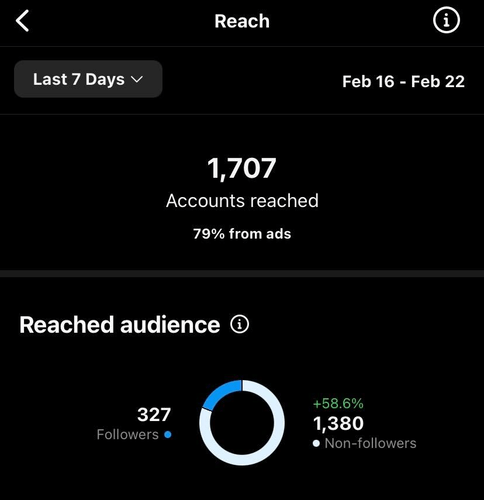
Measuring your reach is pretty easy, but only if you have an Instagram business profile. Just tap on your profile, hit the menu (those three lines in the top corner), and then tap on ‘Insights.’
This is where Instagram Insights (an internal Instagram analytics tool) appears and shows you all the numbers, including how many different people have seen your stuff.
If you want to get more details, you can use apps like Brand24, Hootsuite, or Sprout Social. These give you extra data, like keeping track of how your reach changes over time.
Some of the advanced social listening tools provide AI features that can help you understand all these numbers.
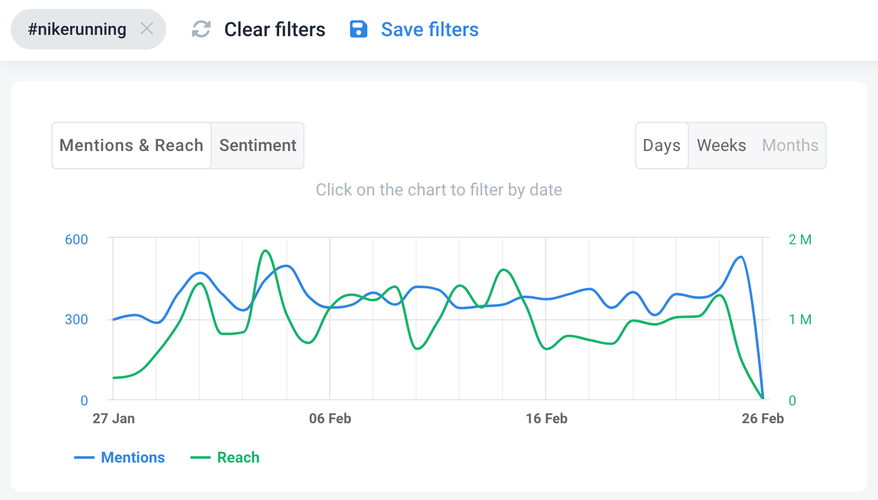
For example, Brand24 monitors changes in your reach over time and gives you AI-based insights into what exactly made your community grow.
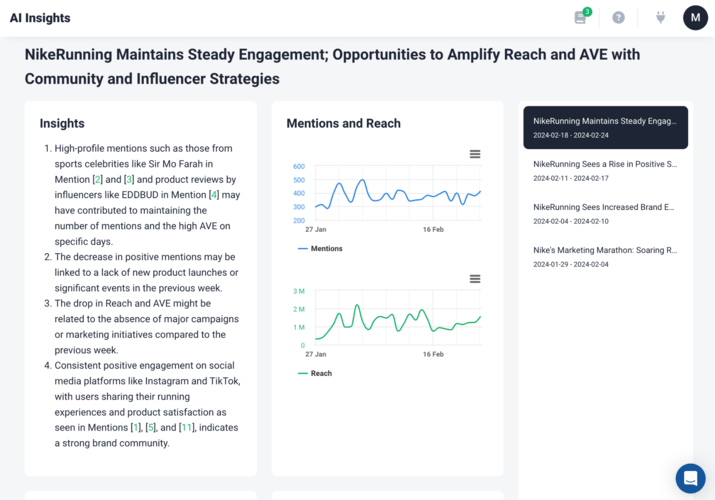
Advanced monitoring tools can provide more in-depth analysis, showing how your reach fluctuates and helping you understand your audience better.
Brand24 collects data not just from Instagram, but from across the web, giving you a broader understanding of your content’s visibility.
This tool gives you valuable insights into how far your content is reaching beyond your immediate Instagram followers, helping you strategize better for wider audience engagement.
Other data sources of Brand24 include:
- Social media platforms such as TikTok, Instagram, LinkedIn, YouTube, Facebook, Reddit, Quora, Telegram, and Twitch
- Review sites such as TripAdvisor, Yelp, Booking, App Store, Google Play, Trustpilot
- Blogs
- Video platforms
- Podcasts
- Discussion forums
- Newsletters
- Online news sources
- Other publicly available sources
05 Hashtag Performance
Hashtag performance measures how well your hashtags are doing in terms of bringing visibility to your Instagram posts. Tracking this helps you understand which hashtags are most effective in reaching a wider audience.
Instagram has started to act like a search engine. People are looking for information there instead of on Google or other places. Instagram users navigate the platform and search for relevant information using hashtags.
Therefore, you should look at your hashtags as keywords. They are a way to be the first profile that appears in front of their face after a query.
How to measure?
You can monitor hashtag performance through Instagram analytics tools.
They tell you the number of engagements (like likes, comments, and saves) hashtag-driven views generate. You may also use a hashtag tracker that will monitor your keywords reach and how its visibility changes over time. Plus, it can analyze the emotions associated with it.
This means you can see both how many people find your content with hashtags and how they feel about it.
06 Profile Analytics
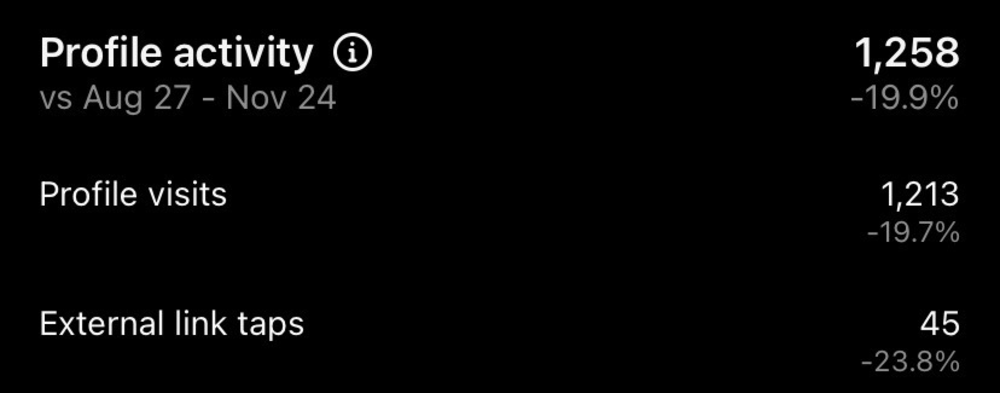
Profile analytics provide a simple overview of how your overall Instagram account is performing.
This includes Instagram profile views, website clicks, and call-to-action button clicks. These general stats are valuable for understanding how your content drives traffic to your Instagram profile and converts it into actions (sales).
How to measure?
You can find a general overview of your business/creator account in the “Instagram Insights” section.
This overview includes metrics like:
- The most engaging post types (posts, stories, videos, reels)
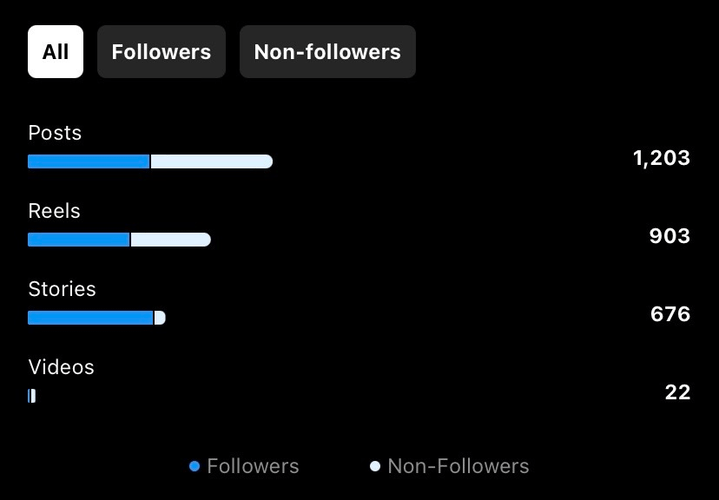
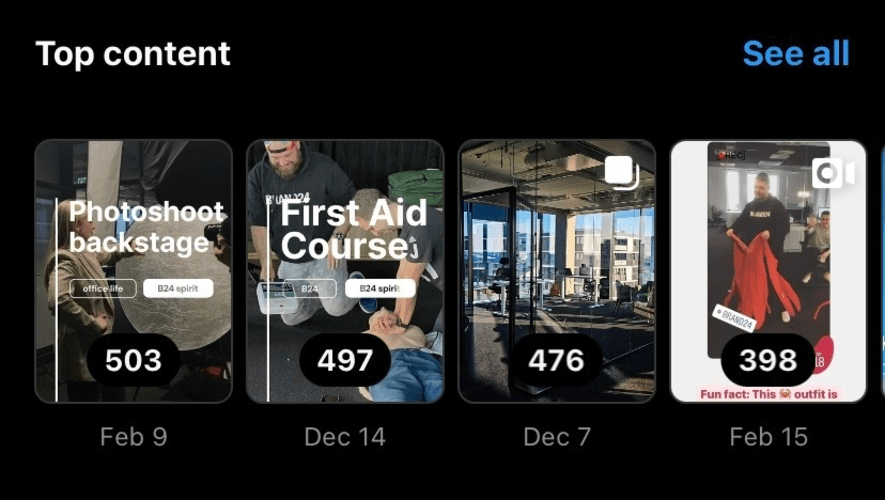
- The best-performing content
- Number of external links taps
Understanding and leveraging these data can significantly boost your account performance.
07 Sentiment Analysis
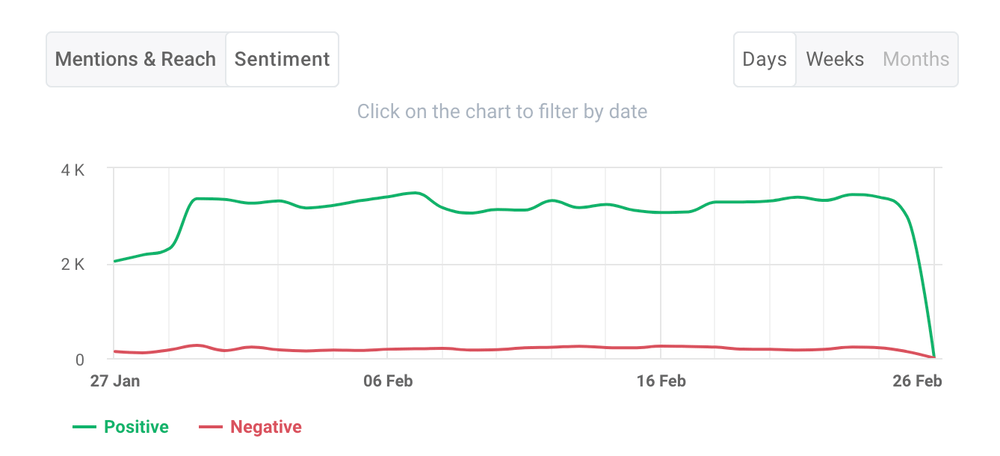
Sentiment analysis tracks the mood of the conversations about your brand – whether they’re positive, negative, or neutral. This is key information for understanding public perception and managing your brand’s reputation.
How to measure?
Instagram analytics tools like Brand24 are essential for sentiment analysis. They scan comments and mentions across various platforms, categorizing them into positive, negative, or neutral sentiments.
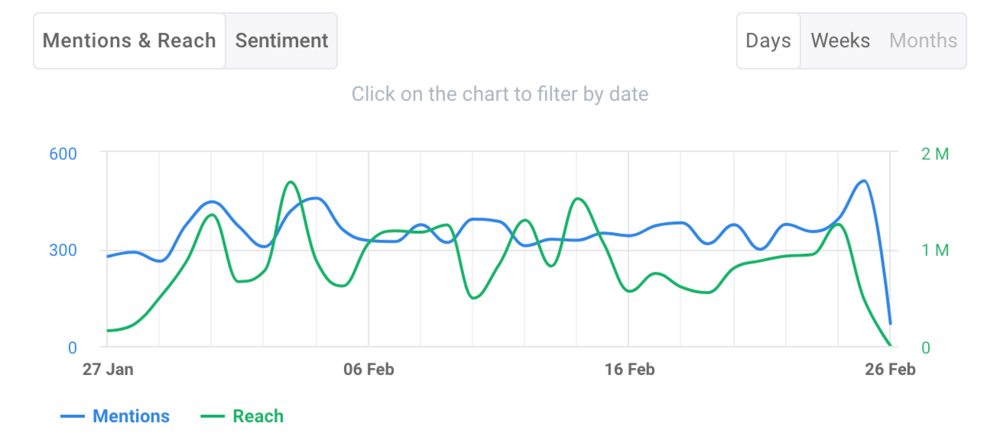
What you work on are ready-to-use, pre-analysed charts and reports, like the one below:
For more insights, see our guide on Instagram Social Listening
08 Taps Forward/Back
Instagram stories are used by over 500 million accounts daily. Not to mention, 58% of users say they are more interested in a brand after seeing them on Instagram stories.
So, this is not a feature you want to miss out on! Especially if you focus on Instagram engagement.
Taps forward/back are one of the most important engagement metrics. They track how users interact with your Instagram stories, specifically how many tap forward (skip) or tap back (rewatch) on your stories. You can also check how many people exited your story.
It’s a direct indicator of how engaging your stories are.
How to measure?
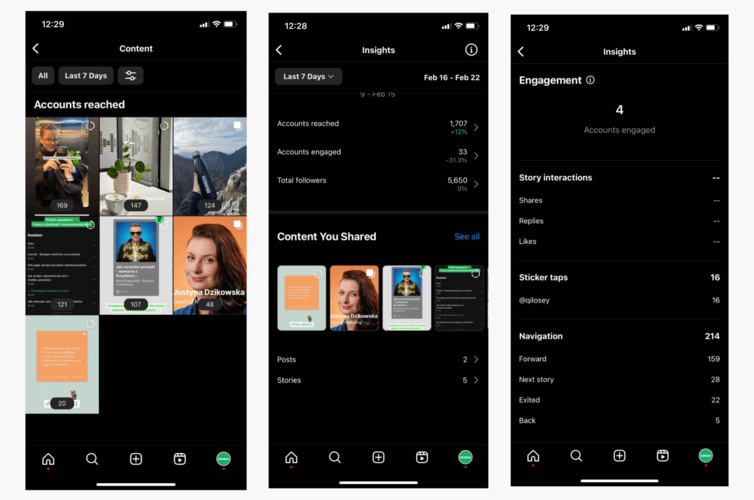
Instagram provides this data in your Instagram account insights, under the ‘Content’ tab, where you can see the stats for each story.
If many viewers are leaving your story early or quickly skipping to the next one, it’s a sign that your content might not be holding their attention. However, if you notice viewers tapping back to rewatch a part of your story, it indicates they found something interesting or valuable that they wanted to see again.
Stories that get a lot of these repeat views are great candidates for saving to your Instagram Story highlights.
These Instagram metrics help understand what type of content keeps viewers engaged and improve your further social media efforts.
09 Reels Watch
The watch rate measures how many people watch your Instagram Reels from start to finish. It basically tracks how many people watch your video from start to finish without quitting halfway.
A high watch rate indicates that your Reels are captivating enough to hold the audience’s attention.
How to measure?
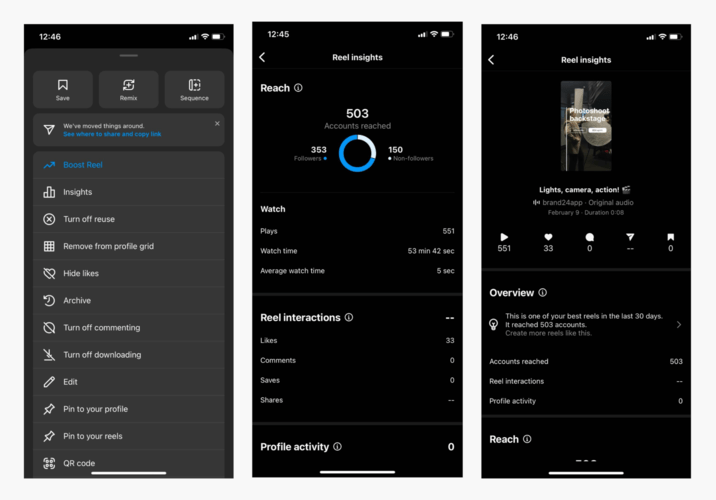
You can find Instagram Reels metrics after clicking the top right corner three dots and “Insights”. It will show you the percentage of viewers who watched your video, average watch time, and interactions. These can help you understand (and repeat) the success of your Reel content and improve your Instagram marketing strategy.
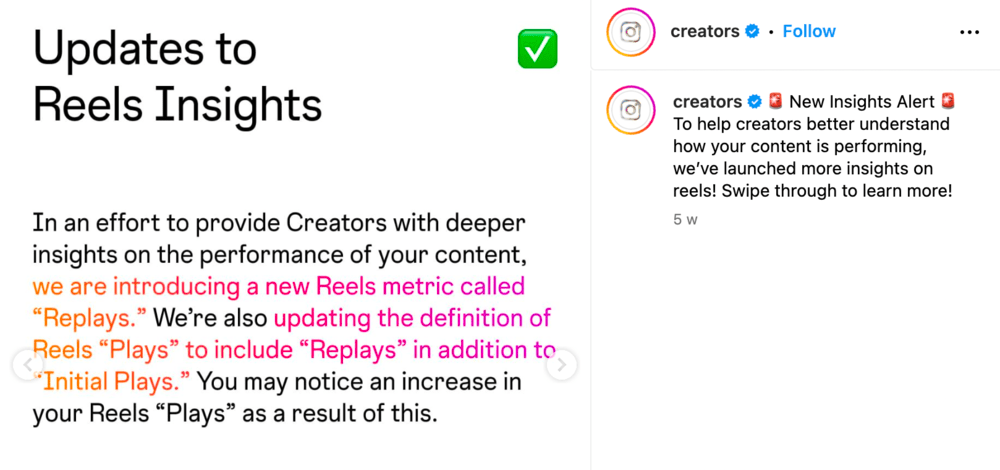
10 Reels Plays
Instagram announced adding some new metrics to track Reels performance. These include:
- Plays: This number ticks up every single time someone watches your Reel.
- Initial Plays: This one’s all about first impressions. It counts how many times people have watched your Reel for the first time.
- Replays: Ever wonder if people love your Reel so much they watch it again? That’s what ‘Replays’ track. Every time someone hits play on your Reel for the second time (or more), this number goes up.
Now, why are these metrics important?
‘Plays’ give you the big picture of your Reel’s reach. ‘Initial Plays’ help you understand how good you are at grabbing new viewers’ attention. And ‘Replays’? They’re your clue to how engaging and rewatchable your content is. If lots of people are replaying your Reel, it’s a sign that they find it really entertaining or valuable.
These metrics together can help you tailor your content strategy. High ‘Plays’ but low ‘Replays’? Maybe it’s time to add more elements that encourage viewers to watch again.
11 Best performing Reel
Instagram performance metrics can be hard to follow and very dynamic. That’s why the platform will now let you know about your best-performing reels so you can adjust your strategy and easily create content that resonates with your audience.
12 Accounts engaged
The “Accounts Engaged” metric on Instagram shows you who’s a real lover of your content.
It gives you audience demographics like where these people are from, how old they are, and whether they’re mostly females. Plus, it shows you how it changed over a specific period of time.
And it’s not just your followers. These stats include anyone who interacts the most with your posts.
It’s an easy way to track performance and understand your audience better!
Read more: Check best Instagram tools.
Tip: Advanced tools can analyze metrics for you
Diving into data can be time-consuming, but thankfully, some tools do the heavy lifting for you. For instance, Brand24 gathers your Instagram data, analyzes it, and presents conclusions, saving you from the hassle of manual analysis.
The Metrics Analysis tab in Brand24 is a real game changer. It neatly summarizes your project data, offering a clear and concise overview of your Instagram performance.
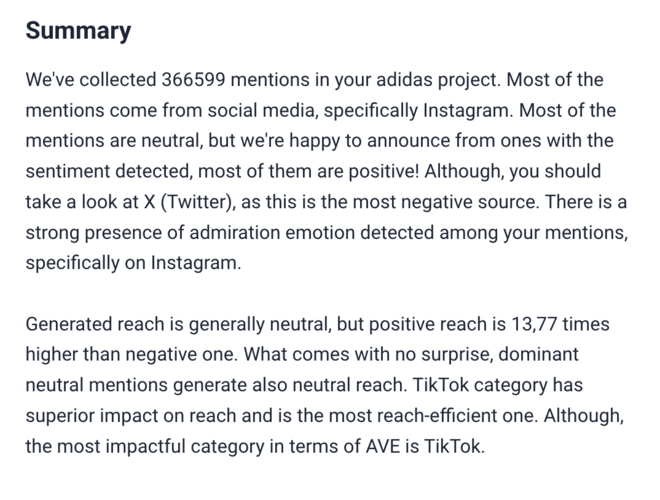
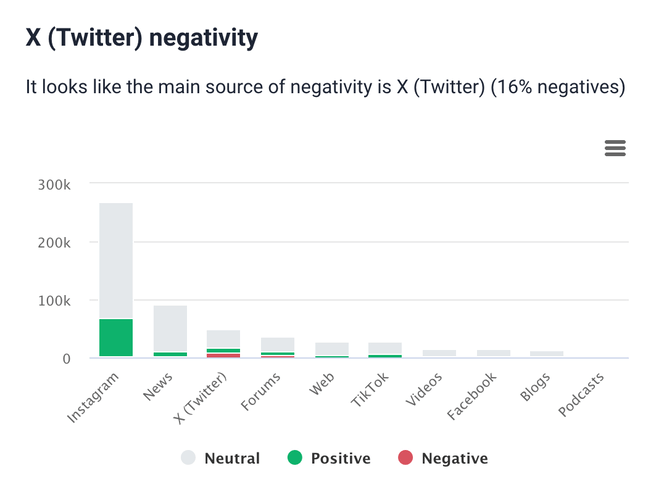
Brand24’s analytics go beyond basic numbers. It delves into the sentiment behind your social mentions, categorizing them as positive, negative, or neutral.
This feature is particularly helpful as it automatically detects which sources generate the most negative sentiment, helping you pinpoint areas that might need attention or improvement.
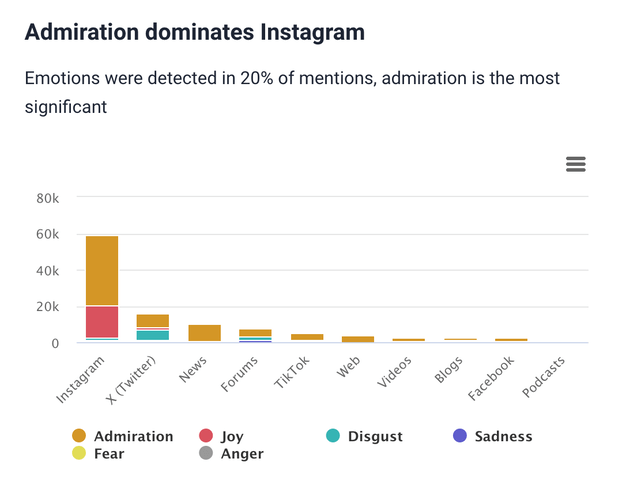
Plus, the tool is smart enough to detect exact emotions, giving you a deeper understanding of how your audience really feels about your content.
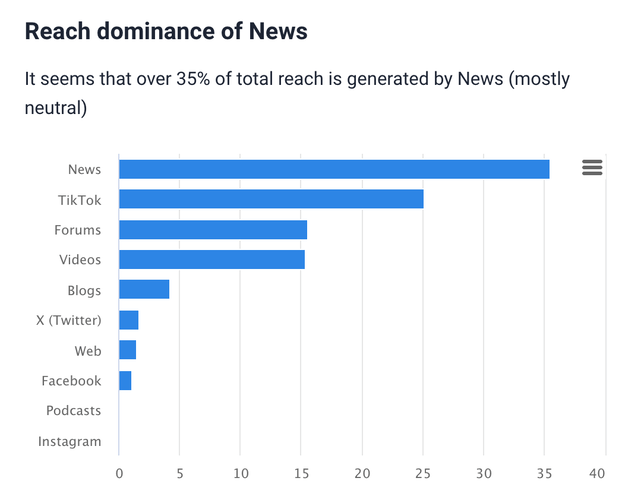
Another standout feature of Brand24 is its ability to assess which sources are the most reach-efficient. This means you can easily see where your efforts are having the biggest impact, helping you to optimize your strategy for maximum effectiveness.
Conclusion
And that’s it! A complete list of the most important Instagram metrics to track in 2024.
The truth is there’s quite a lot of them, and it’s best if you know them all. Advanced analytics tools can make this job easier, so consider including them in your marketing strategy.
Key takeaways:
- The core of a successful Instagram presence is knowing who your audience is and what they like. Metrics that provide insights into your audience’s preferences and behaviors are invaluable.
- Content engagement is king! Whether it’s through likes, comments, shares, or story interactions, engagement metrics are the heartbeat of your Instagram strategy.
- Metrics that track follower growth and social media reach are critical indicators of your strategy’s effectiveness. Growing numbers here mean you’re reaching more people and striking the right chord with your content.
Remember, the goal isn’t just to gather data but to use these insights to craft more engaging content, build your community, and strengthen your brand’s presence on Instagram.
Ready to boost your Instagram strategy? Start Brand24 trial!