Table of contents
2M Marketers

Do you want to master the art of product performance? Think of Steve Jobs, a legend who understood the pulse of his audience and crafted products that weren’t just devices. His products became experiences. Just like Jobs, you can transform your product into a market leader by leveraging the power of data. But where do you start? Read on!
Product performance is about how well a product does its job and pleases its users. This includes checking the product’s quality, reliability, and effectiveness in delivering the desired results.
What is product performance?
Product performance analytics is the process of using data to analyze how well a product meets its goals and satisfies customer needs. It helps you examine every part of your customer’s experience, from initial discovery to loyalty.
Why is this important? In a crowded marketplace, the brands that genuinely comprehend and utilize their data stand out.
But it’s not just about gathering data; it’s about using it wisely.
Product performance analytics provides insights to pinpoint where your strategies succeed and where they need work.
Measuring product performance is necessary to:
- Know how customers interact with the product.
- Learn which features are used most and which may need redesign.
- Analyze sales trends and customer retention.
- Increase customer satisfaction.
- Improve the customer journey.
- Do the marketing funnel analysis.
How to measure product performance?
Understanding how well a product performs is a detailed process that requires time, effort, and strategic thinking. But it will provide actionable insights that can impact your long-term success.
Where to start? Define your goals.
These can vary widely and may involve different aspects of your business. Here are some examples to show the different possibilities:
- Increase the number of purchases.
- Enhance the user experience.
- Improve conversion rates through a viral marketing campaign and personalized offers.
- Reduce the abandonment rate by identifying and addressing issues in the product.
To measure it accurately, you need to focus on key product performance KPI (KPPIs) that provide a full-picture view of your product’s market success.
To measure product performance, you need to track the following key metrics:
01 Customer Satisfaction Score (CSAT)
Ever wonder how happy your customers are?
The Customer Satisfaction Score (CSAT) tells you exactly that. It’s a simple score that shows customers’ satisfaction with your product.
A high CSAT means you’re doing great, while low scores show areas for improvement.
Product performance is about how well a product does its job and pleases its users. This includes checking the product’s quality, reliability, and effectiveness in delivering the desired results.
Listen to this feedback – it’s your direct line to customer happiness and your business success.
02 Churn Rate
The churn rate shows how many customers stop using your product over a specific period.
A high churn rate is a red flag that something’s wrong.
It could be the price, it could be the user journey, or maybe there’s a competitor they prefer. Understanding churn helps you keep more customers in the long run.
03 Customer Retention Rate
The customer retention rate indicates the percentage of customers who make repeat purchases.
High retention means customers love your product and keep coming back.
It’s a positive sign that your product meets their needs and your service meets their expectations.
04 Feature & Product usage
Feature usage metrics reveal which aspects of your product engage users the most and which are the poorest-performing products or features.
Understanding feature usage helps:
- Tailor your product to meet customer needs
- Enhancing user engagement
- Boosting conversion rates and product sales revenue
05 Average Revenue Per User (ARPU)
ARPU is a vital product performance metric, showing the average dollar value each customer contributes to your revenue.
This metric is key to understanding your product’s overall revenue performance. It can also impact decisions on pricing, marketing strategies, and product enhancements.
A high ARPU indicates that your strategies maximize revenue from each user.
At the same time, a low ARPU indicates potential gaps in your product sales strategy, suggesting untapped opportunities to boost revenue generated per customer.
Understanding this metric is invaluable if you want to increase the total dollar value generated per customer.
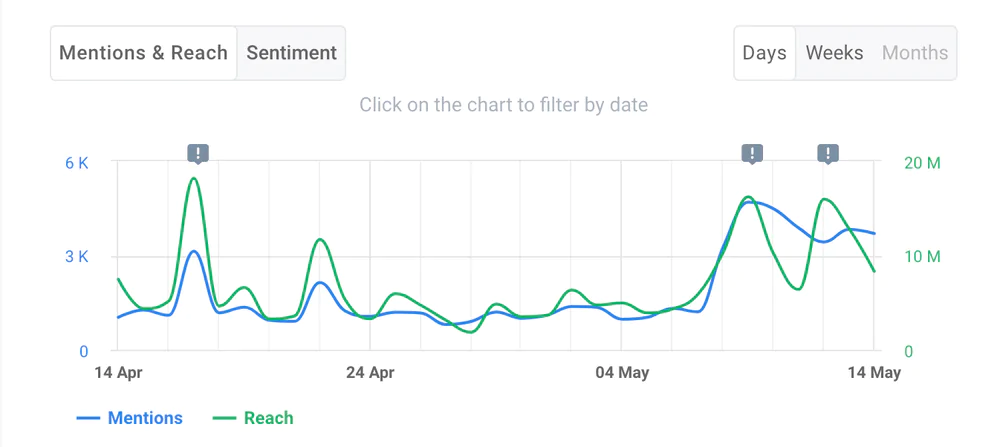
06 Social media and non-social reach
Social media reach is the total number of unique users who see your content on social media platforms like Facebook, Instagram, TikTok, or Twitter. It shows how your company message spreads online.
But even if you made a campaign dedicated to social media – it will likely go beyond that.
That’s why you should also measure the non-social reach which represents the total number of unique users who have seen your content outside social media platforms (on news sites, blogs, podcasts, or forums).
Thanks to measuring social media and non-social reach, you will find out:
- Which sales channels are most effective in driving product sales revenue;
- Which features or aspects of your product captivate and engage your audience the most;
- Seasonal trends that influence customer interest and buying behavior in your market.
Apps like Instagram and TikTok can measure social media reach with their built-in analytics.
For non-social reach, you need tools like Brand24 to track how many people see your content on news sites, blogs, forums, and review platforms.
This way, you get a complete view of how visible your product is online.
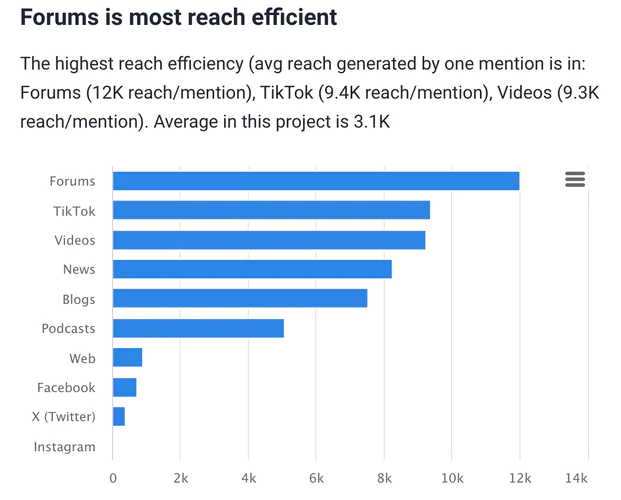
Using an advanced media monitoring tool for product performance analytics can also save you much time on analysis.
For example, thanks to advanced AI technology, Brand24 can spot the most reach efficient source:
07 The volume of mentions
Tracking the number of mentions is crucial for analyzing product performance. It offers real-time feedback on the online discussion of your product.
Thanks to tracking mentions, you will find out:
- How do people talk about your product?
- Early warning signs of potential problems or PR crises (so you can address them before they escalate).
- Opportunities for engagement, such as responding to customer feedback or partnering with influencers who mention your product.
To track mentions effectively, you can use social listening tools. These tools scan various online platforms for mentions of your product and compile the data into an easy-to-analyze format.
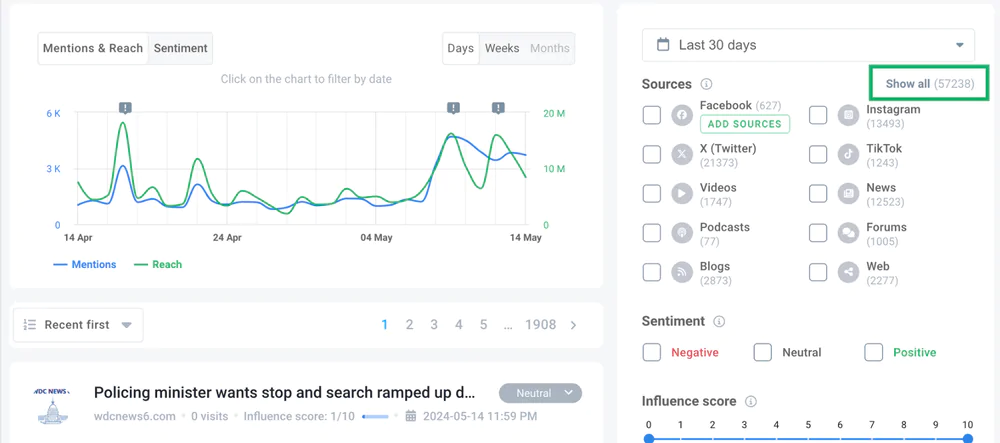
This way, you can monitor how your product is perceived and react swiftly to changes in public sentiment.
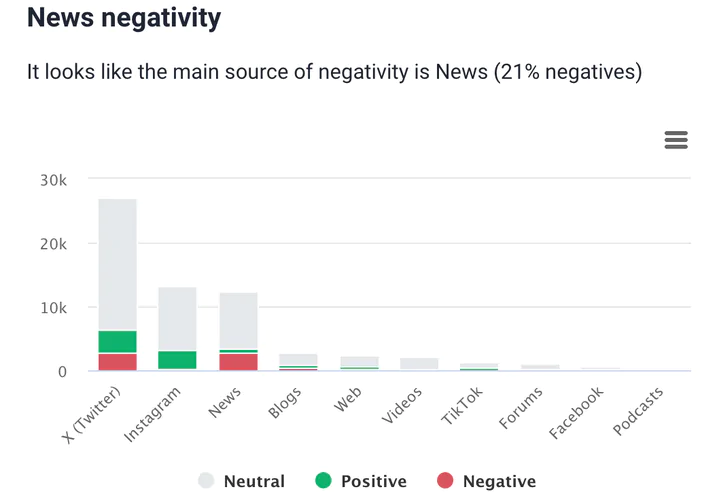
Plus, thanks to AI, they can even find the source that generates most of the mentions:
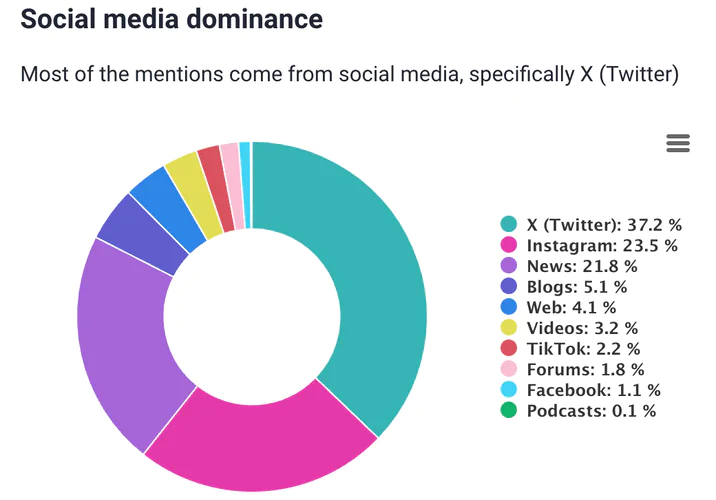
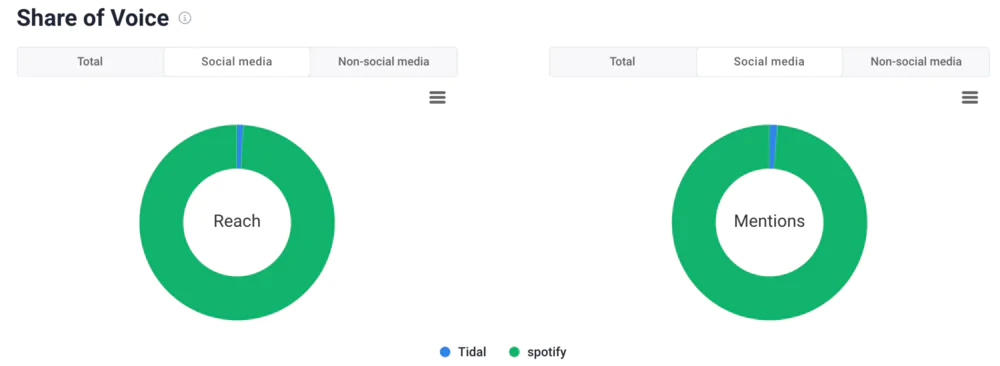
08 Share of voice
Share of Voice shows how much people talk about your brand compared to competitors. This helps you see where you stand in the market.
With the share of voice measurements, you learn:
- How is your brand doing compared to competitors? (helping you improve your marketing to stand out)
- What’s trending? (so you can better meet your audience’s needs)
AI-powered tools can measure the share of voice by counting mentions across different platforms. This gives you a clear, current view of your brand’s impact.
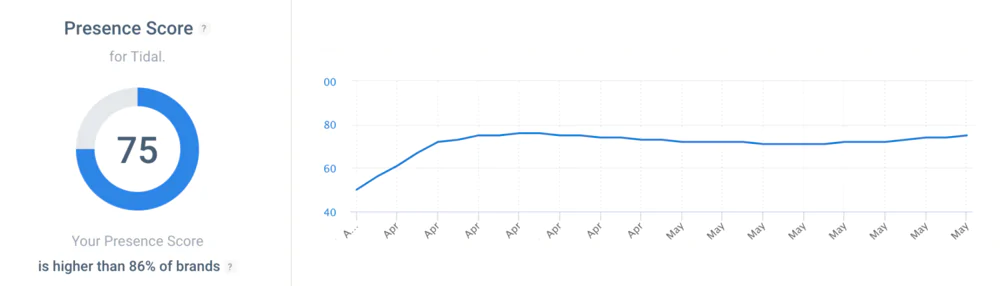
09 Presence Score
The Online Presence Score measures your product’s online visibility and exposure. By monitoring this score, you can estimate how well your product captures attention.
Thanks to measuring the Presence Score, you will find out:
- How is your brand awareness?
- What impact on your product visibility have your updates or marketing campaigns?
- How visible is your brand online compared to others?
- Should you improve your business model?
AI-powered tools can measure the Presence Score by analyzing media mentions and interactions across various platforms. It gives you a complete view of your product’s impact.
Plus, you can monitor how it changes over time:
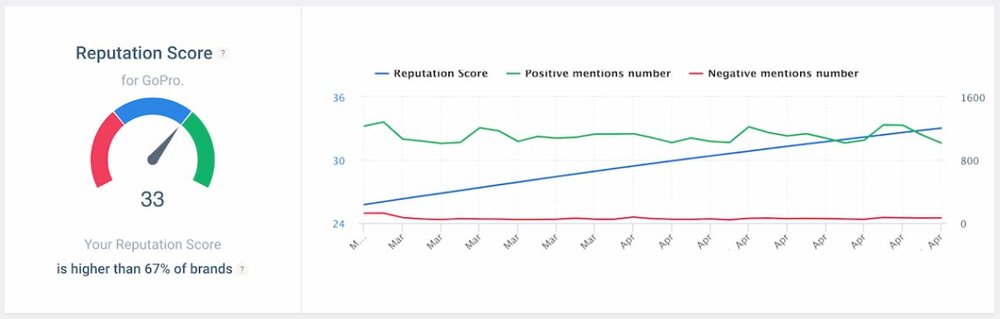
10 Reputation Score
Monitoring the Reputation Score is essential for understanding how the public perceives your product. This score reflects the overall sentiment towards your product.
Thanks to measuring the Reputation Score, you will find out:
- How customers view your product compared to similar products.
- The impact of your actions on product perception.
The score reveals the level of credibility and trust toward your product.
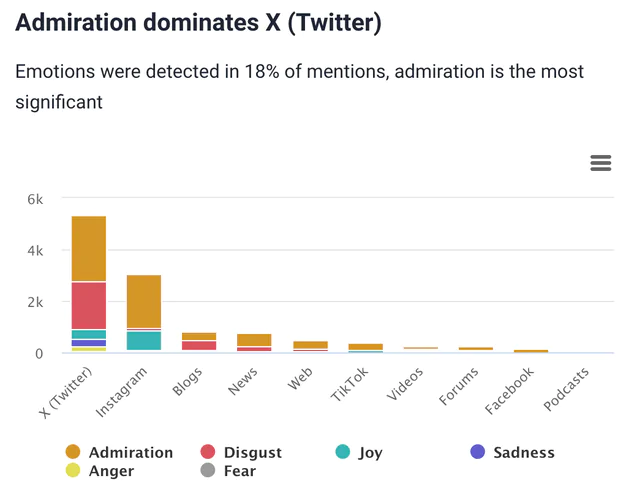
11 Sentiment
Measuring sentiment is often underestimated among product performance metrics.
Big mistake!
It reveals valuable insights into how people interact with your product and whether they like it or not. This insight helps you identify strengths and areas that need attention.
Thanks to sentiment analysis, you will find out:
- Which features or facets of your product please or perturb users?
- How overall opinions and emotions about your product progress over time.
- Where you might need to make modifications for beter user satisfaction.
You can track your product sentiment using media monitoring tools. Here’s what it looks like in Brand24:
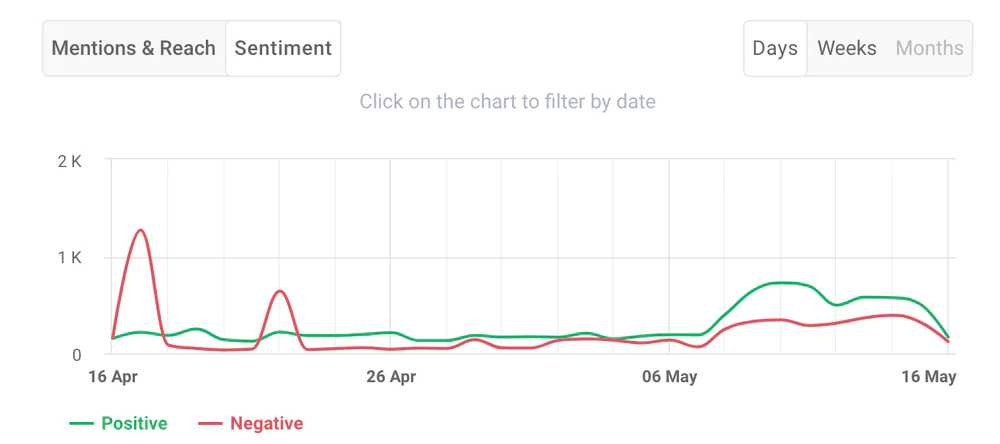
Plus, AI-powered tools can determine your sentiment and even detect emotions. This makes it possible to pinpoint the most praised and criticized sources.
And here’s a real game-changer.
How long does it usually take you to determine where people talk harshly about your product?
Now, you can get this information within 3 minutes!
Tip: Benchmark the product performance
Knowing your product performance needs a benchmark. This should be your basic approach.
After all, how can you know you’re on track if you don’t compare your current results with the past or peers?
With benchmarks in place, you’ll clearly see,
The path to improve and the best you can be.
So, to stay sharp, I suggest you benchmark your product’s progress.
The main benefits of benchmarking product performance:
- Pinpointing performance potential
Identify gaps and opportunities by comparing your product’s performance to industry leaders. - Strategic simplification
Enhance your decision-making with clear insights into market trends and consumer behavior. - Resource refinement
Optimize investment by targeting areas that boost product quality and sales volume. - Accelerated adaptation
Speed up innovation by learning from competitors’ successes and setbacks.
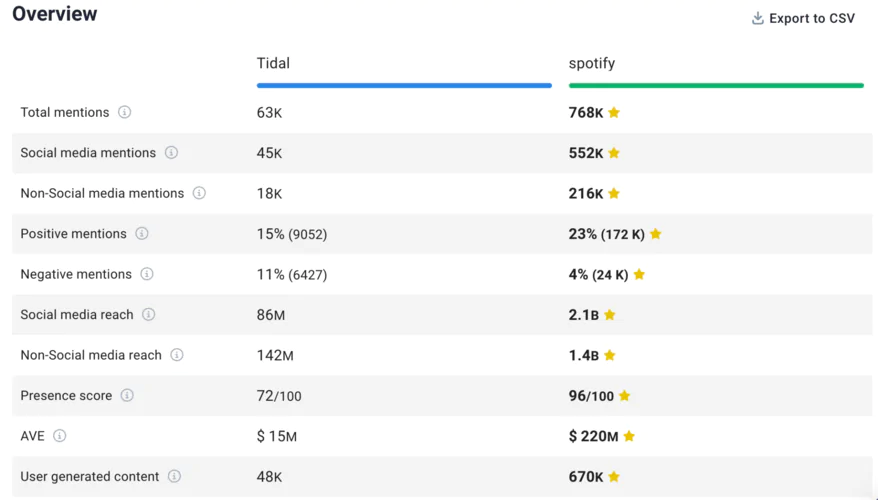
Tidal is a music app with lovers and haters. Its biggest competitor is Spotify, the real market dominator.
How does their product performance compare?
Conclusion
Did you know that even the slightest changes in product design or messaging can lead to a significant uptick in user engagement and sales?
Without gauging how your product performs, you’re navigating blind in a competitive market.
This is the power of data-driven decisions – transforming the smallest insight into substantial growth.
Final thoughts:
- You can’t innovate effectively without understanding what’s working and what’s not. Monitoring data, you can turn every tweak and test into a potential breakthrough.
- With product analytics about user preferences and behavior, you can bond better with your customers and turn their feedback into features they love.
- Consider creating a product performance report once in a while. It’s easy to get lost in this vastness of data. It will provide a comprehensive view of your product’s market standing and the average dollar value generated per user.
Notes taken? I suggest you sign up for the Brand24 trial now. Test the features above on your own!