Table of contents
2M Marketers

Say your brand gets 25% of the attention in your category but holds only 15% of the market. A year later, your market share may grow by… about half a point.
At least, that’s what research by Binet and Field found after analyzing 171 campaigns across major categories. Not a great deal on paper, but one that still pays off for brands that play the long game.
In this guide, I’ll break down share of voice vs. share of market, show you how to measure both, and help you read the gap between them before your competitors do.
Key takeaways
-
SOV measures visibility; SOM measures commercial position
Looking at them together shows whether your brand’s share of attention is keeping pace with the share of the market it already holds.
-
A positive gap between SOV and SOM can be an encouraging sign of growth
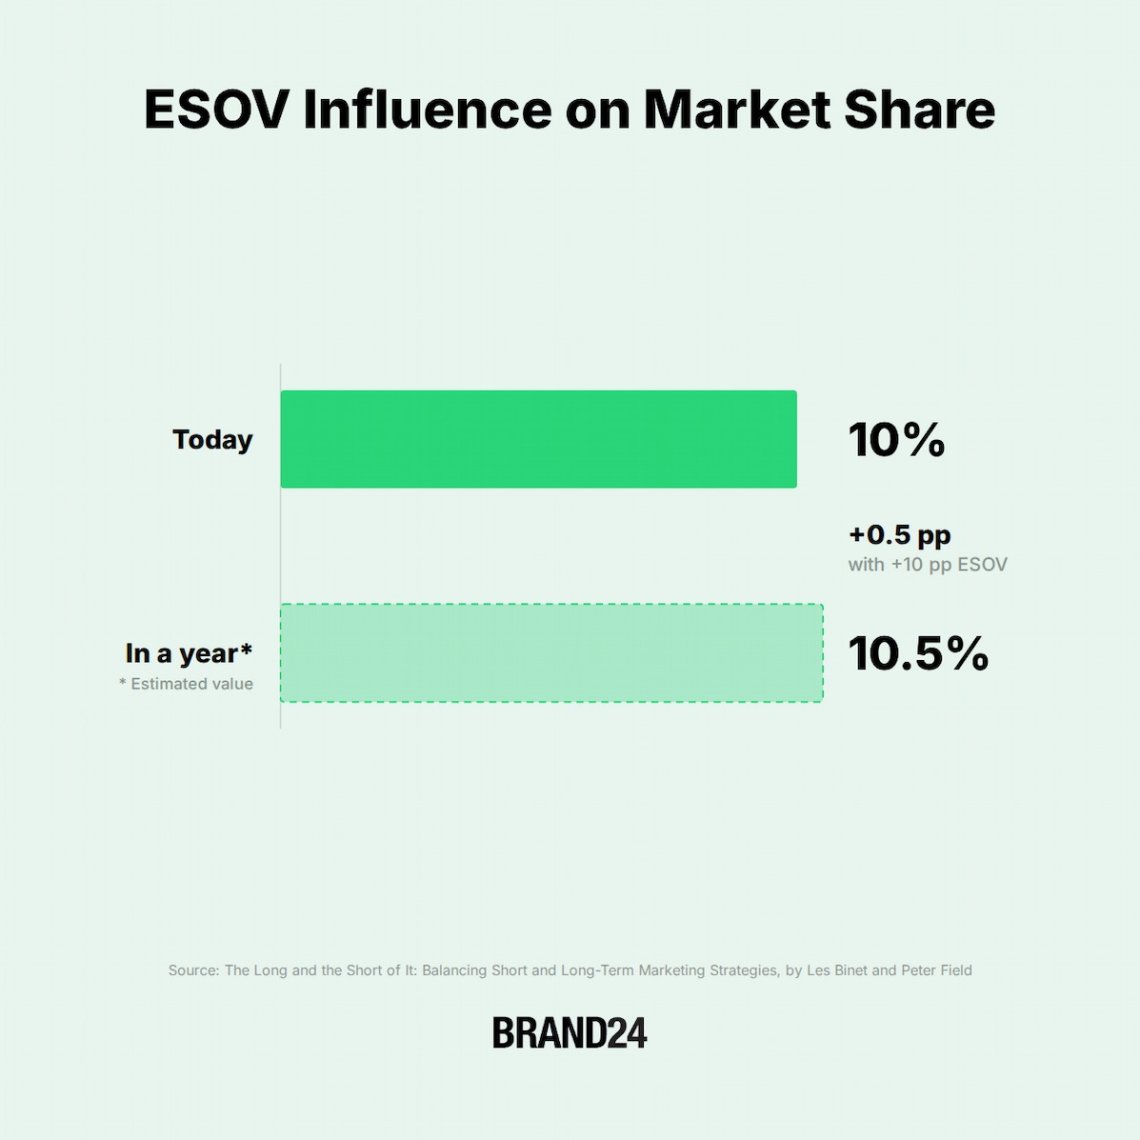
This gap is called Excess Share of Voice, and research shows that, on average, a +10 pp ESOV is associated with approximately 0.5 pp of market share growth per year.
-
A high SOV isn’t automatically good visibility
In a comparison I ran of six major smartphone brands, Xiaomi ranked second in online SOV, with 28% of mentions and 27% of estimated reach. But 16% of its mentions were negative, compared with just 11% positive.
-
The direction of the gap matters more than a single snapshot
Track SOV and SOM over time to see whether visibility is pulling ahead, keeping pace, or falling behind. Then investigate what’s driving the change before deciding where to invest.
Share of voice vs. share of market: key differences
The simplest way to separate the two is this: share of voice measures how much attention your brand gets, while share of market measures how much of the market your brand actually owns.
Share of voice is the more flexible metric. It doesn’t rely on one fixed input: you can calculate it using brand mentions, media spend, impressions, search, or another measure of visibility, depending on what channel you’re investigating.
Share of market is more straightforward. It’s based on sales, revenue, or units sold within a defined market.
Here’s the difference at a glance:
| Share of voice (SOV) | Share of market (SOM) | |
|---|---|---|
| What it measures | Your brand’s share of visibility or attention | Your brand’s share of total category sales or revenue |
| What it tells you | How visible you are compared with competitors | How large is your commercial position compared with competitors |
| Based on | Mentions, media spend, impressions, search visibility | Sales, revenue, or units sold |
| Data sources | Social listening platforms, advertising tools, SEO platforms | Market research reports, company filings, panel data, CRM data |
| Basic formula | Your brand’s metric ÷ total metric for all compared brands × 100 | Your sales ÷ total market sales × 100 |
| Time focus | Forward-looking: can act as a leading signal of where your competitive position may be heading | Backward-looking: reflects the market position your business has already achieved |
| Best used for | Benchmarking visibility, tracking campaign impact, and spotting shifts in competitive attention | Measuring sales performance, benchmarking category position, and tracking market share growth |
How are share of voice and share of market connected?
On their own, the two metrics answer different questions.
Put them side by side, though, and they serve as a health check for your brand: you can see whether your visibility is keeping pace with or running ahead of your current market position.
But, before we compare the two, there’s one thing to keep in mind.
Market share has a fairly clear denominator: the total market. With SOV, you define the playing field yourself – the metric, competitors, channels, and timeframe. All of these affect the final percentage.
So, when looking at SOV vs. SOM, make sure your comparison is valid. Use the same market, competitive set, and time period for both metrics, and keep your SOV methodology consistent from one measurement to the next.
Once you’re comparing like with like, look at which percentage is leading.
When SOV runs ahead, your visibility exceeds your current market position. When it falls behind, your market share is stronger than the amount of attention your brand is getting.
That difference even has its own metric: Excess Share of Voice (ESOV).
What is Excess Share of Voice (ESOV)?
Excess Share of Voice (ESOV) is the difference between your share of voice and your share of market. In other words, it shows whether your brand is gaining or losing visibility relative to its current market position.
Despite its rather flamboyant name, the math behind it is simple:
ESOV = Share of Voice – Share of Market
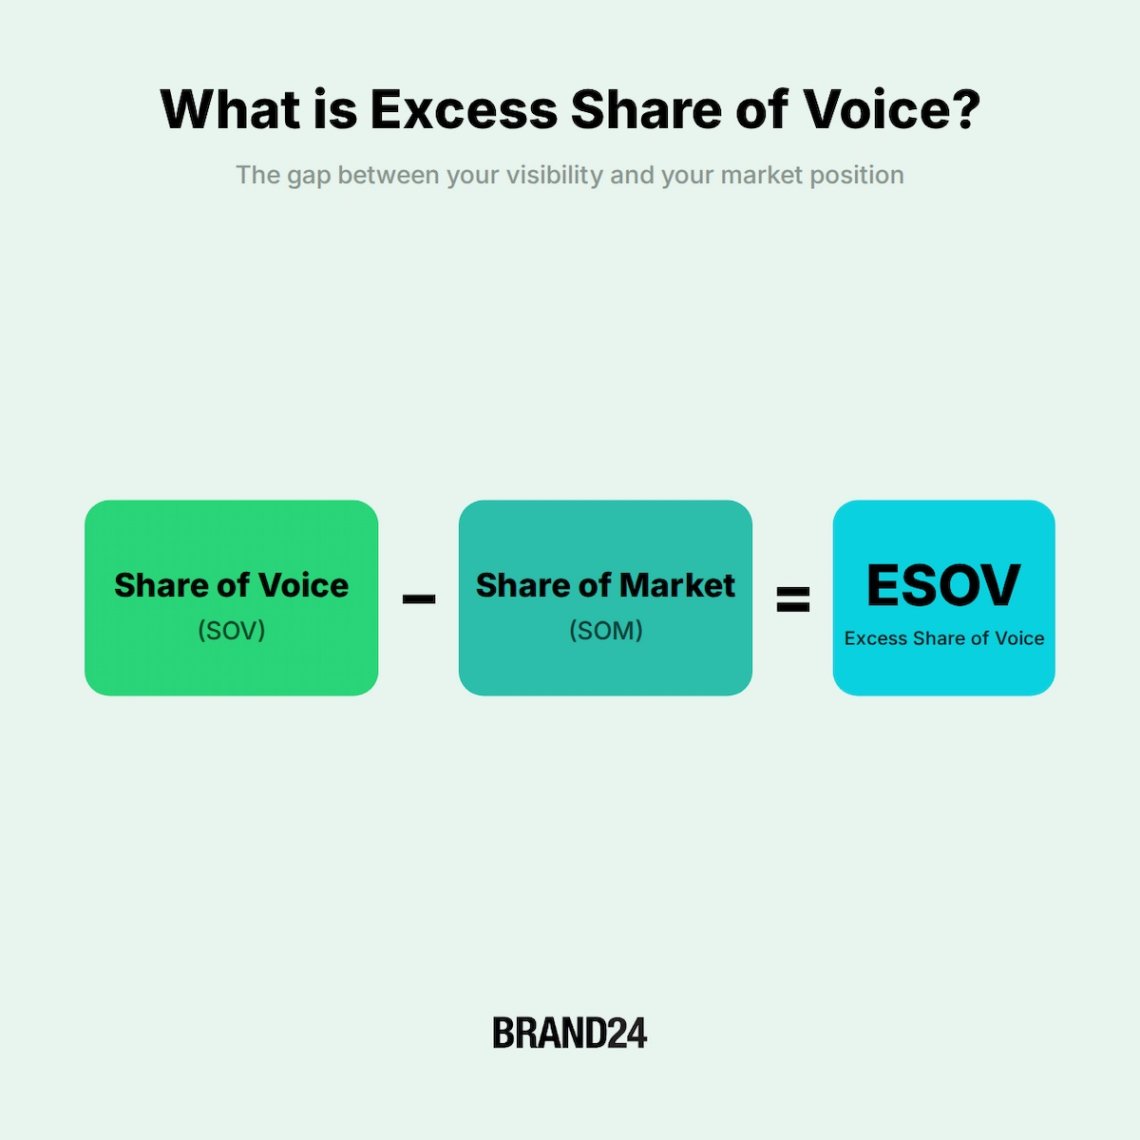
So, if your brand has 15% SOV and 10% market share, your ESOV is +5 percentage points. You’re getting a larger share of visibility than the share of the market you currently hold.
That can be an encouraging sign. If the advantage is sustained and comes from valuable visibility, it can support future market share growth.
Flip it around – 8% SOV and 10% market share – and your ESOV is –2 percentage points. This time, your market position is stronger than your visibility.
That doesn’t mean your market share is about to fall.
But if the gap persists or widens, it can signal that your current position isn’t being matched by the same level of competitive visibility, giving your competitors an opportunity to gain ground and potentially take the lead over time.
Can ESOV predict market share?
Short answer: yes, to an extent.
There’s a solid body of research behind the link between ESOV and market share growth, with IPA studies covering hundreds of campaigns over the years and showing a fairly consistent pattern.
The best-known benchmark comes from a 2013 analysis by Binet and Field of 171 campaigns across major categories. They found that, on average, every 10 pp of positive ESOV was associated with approximately 0.5 pp of market share growth per year.
And their later 2018 Effectiveness in Context research added even more nuance to that rule: the same ESOV gap won’t translate into the same market share growth for every brand.
Factors such as brand size, category, and market conditions all affect how efficiently an extra share of voice translates into growth.
The more recent work still points in the same direction.
In 2025, WARC described ESOV as a well-established driver of marketing effectiveness, noting the same broad pattern: brands with positive ESOV tend to grow, while those with negative ESOV tend to shrink.
All that said, ESOV isn’t a crystal ball.
Personally, I’d treat it as a directional signal. A positive ESOV would definitely get my attention, but I wouldn’t look at +5 points and immediately assume market share is about to follow.
I’d want to know what’s driving that gap and whether it lasts.
Did visibility grow because of sustained brand-building, or because one of your marketing campaigns briefly blew up? Are we gaining attention from the right audience? Is the same pattern still there three or six months later?
The same goes for negative ESOV. One bad month wouldn’t make me panic. A consistent decline across several measurement periods, while competitors continue to gain ground, would.
I’d also be careful about applying those findings too broadly.
Most ESOV studies measure share of voice through advertising or media spend, so their conclusions don’t automatically carry over to social mentions, search visibility, or AI share of voice.
That doesn’t make newer forms of SOV irrelevant. They just tell you something different.
Take AI SOV. A 2025 Ahrefs study of 75,000 brands found a strong correlation between branded web mentions and visibility in ChatGPT, Google AI Mode, and AI Overviews.
In practice, that means a high AI SOV score can also increase your chances of showing up when people ask AI tools about your category, compare products, or look for recommendations.
So while it shouldn’t be treated as a direct substitute for advertising ESOV, its link to commercial outcomes is becoming harder to ignore.
As more people use AI tools to research products, compare options, and get recommendations, appearing in those answers can influence which brands make it into the consideration set – and, over time, which ones win the sale.
How to measure share of voice and share of market?
Measuring SOV and SOM starts with two different kinds of data.
Share of voice depends on the visibility metric you choose, while share of market relies on sales, revenue, or units sold within a clearly defined market.
I’ll show you how I’d approach both, plus a few reliable tools and data sources to use on the job.
How to measure share of voice: formula and tools
As you’ve probably already noticed, there isn’t just one type of share of voice. What goes into the calculation depends on what kind of visibility you want to compare.
The formula stays the same:
Share of voice = Your brand’s metric ÷ Total metric for all compared brands × 100
What changes is the metric you plug into it. In practice, you’ll usually come across four main types:
- Online and social SOV – based on brand mentions across social media platforms, news, blogs, forums, reviews, and other online sources.
- Search SOV – based on how much organic search visibility your brand or website captures compared with competitors.
- Advertising SOV – based on your paid advertising exposure or paid media spend compared with the category total.
- AI SOV – based on your brand’s presence in answers from tools such as ChatGPT, Gemini, or Perplexity.
Your brand could have 25% social media SOV and 8% AI SOV at the same time, and that’s completely normal.
Each percentage describes your visibility across different digital channels, so the metric you use in the formula will depend on which one you’re measuring.
For example, if you want to measure online and social SOV, you could calculate it as:
Your brand mentions ÷ Total mentions of all compared brands × 100
So, say your brand generates 2,000 mentions, and all brands in your competitive set generate 10,000 combined. Then the calculation would be:
2,000 ÷ 10,000 × 100 = 20% SOV
You can apply the same formula to every type of SOV.
In practice, though, you probably won’t be sitting there calculating all those percentages yourself.
Dedicated share of voice tools can handle that part for you, pulling together the underlying SOV data, comparing brands, and automatically calculating the percentage.
To make this a bit less theoretical, I ran a comparison in Brand24 using six major smartphone brands: Apple, Samsung, Xiaomi, OPPO, vivo, and Huawei.
Since several of these brands sell much more than smartphones, I used excluded keywords to filter out unrelated product categories and to keep the dataset as focused as possible on smartphone-related conversations.
For Apple, for example, that meant excluding terms connected with products like Macs and iPads; for Huawei, laptops, tablets, wearables, and other non-phone products.
The results below cover mentions collected between September 6 and October 6, 2026.
The Comparison tab did the math for me and showed SOV in two ways: by the number of mentions each brand generated and by its estimated reach.
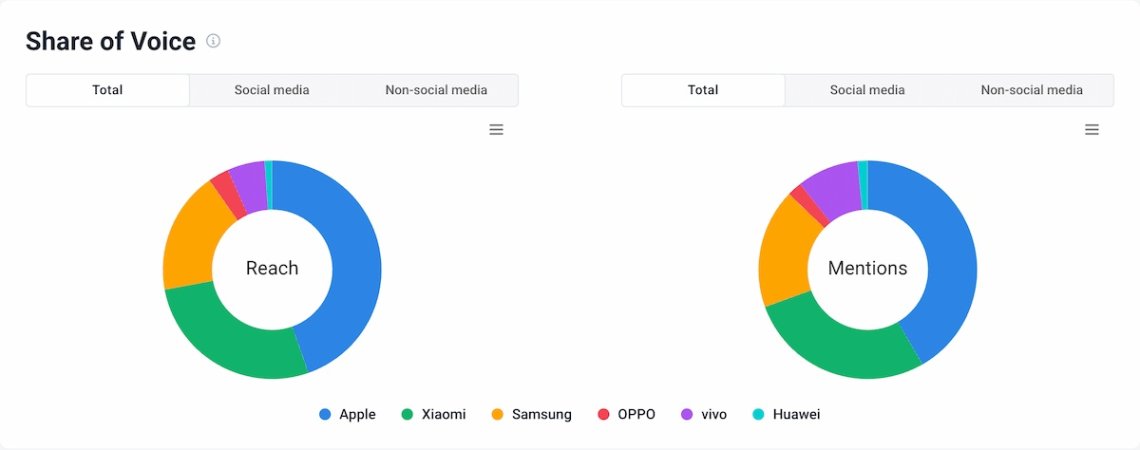
Apple comfortably led both, accounting for 42% of mentions and 45% of reach. Xiaomi came second with 28% of mentions and 27% of reach, while Samsung took 18% on both measures.
The ranking barely changed between the two metrics, but the percentages did.
That’s a useful reminder that even within online SOV, the metric you choose affects the picture you get.
Mention-based SOV tells you who owns the largest share of the industry conversation; reach-based SOV adds another layer by showing how far that conversation could have traveled.
And that’s why the setup for measuring your share of voice depends largely on which part of your digital marketing mix you want to focus on.
Social listening tools, like Brand24, are best suited to online and social SOV; SEO suites handle search visibility; ad platforms provide advertising metrics; and a newer group of AI visibility tools tracks your share across AI-generated answers.
Here are a few I use regularly and can comfortably vouch for:
| Tool | Best for | Useful features | Pricing |
|---|---|---|---|
|
1
|
Social and online visibility
|
Competitor comparison, mention share, reach, sentiment analysis, trend tracking, and AI-powered analysis
|
From $199/mo
|
|
Social and online visibility
|
Competitor benchmarking, mention volume, audience insights, sentiment, trend analysis
|
Custom pricing
|
|
|
3
|
Search and AI visibility
|
Search visibility tracking, competitor comparison, organic traffic analysis, AI brand visibility, and prompt-level analysis
|
From $99/mo
|
|
4
|
Search and AI visibility
|
Rank tracking, keyword-level SOV, competitor visibility, SERP monitoring
|
From $29/mo
|
|
5
|
AI visibility
|
Brand mention tracking, competitor SOV, prompt monitoring, source and citation analysis
|
From $99/mo
|
|
Paid search visibility
|
Impression Share, Lost Impression Share, competitor auction insights
|
Free / ad spend
|


How to measure share of market: formula and sources
Share of market is less flexible in what it measures. You’re comparing your company’s sales, revenue, or units sold with the total for the market you compete in. So:
Share of market = Your company’s sales ÷ Total market sales × 100
If your company generates $2 million in sales in a market worth $20 million:
$2M ÷ $20M × 100 = 10% SOM
Your own number is usually easy enough to find. The harder part is getting a reliable total for the market and making sure it covers the same category, geography, and period as your internal data.
Unlike with SOV, you often won’t get that denominator from a single dashboard.
Depending on the industry, you might need to consult market research databases, analyst reports, company filings, government statistics, or trade associations.
The important part is making sure the external number measures the same thing as your own number.
If you’re calculating market share based on revenue, for example, you need the total market revenue, not the total number of units sold. Likewise, if you’re using internally reported units sold, compare them with total units sold across the market.
It sounds obvious, but market reports don’t always use the same definition.
Two reports on the smartphone market could give you different market shares simply because one measures revenue while the other measures shipments. Neither is wrong; they’re answering different questions.
The same goes for geography, category, and timeframe. US sales shouldn’t be divided by a global market total, and quarterly revenue shouldn’t be compared with a full-year market estimate.
So, where do you get all that from?
Your own sales figures will usually come from internal systems, while the market total may come from a completely different source.
Depending on the industry, that could be a market intelligence platform, purchase panel, public dataset, company filing, or retailer report.
Here are the main sources I’d check:
| Source type | Best for | Examples |
|---|---|---|
|
1
Market intelligence platforms
|
Market size, category growth, competitor estimates, and broader industry benchmarks
|
Euromonitor Passport, Statista, IDC
|
|
2
Retail and purchase panels
|
Sales and purchase-based market share, especially in consumer goods and retail
|
NielsenIQ, Circana, Kantar
|
|
3
Company and competitor disclosures
|
Revenue, units sold, shipments, and segment-level performance reported by public companies
|
Annual reports, earnings releases, investor relations pages
|
|
4
Public industry data
|
Market totals published by government agencies, regulators, industry bodies, and trade associations
|
Eurostat, U.S. Census Bureau, national statistics offices, industry associations
|
|
5
Internal sales data
|
Your own revenue, sales volume, or units sold – the numerator in the SOM formula
|
Salesforce, HubSpot, ERP systems, and internal sales reports
|
|
6
Distributor or retailer data
|
Sell-through, category sales, and competitive performance within a specific retail or distribution channel
|
Retailer dashboards, distributor reports, marketplace analytics
|
Once you have both your SOV and SOM percentages, comparing them is pretty straightforward.
The more interesting bit is figuring out what the gap between them means and what you should do about it.
What does your SOV vs. SOM gap tell you?
The point of comparing your SOV and SOM isn’t just to label the gap positive or negative. It should work more like a compass, pointing you toward what to focus on and what to do next.
So let’s take a look at the three most common scenarios and how to respond in each.
SOV > SOM: your visibility is ahead of your market position
Say you hold 12% of the market but account for 18% of the share of voice.
That’s generally an encouraging position to be in. Your brand is getting more attention than its current market share would suggest, giving you room to grow.
But there’s one pitfall. More visibility doesn’t automatically mean better visibility.
If you’re measuring SOV through online mentions, for example, then a crisis, product issue, or wave of negative reviews could push your share of voice up for all the wrong reasons.
The earlier smartphone comparison is a good example of why sentiment matters here.
As you may remember, Xiaomi had the second-highest online SOV in the group, accounting for 28% of mentions and 27% of estimated reach.
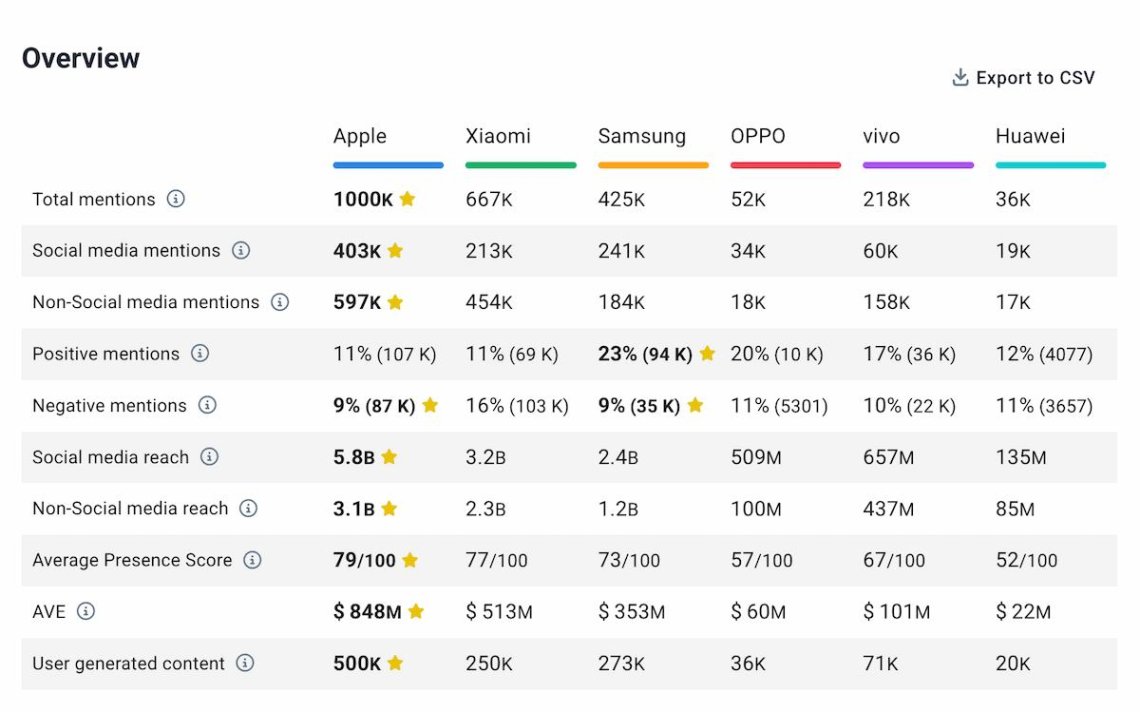
But once I looked beyond the headline number, the picture became much less rosy. 16% of Xiaomi’s mentions were negative, compared with 11% positive, and negative mentions outnumbered positive ones overall: 103K vs. 69K.
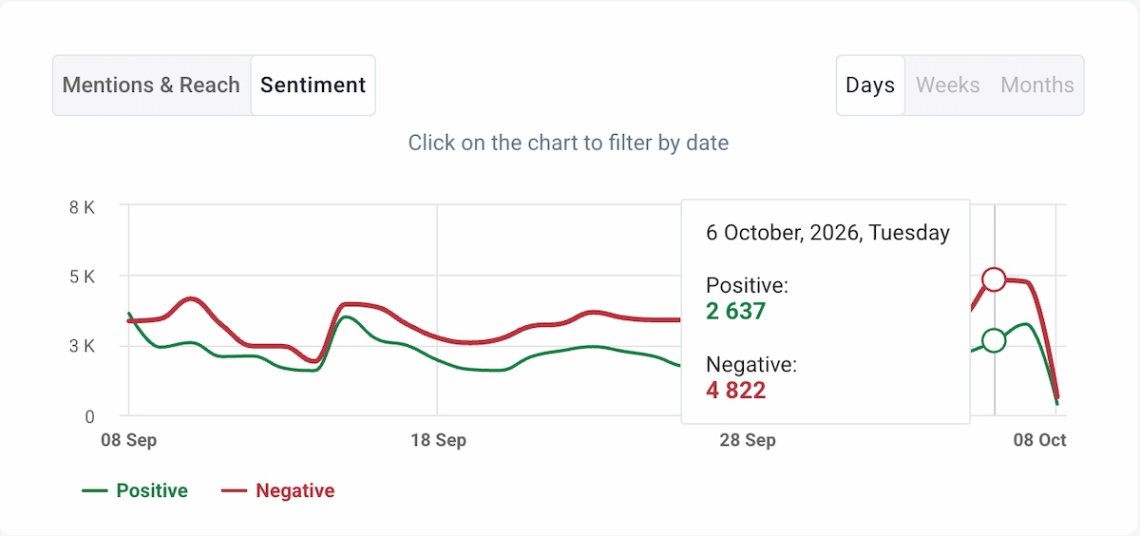
So, a strong SOV number on its own doesn’t necessarily mean your brand is winning the market conversation.
You still need to know why people are talking about you and what that attention means for your brand reputation.
Before you treat that 6-point gap as a win, look at what’s driving it, what people are saying, and whether the increase lasts.
If the visibility looks healthy and the gap holds over the next few measurement periods, SOM may start to follow.
Action steps:
- 1 Check the context behind the increase. If you’re using mention-based SOV, look at sentiment, recurring topics, industry trends, and the social media conversations driving the spike.
- 2 Break your SOV down by channel. See whether the advantage is coming from search, social, PR, advertising, AI visibility, or a mix of several sources.
- 3 See whether the increase holds over time. Compare several measurement periods to see if your visibility stays ahead of your market share, or if the gap disappears once a campaign, event, or news spike passes.
- 4 Double down on the channels producing valuable visibility. If one area is consistently driving relevant attention, put more effort or investment into it.
- 5 Watch what happens to SOM next. If SOV stays ahead but market share doesn’t move, visibility may not be the problem. It may be worth taking a closer look at conversion, pricing, distribution, or product fit.
SOV ≈ SOM: your visibility matches your current position
If you have 15% SOV and around 15% SOM, your share of attention is roughly in line with the share of the market you already hold.
That is neither good nor bad. What matters is whether the balance is stable.
If both numbers are holding steady and competitors aren’t gaining ground, there may be little reason to change course.
But if a competitor’s SOV is climbing while yours stays flat, that balance could look very different a few months from now.
Action steps:
- 1 Treat your current SOV as a benchmark. Track it consistently so you can quickly spot when your visibility starts moving away from your market position.
- 2 Keep an eye on competitor SOV, too. Your own percentage can stay flat while a competitor quietly gains ground.
- 3 Watch for competitors whose SOV starts pulling ahead of their SOM. That can be an early sign they’re becoming a more serious player in the market.
- 4 Investigate sudden shifts by channel. If the balance changes, check whether it’s coming from search, social, PR, advertising, or AI visibility before deciding how to respond.
SOV < SOM: your market position is stronger than your visibility
Now flip it around. You hold 20% of the market but only 13% share of voice.
Your sales position may still look healthy, but you’re losing some of the attention around the category.
That doesn’t automatically mean trouble.
A short-term dip could, for example, come from your decision to reduce campaign activity. But if your SOV continues to decline while competitors gain visibility, it’s time to take action.
Action steps:
- 1 Break down your SOV by channel to see where the gap is coming from. Check search, social, PR, advertising, AI visibility, or whichever channels matter most to your market.
- 2 Identify which competitors are gaining the visibility you’re losing. Compare your SOV with theirs within the same channel and timeframe, then look at what’s driving the shift. In social listening, that might mean more mentions or reach across social platforms; in search, stronger rankings and visibility; in AI, more appearances across the prompts you track.
- 3 Check whether the gap is temporary or widening over several measurement periods. Put your current SOV and SOM next to the previous month or quarter, then repeat the comparison over time.
- 4 Prioritize the areas where the decline is both meaningful and fixable.
- 5 Build your response around the cause. That might mean strengthening SEO content, increasing PR activity, placing more weight on brand campaigns, or improving your presence in AI-generated search results.
- 6 Keep measuring SOV alongside SOM after making changes. You’re looking for the visibility gap to start closing without losing the market share you’re trying to protect.
Conclusion: Which metric should your business prioritize?
I wouldn’t give SOV and SOM equal weight in every situation. The one I’d prioritize depends on whether you’re trying to understand your current position or change it.
SOM is the stronger metric for judging overall commercial performance.
SOV comes into play when you’re looking for earlier signs of competitive movement – especially when you’re actively trying to grow, enter a market, or defend your position.
Here’s how I’d look at it:
| Business situation | Prioritize | Why |
|---|---|---|
| You’ve just entered a new market and don’t have a meaningful sales share yet | SOV | SOM won’t tell you much at this stage. SOV gives you an earlier read on whether the brand is starting to break through against established competitors. |
| You’ve increased your marketing investment and want to know whether it’s gaining traction before sales catch up | SOV (+ ESOV) | If visibility starts moving ahead of SOM and stays there, that can be an early sign that the extra investment is strengthening your competitive position. |
| You’re a category leader, but a smaller competitor is rapidly gaining attention | SOM + SOV | SOM will show whether they’re actually gaining market share, while SOV will show how quickly they’re building visibility. Together, they’ll help you tell whether it’s just a burst of buzz or a competitor that’s genuinely starting to gain ground. |
| You’re cutting marketing spend and want to know how far you can go without weakening the brand | SOM + SOV | SOM will show whether your market share is holding, while SOV will show whether reduced marketing activity is starting to cost you visibility before that decline reaches sales. |
| You need to report business performance to leadership | SOM | It’s the clearer measure of commercial position. SOV works best as a context for explaining where competitive pressure or future movement may be coming from. |
Share of market is ultimately the business outcome. Share of voice is one of the signals that can help you understand what may influence that outcome.
So rather than choosing one metric and ignoring the other, match them to the decision in front of you.
Use SOM to assess commercial position, SOV to track competitive visibility, and the relationship between the two to decide where your attention – and budget – might be needed next.
FAQ
It can, but it’s not guaranteed. Research has linked positive ESOV with future market share growth, especially when the visibility advantage is sustained over time.
SOV works best as an early signal rather than a promise. If visibility keeps growing but market share doesn’t follow, the issue may lie elsewhere – for example, in conversion, pricing, distribution, or product fit.
It depends mainly on how often reliable market share data is available for your niche.
If SOM can be measured monthly, then a monthly comparison of SOV vs. SOM will give a useful ongoing view.
If your market data is measured quarterly, compare SOV and SOM on the same schedule, while monitoring your own SOV between those check-ins for major shifts.
The important part is consistency. One comparison shows where things stand, while repeated measurements show where they’re moving.
Subtract share of market from share of voice:
ESOV = SOV – SOM
So, if your SOV is 18% and SOM is 12%, ESOV is +6 percentage points. If SOV is 9% and SOM is 12%, ESOV is –3 percentage points.
It depends on the decision you’re making.
Prioritize the share of market when you want to measure commercial performance. For example, how much of the category your brand currently owns, or whether sales share is growing.
Focus on share of voice for an early read on competitive momentum. For example, whether your brand is gaining visibility, whether a challenger is starting to break through, or whether reduced marketing activity is costing you attention.
For growth and competitive planning, the two are most useful together: SOM shows where the brand stands now, while SOV helps show whether that position is being strengthened or challenged.
Related articles



Top Reads
X (Twitter) Analytics Tools: The 15 Best for 2026
Brand Awareness Strategy [Ultimate Guide for 2026]
Sentiment Analysis in 2026: Definition, AI Methods & Original Research
Brand Monitoring: Tools & Guide for 2026
Brand Reputation Management: Expert Guide + Original Research [2026]
How to See How Many Times a Hashtag Was Used on X (Twitter)
9 Hashtag Tracking Tools Tested in 2026
Social Media Reach: How to Measure & Improve It in 2026?
Share of Voice: Definition, Formula, Tools [2026 Guide]
Social Media Analysis: Complete Guide for 2026
Start Social Listening!
Get the Brand24 trial and start social listening like a PRO.