Table of contents
How to Measure Startup Performance? [2026]
In 2023 alone, 5.49 million new businesses were launched in the US. However, starting a company is just the beginning – monitoring its performance is key to success. If you’re here, you’re probably looking for the best way to measure your startup performance.
No worries – this article will guide you through everything you need to know!
Startup performance shows how well your startup is growing and achieving its business goals. It is measured by Key Performance Indicators (KPI) and other startup metrics.
Ready? Let’s go 🚀
What is startup performance?
Startup performance refers to how well a new business is doing.
It’s measured using Key Performance Indicators (KPI) and other key metrics, such as reach, Return on Investment (ROI), or Customer Lifetime Value (CLV).
Startup founders need to do it! Why?
These businesses are in their early stages, and every decision (even the smallest) can greatly impact their future growth.
By measuring their performance, they can make data-driven decisions to help them achieve long-term objectives and avoid unnecessarily spending money.
Measuring startup performance is also needed to:
Spot weaknesses or parts of your business that need necessary adjustments
Attract stakeholders and investors
Improve your strategies and products
Gain valuable insights into the financial health of your startup
Measure the performance of your startup!
How to measure startup performance?
Measuring startup performance isn’t that simple!
First, you should choose the metrics to track based on your business goals.
However, there are specific metrics that EVERY startup should measure. These include metrics from the following categories:
Financial metrics
Operational metrics
Performance metrics
Strategic metrics
Here are the key startup metrics, along with tips on how to measure them effectively 👇
01 Social media and non-social reach
Social and non-social media reach are very important metrics for your startup’s success!
Both show how many people have seen your content or content that mentions your startup!
Social media reach measures those who saw your content on social platforms, while non-social reach includes people who discovered your startup through other sources.
Regardless of whether your startup offers an innovative product or service, there is a high chance (IMO almost 100%) that your target audience will first hear about you online!
Thanks to measuring reach, you will:
See the effectiveness of your marketing efforts
Understand how far your startup is spreading and how people are discovering it
How to measure?
The only way to measure your startup reach is to use media monitoring tools like Brand24.
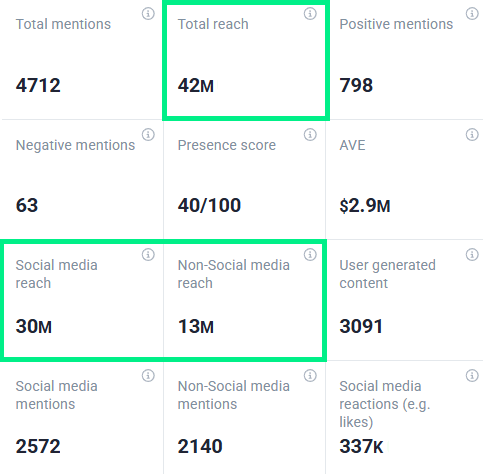
It measures total reach in real-time:

But also distinguish social media and non-social reach:
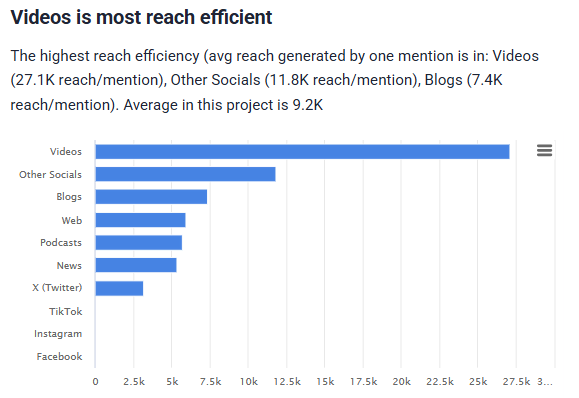
Moreover, Brand24 is AI-powered and offers many in-depth analysis.
For example, it can show you which sources are the most reach-efficient:
What’s the reach of your startup? Check it out now!
02 Return on Investment (ROI)
Return on Investment (ROI) measures whether your investments are profitable.
For example, you can use it to assess the effectiveness of your marketing campaigns.
The higher the ROI, the more effective the project and the greater the profitability.
A negative ROI indicates that the investment was not profitable and the costs exceeded the returns.
How to measure?
You can easily calculate ROI manually. Just enter the data into Excel and use this formula:
ROI = (Return – Cost of Investment) / Cost of Investment x 100%
As mentioned above, you can multiply by 100% to express ROI as a percentage or leave it as a numerical ratio.
03 Customer Lifetime Value (CLV)
Customer Lifetime Value (CLV) shows your customer’s value.
It’s the amount of money a single customer spends on the products or services you offer.
CLV is especially helpful when deciding how much money to invest in acquiring new customers and retaining existing customers.
It also measures customer loyalty – if people keep returning and making repeat purchases, it’s a sign that they are loyal.
This metric should be especially crucial for your customer success and sales team.
How to measure?
That’s the formula for calculating Customer Lifetime Value:
CLV = Customer Value x Average Customer Lifespan
Now, you are probably wondering how to calculate Customer Value (CV) and Average Customer Lifespan (ACL).
Here’s how:
ACL (Average Customer Lifespan) = Sum of Customers Lifespans / Number of Customers
CV (Customer Value) = Average Purchase Value x Average Purchase Frequency Rate
where:
APV (Average Purchase Value) = Total Revenue / Number of Orders
APFR (Average Purchase Frequency Rate) = Number of Purchases / Number of Customers
As you can see, calculating Customer Lifetime Value isn’t that easy!
But don’t worry; many free online calculators will do it for you!
Monitor your startup performance!
04 Churn Rate
The Churn Rate measures the lost customers within a given time period.
It is one of the most important SaaS marketing metrics.
It applies to the number of users who cancel their subscription or stop using the service within a given period.
The higher this rate, the more customers your business is losing.
How to measure?
To calculate your Churn Rate, use this formula:
Churn Rate (%) = Churned Customers / Beginning Customers
05 Customer Retention Rate
The Customer Retention Rate is the inverse of the Churn Rate.
The Churn Rate focuses on customers leaving, and the Customer Retention Rate focuses on customers staying.
It shows the percentage of customers who continue using your product or service over a given period.
If your:
- Customer Retention Rate is high ⬆️, your Churn Rate is low ⬇️
- Customer Retention Rate is low ⬇️, your Churn Rate is high ⬆️
How to measure?
You can calculate it using the following formula:
Customer Retention Rate (%) = (Ending Customers – New Customers) / Beginning Customers
Alternatively, you can use your previously calculated Churn Rate:
Customer Retention Rate (%) = 1 – Churn Rate (%)
06 The volume of mentions
The volume of mentions tells you how often people talk about your startup online.
Of course, the more mentions you get, the better – unless people say negative things about you.
This key metric helps you find out your brand awareness level.
Are people talking a lot about your business online? That’s a good sign – more and more people will become aware of your brand!
By tracking your mentions, you can:
Engage with potential customers and new users
See how popular your startup is
Evaluate how your marketing campaigns or product launches are impacting your brand visibility
How to measure?
A media monitoring tool is the only solution to track all mentions on social media and across the internet, whether tagged or untagged.
Brand24 helps you analyze your mentions in multiple ways.
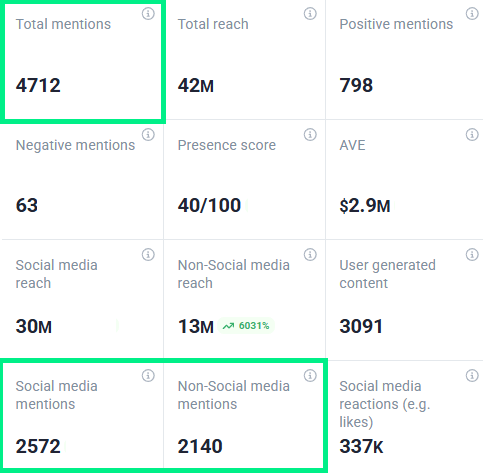
You can see the total number of mentions over a selected time period with an easy-to-read chart:
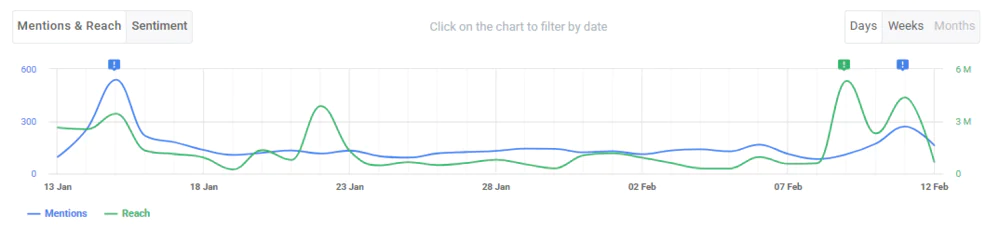
It also provides the exact number of mentions, distinguishing between social media and non-social media mentions:
Anything else?
Yes! Brand24 points out which source is the biggest source of mentions:
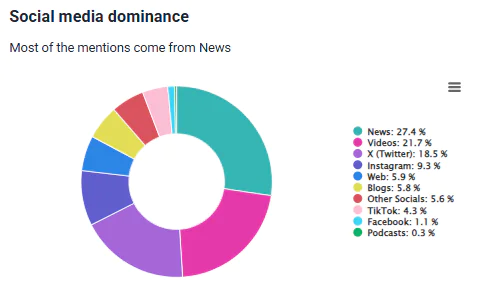
How many times have people mentioned your startup in the past week?
07 Share of Voice (SOV)
Share of Voice (SOV) measures how much of the online conversation your brand captures compared to your competitors.
The higher your SOV, the better – it means people are talking about you more than about the others!
By tracking SOV, you can:
Understand your startup visibility in the market
See how well you’re capturing people’s attention
Check whether your marketing efforts are influencing people
How to measure?
Of course, to calculate the SOV, there is a formula:
SOV (%) = (Number of your Startup Mentions / Total Industry Mentions) x 100
where:
Total Industry Mentions = your Startup Mentions + Competitors’ Mentions
💡You can also calculate SOV based on the reach of your mentions – instead of using the number of mentions, you use the reach of those mentions.
However, calculating SOV manually is inefficient – you cannot track every mention of your startup and competitors yourself!
Luckily, social listening tools can automatically measure SOV for you.
Look how Brand24 measured the SOV of two competing AI video generator startups – Synthesia and HeyGen:
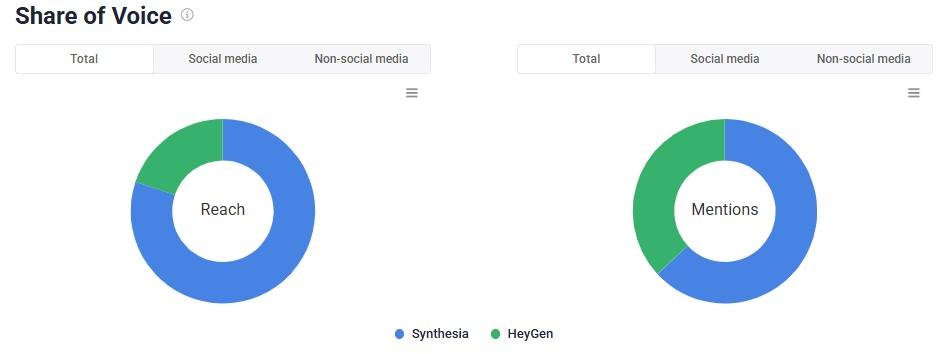
Check your Share of Voice!
08 Presence Score
The Presence Score (also known as the Online Presence Score) quickly shows how popular your startup is online.
It works on a scale from 0 to 100, where 100 means your startup is globally recognizable.
So, the higher the Presence Score, the more popular you are!
Remember, your Presence Score will change over time, so it’s important to monitor it constantly!
By measuring this crucial metric, you can discover:
What’s the online visibility of your startup
How your performance trends over time
The overall effectiveness of your online presence
How to measure?
The Presence Score is determined by multiple factors, including the number of mentions and reach.
To measure it, you’ll need an analytics tool.
Look, this is how Brand24 measures this metric:
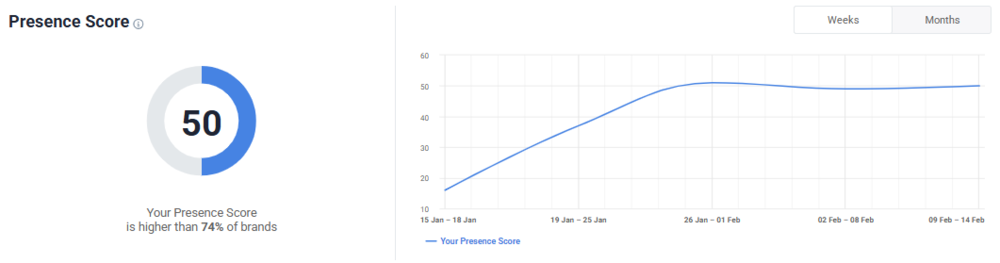
According to Brand24, Synthesia’s Presence Score is 50, which may not be the best result, but still higher than 74% of other brands.
Measure Presence Score and other key metrics for free!
09 Brand sentiment
Brand sentiment measures how people feel about your startup and your products. It can be positive, negative, or neutral.
Sentiment is influenced not only by the products or services you offer but also by other factors, such as marketing and sales efforts.
Customer satisfaction matters! Even one unhappy person can trigger a wave of negative opinions and damage your brand’s reputation.
And remember – rebuilding it isn’t that easy.
That’s why monitoring your brand sentiment in real-time is crucial – so you can address issues before they escalate.
How to measure?
The best way to measure it is by using AI sentiment analysis tools.
One of the best tools on the market is Brand24.
It monitors the mentions in real- time and presents the sentiment on a graph, making it easy to see how your sentiment changes over time:
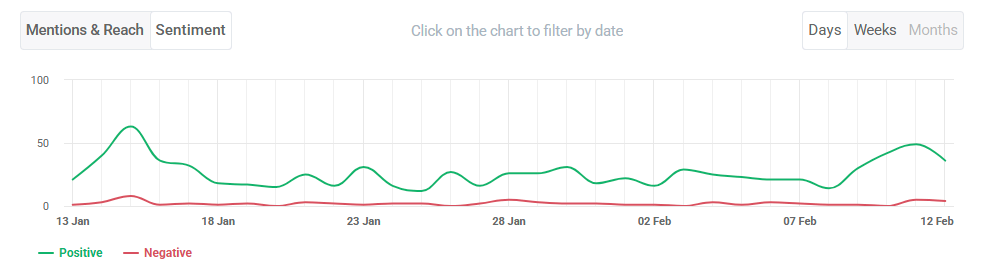
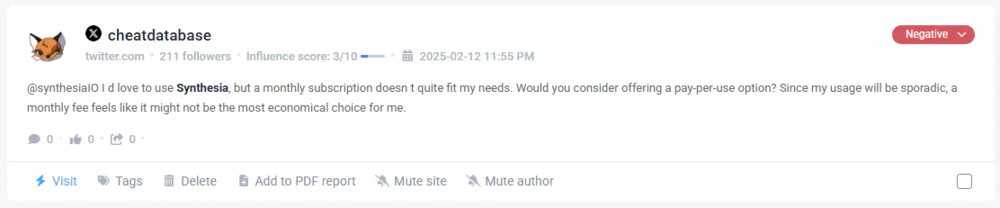
Brand24 also shows each mention and its sentiment individually:
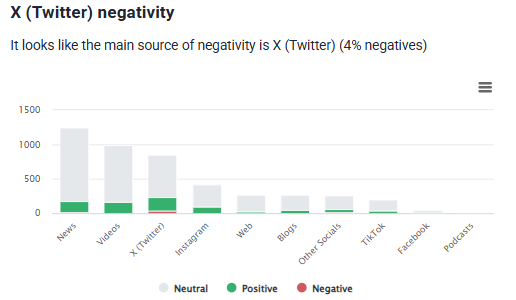
Additionally, this tool analyzes which sources are driving the biggest negativity:
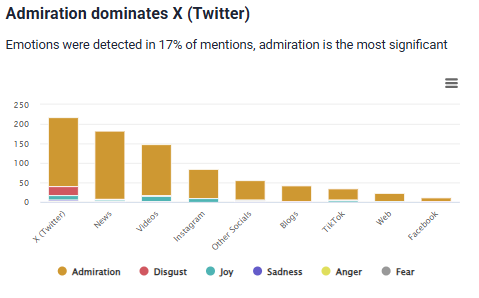
And my favorite feature – Brand24 analyzes the emotions behind the sentiment, helping you understand how people truly feel:
Do people love you or hate you? Check it out!
10 Geo Analysis
For sure, your startup has an audience not just in your own country but around the world.
Geo analysis will show you the locations of people who mention your startup, are exposed to information about your startup, or engage with you.
Thanks to it, you will:
Identify potential new markets for your product or service
Adapt your marketing and sales efforts to regions where your brand has the biggest potential
Understand where your most active users are coming from so you can optimize your marketing strategies
How to measure?
One of the analytics tools that offers valuable insights into the geographic distribution of mentions is Brand24.
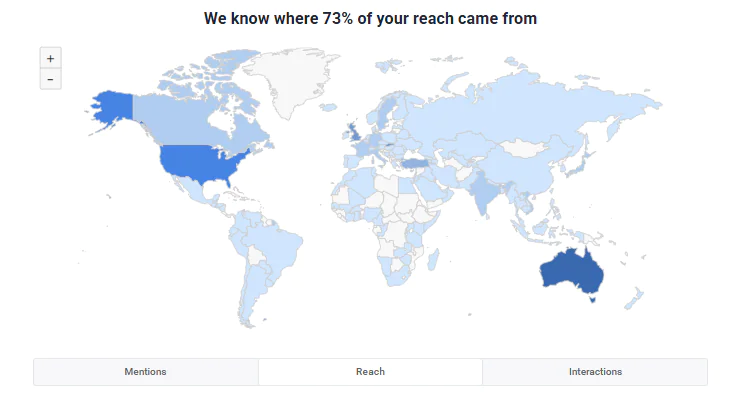
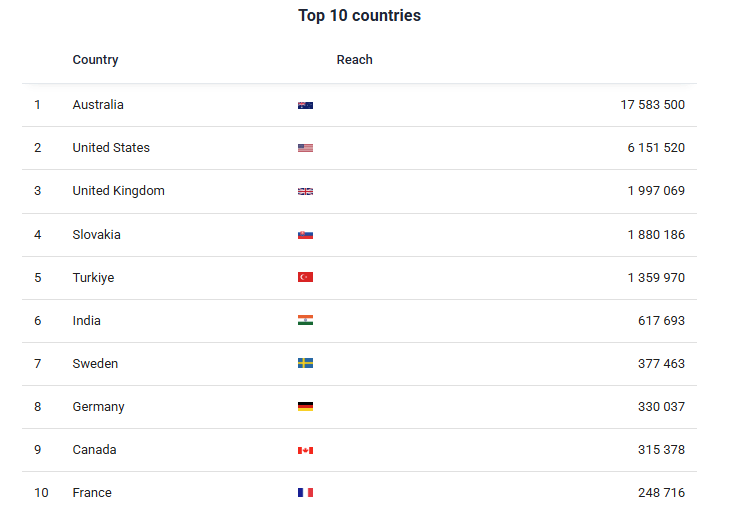
Its Geo Analysis feature displays this data on a map and in a table showing the top 10 countries where your startup is being discussed:
Monitor your performance with Brand24!
Tip: Benchmark the startup performance
To effectively measure your startup performance, compare it to industry benchmarks.
It’s very important to do it regularly!
There are many benefits of benchmarking – it will help you:
Identify areas of your startup that need improvement
Gain a better understanding of your market dynamics
Learn (and adopt) competitors’ effective strategies
Measure progress and assess your position in the market
Stay updated on what your competitors are doing
Discover new trends and innovations
I will show you what effective benchmarking looks like! I will use Brand24’s Comparison feature for this:
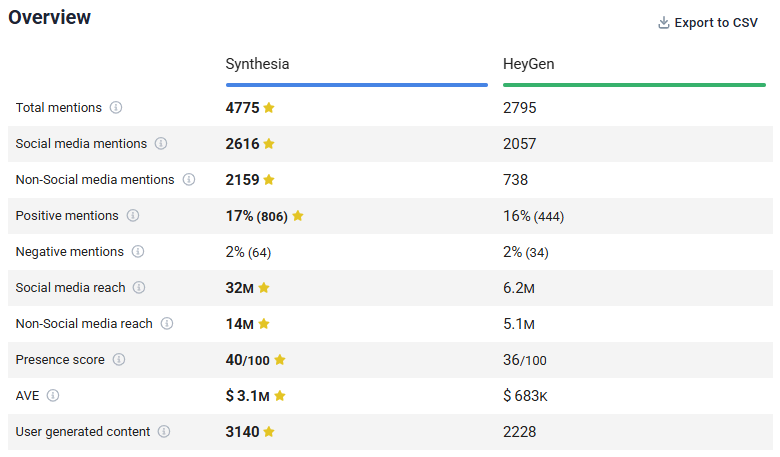
I compared two AI video generator startups, Synthesia and HeyGen.
Let’s walk through the key metrics together:
Total mentions: Synthesia has 4,775 mentions compared to HeyGen’s 2,795.
Positive mentions: 17% of Synthesia’s mentions are positive, while HeyGen has 16% positive mentions.
Negative mentions: Both startups have the same percentage of negative mentions – only 2%.
Social media reach: Synthesia’s social media reach is 32 million, while HeyGen’s reach is only 6.2 million.
Non-social media reach: Synthesia reached 14 million people across non-social media platforms and HeyGen 5.1 million.
Presence Score: Synthesia scores 40/100, whereas HeyGen scores 36/100.
Synthesia performs better than HeyGen.
Considering that they are “the biggest” in the AI video generator market, it can be concluded that Synthesia is the major player.
Benchmark your performance against competitors!
Conclusion
No matter how great your marketing and sales efforts are, your startup risks failure without tracking the right metrics!
But at the same time, it’s important not to get overwhelmed by tracking too many of them.
That’s why I’ve highlighted only the most essential metrics. They will help you measure your startup’s performance and give you a holistic overview.
Final thoughts:
Not only tracking, but also analyzing metrics is an essential part of measuring performance. Understanding your data is key to making data-driven decisions.
Advanced tools like Brand24 are really helpful. They track your performance with the right metrics and provide valuable insights & recommendations to help guide your growth.
Do NOT forget about benchmarking! Without it, you don’t have a reference point to determine whether your results are outstanding, average, or poor.
Tracking metrics has never been easier 👉 Try Brand24 for free – gain valuable insights and make data-driven decisions!

Article Reviewed by