Table of contents
8 Key B2B Marketing Metrics You Should Track in 2026
There are dozens of B2B marketing metrics. But the more you try to measure, the more difficult it becomes to focus on what truly matters. Forget about overpacked dashboards, cut through the noise, and choose only those that really make a difference!
✔️ B2B marketing metrics are Key Performance Indicators that track how effective your B2B marketing efforts are on all stages of sales funnel – from awareness to retention.
✔️ Focusing on the right performance metrics helps you prove marketing’s value, optimize existing resources, and build a competitive advantage.
✔️ Tracking too many metrics creates noise, not clarity. The key is not to measure everything but to measure what matters the most.
Business-to-business (B2B) marketing is definitely different from customer-centered efforts.
In B2C, purchase decisions are often quick, emotional, and made by individuals.
In B2B, the buying process usually involves longer sales cycles, multiple decision-makers, higher-value contracts, and a much stronger focus on building trust and lasting relationships.
Therefore, measuring success in B2B marketing requires its own set of metrics.
| B2B | B2C |
| Long, research-based sales cycle | Quick, emotion-based sales cycle |
| Multiple decision makers | Single decision maker |
| Relationship-based | Product-focused |
| Small audience, high-value transactions | Mass audience, lower-value transactions |
| High-need of product education | Low-need of product education |
What are B2B marketing metrics?
B2B marketing metrics are data-driven indicators that measure how effective your B2B (business-to-business) marketing activities are.
These metrics track performance throughout the whole marketing funnel: from building brand awareness and targeting the right audience to generating qualified leads, driving revenue, and retaining customers.
They provide actual information on what’s working well, what needs improvement, and how marketing efforts contribute to broader business objectives such as sales growth, customer loyalty, and overall return on investment (ROI).
Top 8 B2B marketing metrics to track
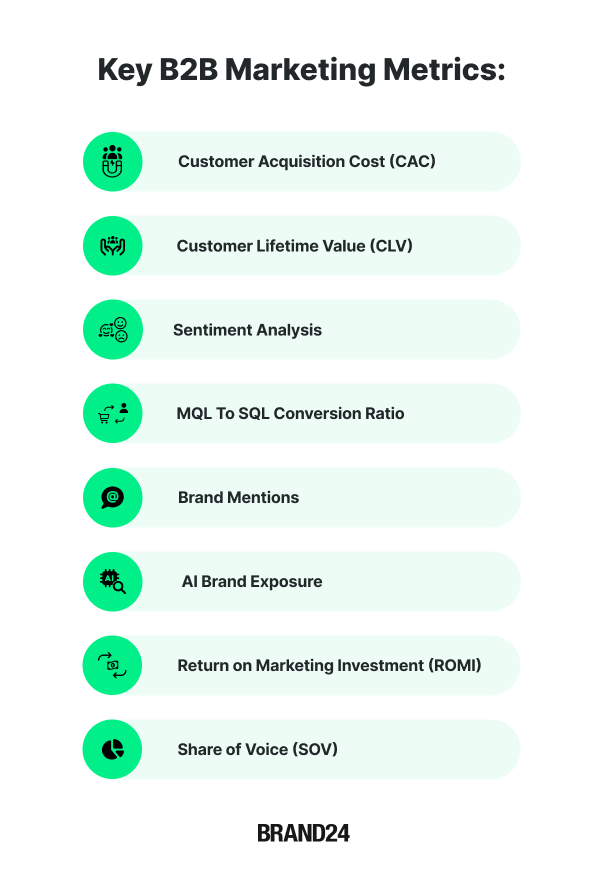
01 Customer Acquisition Cost (CAC)
Customer Acquisition Cost (CAC) measures how much you have to invest to acquire a new customer.
CAC is arguably the most important B2B marketing metric.
Sure, marketing serves multiple purposes.
But at the end of the day, every marketing effort should contribute to business growth, and CAC shows whether your marketing is cost-effective in driving it.
Here, the rule is simple: the lower the CAC, the better.
How to calculate CAC?
CAC = Total Sales and Marketing Costs / New Customers Acquired
Example: Your company spent $100,000 on sales and marketing in a quarter and gained 50 new customers.
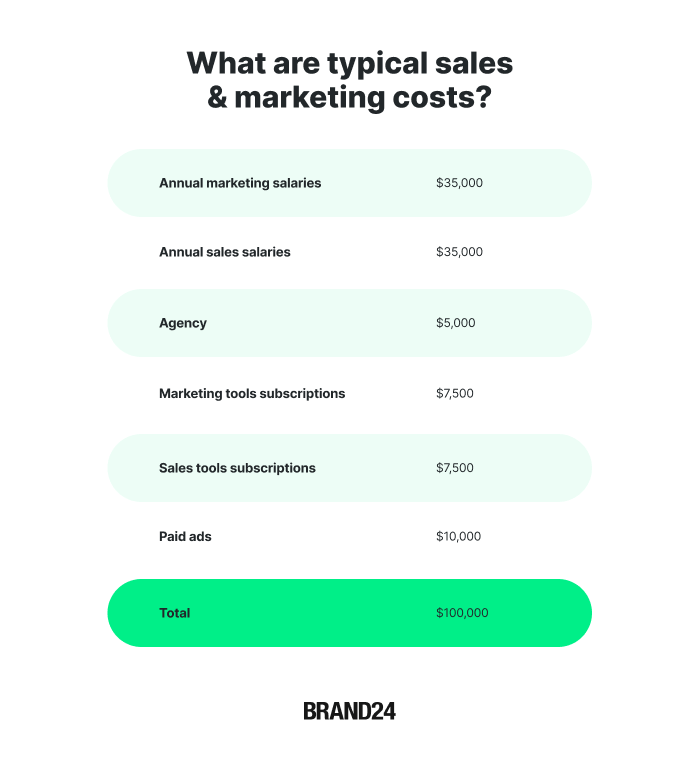
Your CAC is $2000 ($100,000 / 50)
Why CAC matters in B2B marketing:
As it encompasses all marketing-related spending, CAC allows you to decide what to scale, optimize, and reduce.
By comparing the cost of acquisition with the revenue generation, you can identify which campaigns and channels work in your favor and which are draining resources.
02 Customer Lifetime Value (CLV)
Customer Lifetime Value (CLV or LTV) estimates the total revenue your business can expect from a single customer over the entire period of your relationship.
While CAC shows how much you spend to attract a new client, CLV presents how much money you can earn from this relationship.
How to calculate CLV?
There are different formulas, but the most popular one is:
CLV = Average Purchase Value x Average Purchase Frequency x Average Customer Lifespan
Example:
- The average purchase from your company is $10,000
- On average, other businesses buy from you 2 times a year
- The average customer relationship lasts 5 years
Your CLV is $100,000 ($10,000 x 2 x 5)
Why CLV matters in B2B marketing:
- CLV adds an important context to CAC. It tells you whether your investments make sense in the long run. The healthy CLV-to-CAC ratio is (at least) 3:1.
- By comparing CLV across different customer groups, you can focus on the most valuable segments.
03 Sentiment Analysis
Sentiment Analysis presents how people feel about your brand, products, services, or campaigns.
In B2B marketing, reputation and trust are critical.
According to the 2025 B2B Marketing Benchmark report, 94% of marketers agree that trust is the key to B2B success.
It’s logical: business decision-makers usually spend a lot of money on one transaction, so they must be careful when choosing companies for partnerships.
And sentiment analysis is one of the most effective ways to discover the real reputation of a potential partner.
How to measure Sentiment Analysis?
Measuring sentiment is possible only with a dedicated media monitoring tool, like Brand24.
It automatically tracks and analyzes brand mentions published online, including:
- Social media channels (Facebook, Instagram, X, LinkedIn, YouTube, TikTok, Reddit, Telegram, Bluesky, and Twitch)
- Non-social sources (news sites, blogs, podcasts, video sites, review platforms, newsletters, etc.)
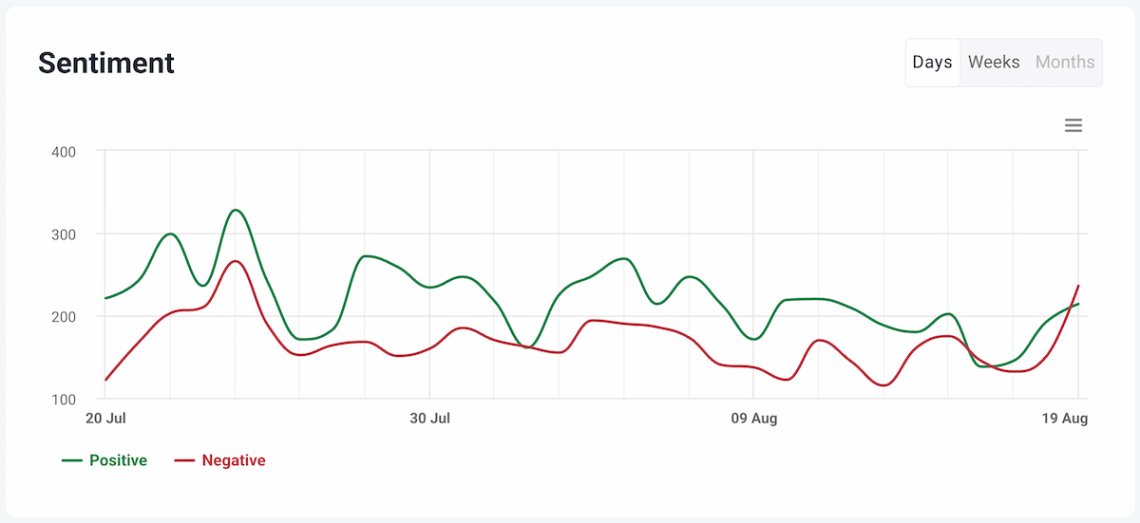
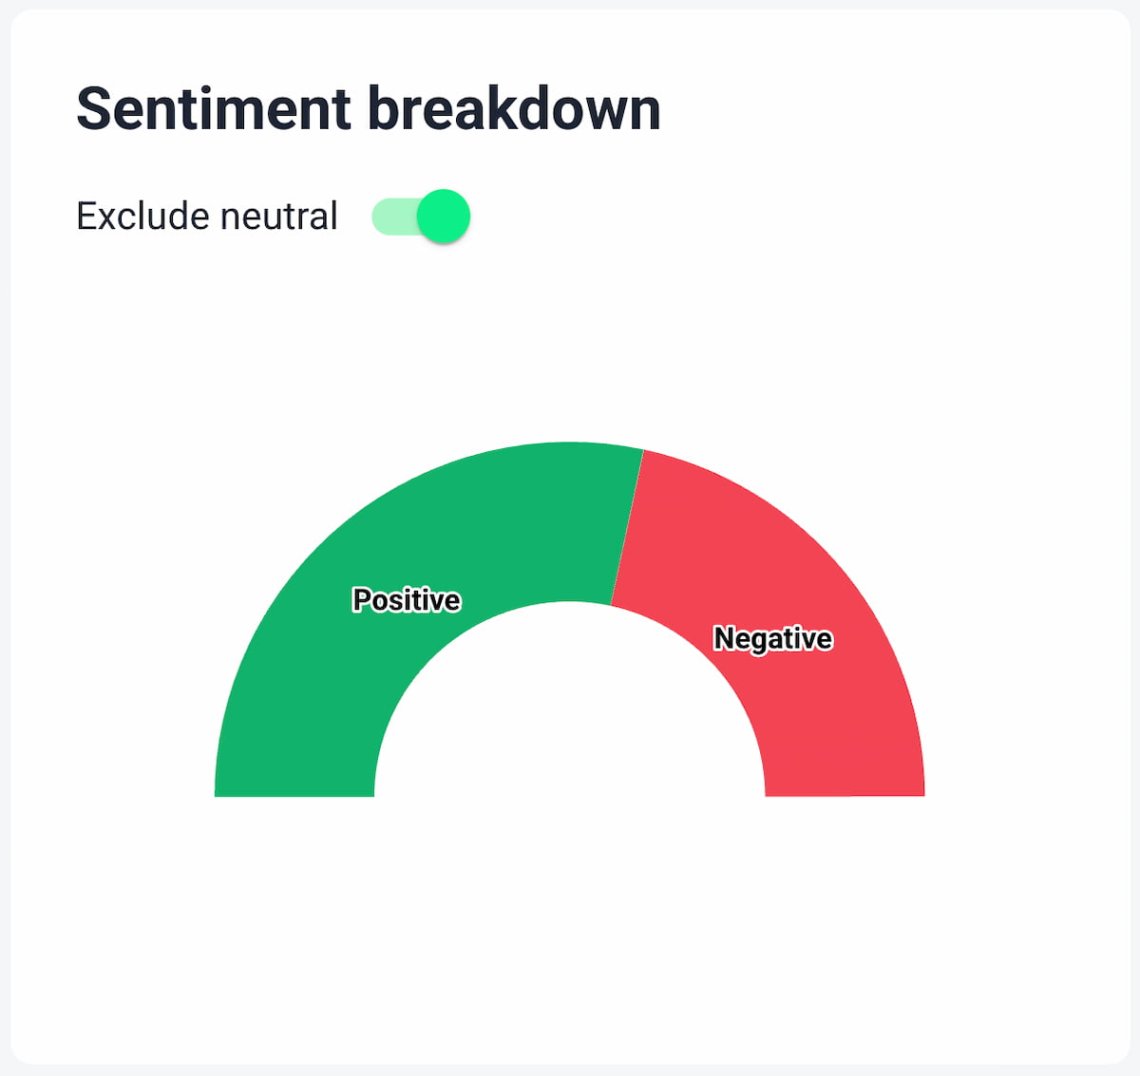
It allows you to easily check multiple elements influencing your sentiment:
- Sentiment trend by days, weeks, months, and years
- Most impactful sources of your positive and negative mentions
- Sentiment breakdown, so the share of positive, negative, and neutral mentions
Why Sentiment Analysis matters in B2B marketing:
- Reputation management – it helps to identify key channels impacting your reputation and work on them strategically.
- Crisis prevention – spotting early warning signals can protect your B2B business from emerging brand crisis.
- Product development strategy – recurring negative feedback is a priceless insight into customer’s pain points you can adress.
04 MQL To SQL Conversion Ratio
MQL to SQL Conversion Ratio measures the percentage of Marketing Qualified Leads (MQLs) that progress to become Sales Qualified Leads (SQLs).
| MQL | SQL | |
| Definition | A lead that both fits your target customer profile and shows a serious interest in your product / service | A lead that is ready for direct sales outreach and evaluation |
| Stage in Funnel | Mid-funnel (awareness -> consideration) | Low-funnel (consideration -> decision) |
| Qualification criteria | Based on demographics, business type, and engagement | Based on intent signals and fit |
| Source of acquisition | Marketing lead scoring | Determined by the sales team |
| Goal | Ensuring that the lead is worth passing to sales | Ensure the lead is ready for the sales process / deal |
In other words, the MQL to SQL Conversion Ratio shows how effectively your marketing team generates quality leads that meet sales criteria and are ready for direct sales engagement.
A higher ratio indicates that marketing efforts attract the right audience. On the contrary, a lower ratio may suggest a gap in targeting, lead generation, or a wrong connection between marketing and sales.
How to calculate MQL to SQL Conversion Ratio?
MQL to SQL Conversion Ratio (%) = (Number of MQLs / Number of SQLs) × 100%
Example: If 1,000 MQLs were passed to sales in a quarter and 250 are accepted by sales as SQLs, the conversion ratio is 25%.
Why MQL to SQL Conversion Ratio matters in B2B marketing:
- Optimizes long cycles – as B2B deals often require weeks (or months) of moving leads down the sales funnel, it ensures that your sales team invest their time in the most promising prospects.
- Filters out noise – not every lead is worth a time of your sales team.
- Builds bridge between marketing and sales – and that’s super-important in B2B model as it maximizes effectiveness of your business efforts.
05 Brand Mentions
Brand Mentions present the number of times your brand, company, product, or service is referenced in online channels like social media, websites, review platforms, and other sources.
Brand visibility is crucial for building the awareness a B2B company needs to appear in a prospect’s radar.
In fact, according to the Tracksuit and TikTok research, brand known by 4/10 people is 43% more efficient than one known by 3/10.
Tracking brand mentions allows you to understand how often your business contribute in industry conversations and whether your marketing campaigns are effectively increasing visibility.
How to measure Brand Mentions?
Tracking and analyzing brand mentions is pretty easy, if you use the media monitoring tool like Brand24.
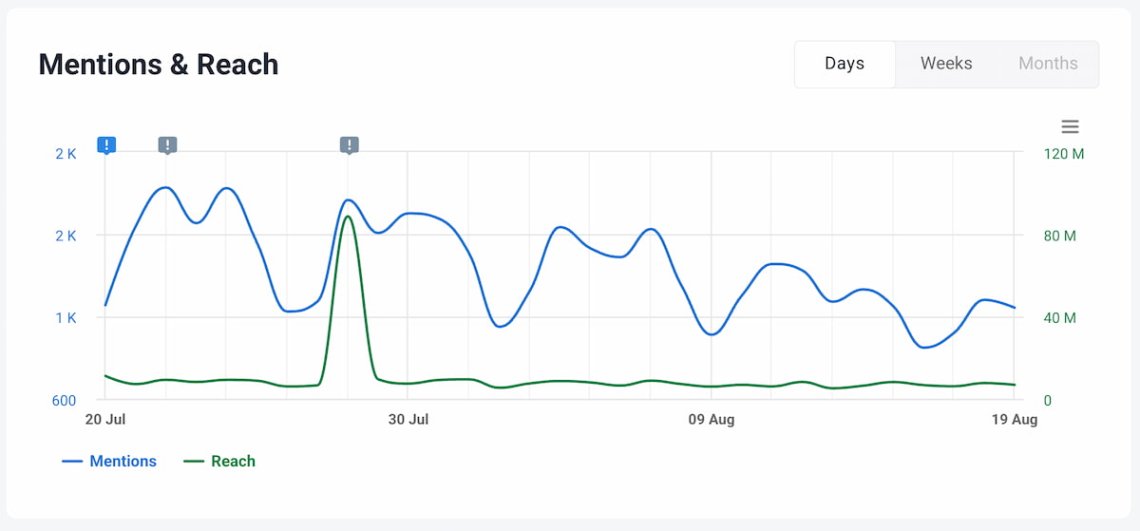
It allows you to:
- Measure the total volume and reach of your brand mentions
- Discover the most important mentions about your brand and their impact
- Identify channels where your brand is most visible (i.e., LinkedIn, industry news sites, discussion forums, etc.)
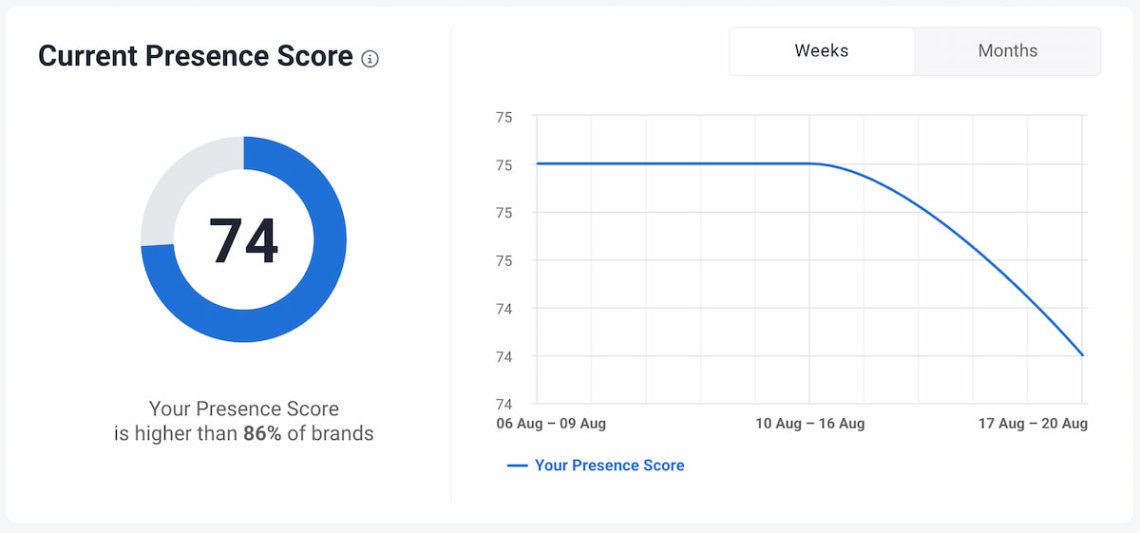
- Track the current state of your brand awareness with Presence Score.
Why Brand Mentions matter in B2B marketing:
- Show whether your brand is present in the early discovery stage of the buyer journey
- Uncover market opportunities by showing where people discuss your brand or industry
- Provide a competitive benchmark when you analyze your competitors’ mentions.
- Higher possibility of appearing in AI search results as brand mentions are one of the key indicators impacting your AI Brand Exposure.
Speaking about it…
06 AI Brand Exposure
AI Brand Exposure indicates your brand’s overall presence in responses to product, service, or brand-related prompts typed into AI chatbots and generative AI search engines such as ChatGPT, Gemini, Claude, or Perplexity.
As more and more professionals turn to AI tools for research and decision-making, your business’ AI search visibility is becoming a crucial part of B2B marketing analytics.
Some say that AI Brand Exposure is the new SEO.
Because, just like SEO determines whether and how your company appears in Google results, AI Brand Exposure shows whether your brand is recommended (or ignored) by AI chatbots.
How to measure AI Brand Exposure?
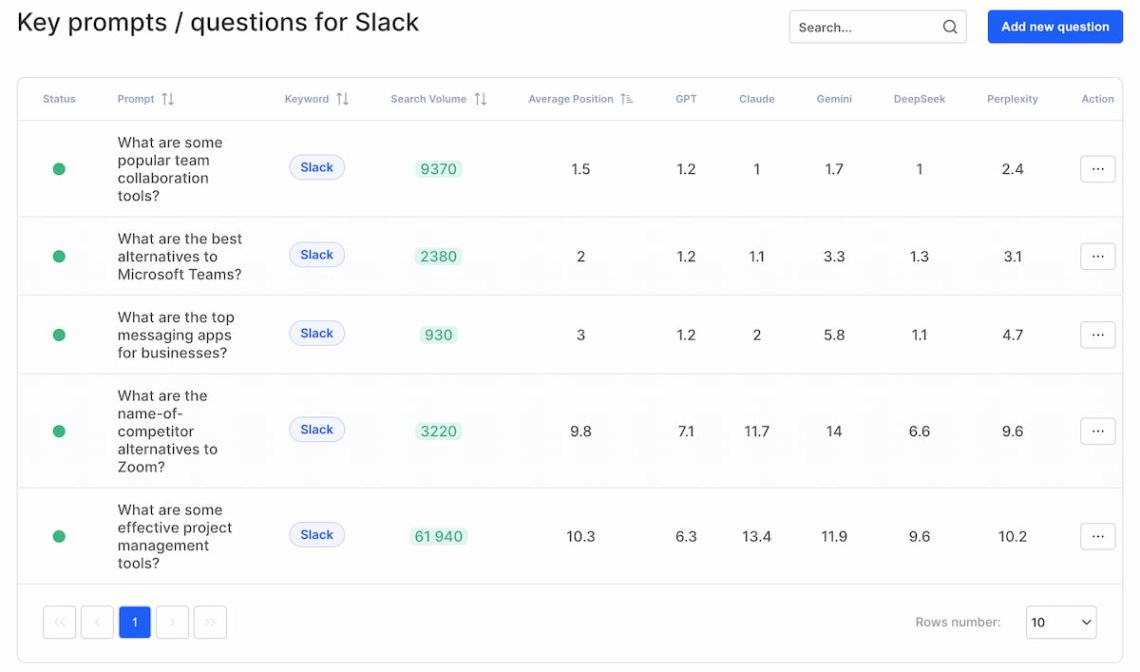
The best way to measure your brand exposure in AI chatbots is by using dedicated software like Chatbeat.
Chatbeat is an AI visibility monitoring tool that tracks how often and in what context your brand is suggested in responses to search prompts within generative AI models such as ChatGPT, Google Gemini, Claude, Perplexity, and others.
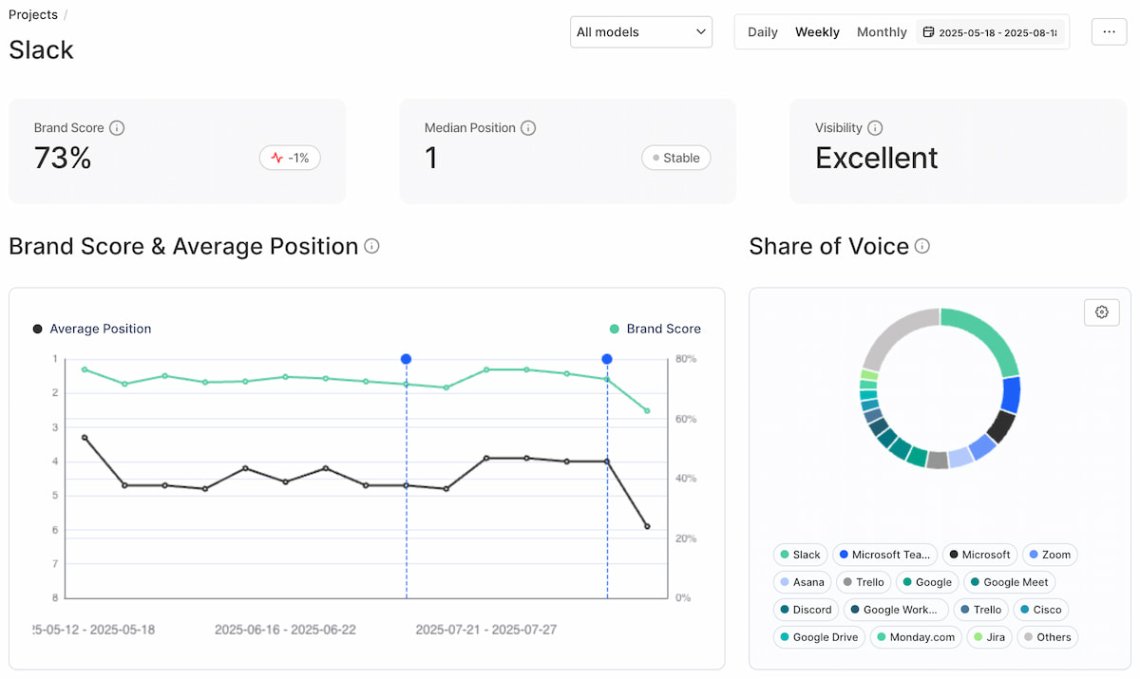
In other words, it shows you whether AI-powered platforms – which are rapidly becoming go-to research tools for professionals – recommend your brand and your competitors for business-related prompts.
Why AI Brand Exposure matters in B2B marketing:
- Increased visibility in AI-driven research channels – the rapidly growing sector where professionals seek informations and recommendations.
- Higher trust and credibility – when your brand is recommended or suggested by generative AI, it strengthens your position as an industry authority.
- Future readiness – as AI search is projected to constantly grow, focusing on it now creates a strong competitor advantage.
07 Return on Marketing Investment (ROMI)
Return on Marketing Investment (ROMI) measures how much revenue your marketing efforts generate compared to their costs.
In other words, it answers the question: “How much do we get back for every dollar we spend on marketing?”.
ROMI is one of the most crucial B2B marketing KPIs as it directly connects your campaigns with what’s matter the most in business – money.
By tracking it, you can discover which marketing activities actually contribute in business growth and those that simply consume resources.
How to calculate ROMI?
ROMI = 100% x (Marketing Income − Marketing Costs) / Marketing Costs
Example: If your yearly spend on marketing is $50,000, and yearly income from marketing is $150,000, your ROMI is 100% x (150,000 – 50,000) / 50,000 = 200%.
In other words, for every $1 invested in marketing, you receive an extra $2.
Why ROMI matters in B2B marketing:
- Justifies the budget – by demonstrating that marketing is a revenue generator.
- Optimize resources – by identifying which channels, campaigns, or strategies deliver the best financial outcomes.
- Supports long-term planning – tracking ROMI trends over time helps in making data-driven decisions.
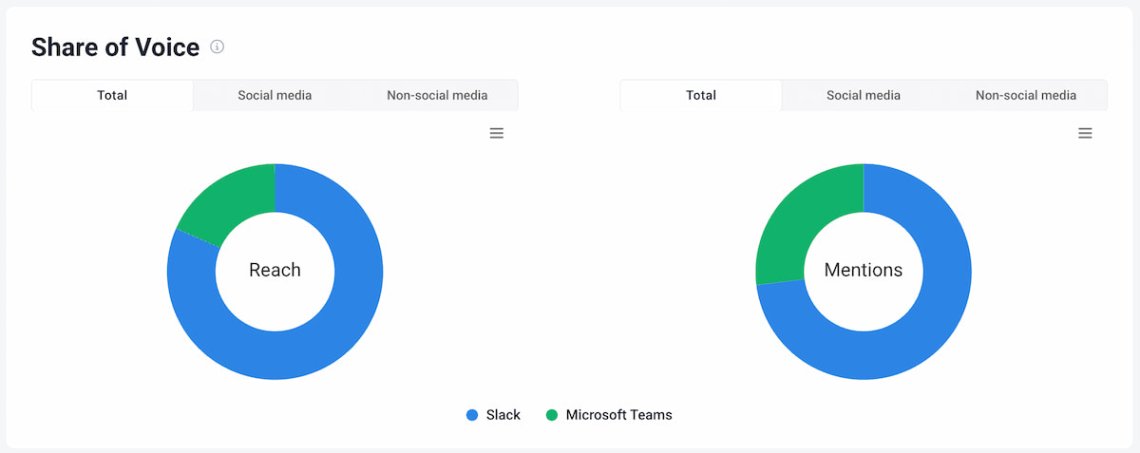
08 Share of Voice (SOV)
Share of Voice (SOV)presents how visible your brand is compared to your market rivals by showing what percentage of online discussions, coverage, and reach belongs to you.
Measuring your B2B marketing performance requires a reference point. And here, Share of Voice enters the stage.
In B2B, when potential customers spend a lot of time researching before making a choice, a strong SOV strengthens your chances of being considered.
The higher your Share of Voice, the greater the probability your brand will appear on a shortlist.
How to measure SOV?
The formula for SOV is pretty simple:
SOV = (Your Brand Mentions or Reach / Total Brand Mentions or Reach of Chosen Competitors) × 100%
As you see, the main challenge is to know both yours and your competitors’ brand mentions or reach.
Fortunately, you can easily discover it in Brand24. You just need to create a project for your competitor, open the “Comparison” tab, and scroll down to see Share of Voice charts.
Why SOV matters in B2B marketing:
- Competitive benchmarking – it gives you a real insight into your brand performance agains direct rivals in terms of awareness and visibility.
- Market positioning – a higher SOV correlates with increased chances of being noticed by B2B decision makers.
- Campaign performance – tracking SOV before, durign, and after a campaign shows if it increses your visibility compared to market rivals. It also can guide your future campaigns.
Conclusion
B2B marketing metrics guide you through the complicated world full of long sales cycles, multiple decision-makers, and relationship-based transactions.
The trick is to focus on those who make the real difference.
Otherwise, you will end up drowning in numbers that may look impressive in PowerPoint presentations but complicate things rather than help you make better decisions.
The proper set of metrics should keep you sharp, show what drives growth, and what consumes resources.
Mix the quantity metrics – like CAC, CLV, MQL to SQL Conversion Ratio, or ROMI – with the quality ones, such as Sentiment Analysis, Brand Mentions, or SOV.
Also, do not forget about AI Brand Exposure – the new must-watch KPI in the AI-driven era.
With this set, you can cut through the noise and bring your B2B marketing to the master level.
Final thoughts:
- Metrics serve decisions – not decorate dashboards.
- No metric works in isolation – they only make sense when you consider them together.
- Smart measuring B2B marketing metrics requires the right tools, like Brand24 or Chatbeat.
- In B2B, data should always focus on clarity, not complexity.
Start the free 14-day Brand24 trial and track the relevant B2B marketing metrics!

Article Reviewed by