Table of contents
How to Create a Social Media Report? Free Templates & Examples
Feel the weight of showing all social media efforts? Creating a social media report is one of the tedious tasks. Juggling social media campaigns across multiple platforms… but doesn’t have to be any more!
Curious how to create a social media report? What to include in it? And not to inundate yourself and your audience with a lot of information?
In this article, I will show you how to make the reporting process more enjoyable! What social media KPIs should be chosen for key findings, and how should templates be used to turn them into monthly reports?
Quick Summary
- Social Media Analytics is the process of tracking, measuring, and analyzing social media data. It is the backbone of any effective social media reporting. It assists in spotting what’s working, what’s not, and why. Instead of social media analytics, it’s just guesswork.
- Collecting, visualizing & presenting data: Creating a social media report is not just about collecting numbers, but putting them in a way that actually simplifies working with them. After all, numbers are the foundation of a thoughtful strategy!
- Insights, plans & recommendations: The clue is turning these numbers and visualizations into clear insights, conclusions, recommendations, and plans. That’s what makes reports essential for action.
What is a social media report?
In short, the social media report is a comprehensive document that collects and analyzes all essential information about the brand’s activities across all social media channels over a particular period.
I like to think of this as a health check tool.
I may be overlooking a lot to do without regularity. The main point of social media reports is to provide actionable insights that:
- Drive your social media strategy
- Boost your social media performance
- And meet your business goals
Here you can see an example of a social media report generated in just a few seconds with Brand24:
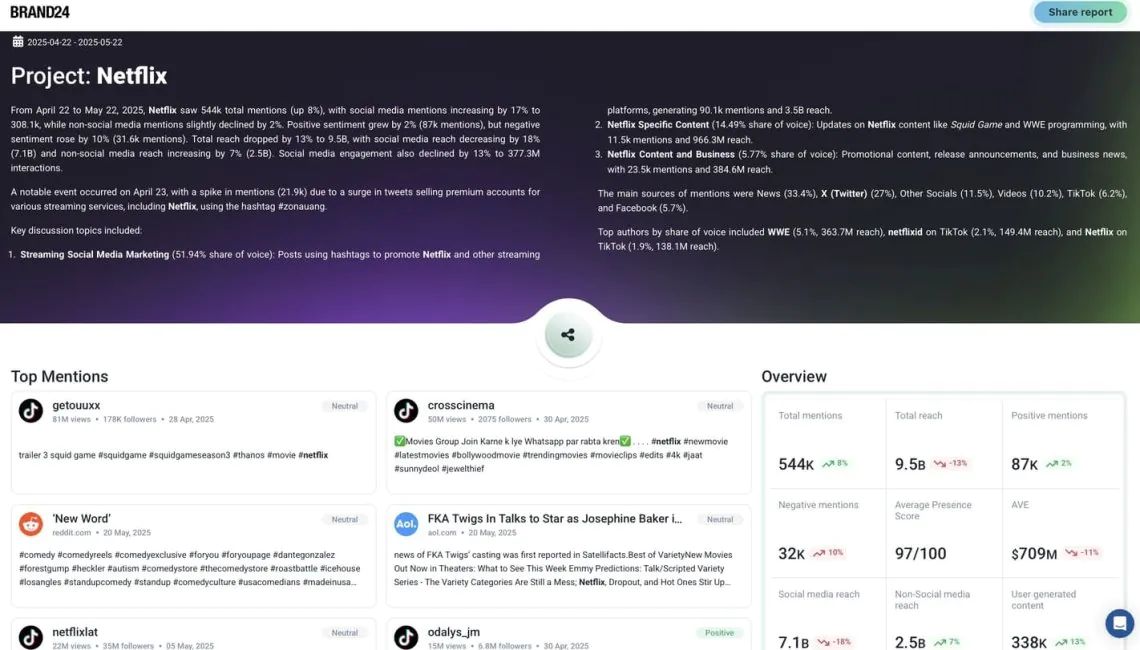
Various types of social media reports are available. The specific metrics and insights you collect will depend on your goals and the purpose of your social media strategy.
This article will cover 8 essential steps to create a social media report.
No matter your social media objectives, you’ll find practical tips, real examples, and ready-to-use social media report templates for multiple platforms. They’re easy to personalize and perfect for saving time on social media efforts!
Create custom reports for PR, marketing or dashboards!
3 Social Media Analytics Report templates to use, personalize, or inspire from
Here are three ready-to-use templates you can download, customize for your brand, or simply use as an inspiring starting point:
📊 Click and download free templates:
⬇️ [Marketing] Report Example
⬇️ [Marketing] PDF Report
⬇️ [Marketing] Competitor Comparison Report
Enjoy, and save yourself a few hours of work. You’ve earned it!
Social listening goes beyond surface-level metrics. It captures real-time social media, news sites, blogs, and forums conversations. Helping you uncover audience sentiment, spot trends, and monitor competitors in ways native platforms can’t.
It delivers insights that aren’t always visible at first glance, helping you make faster, smarter decisions.
Learn more about Brand24’s social listening analytics in real social media case studies!
How to create a social media report? 8 steps
01 Choose your goals
A social media goal is what you want to achieve through your efforts on different platforms.
Are you looking to increase conversions? Maybe you want to educate people about your product?
Or simply boost brand awareness?
Your social media goal is your starting point for everything you do online. It guides your social strategy, shapes your content, and ultimately helps determine what goes into your social media reports. But here’s the thing: goals are only helpful if set wisely.
To do this, I like to use the SMART technique. It’s a simple but effective way to shape clear, focused, and achievable goals.
Set SMART Goals for Social Media Reporting:

- Specific: Clearly define your goal. Avoid vague goals like “get better at social media.” Instead, say, “increase Instagram engagement.”
- Measurable: Attach numbers to your goals to track success, like “gain 500 new followers” or “increase CTR by 10%.”
- Attainable: Make sure your goal is realistic based on your resources and past performance.
- Relevant: Your goal should align with your marketing strategy and business objectives.
- Time-bound: Set a clear deadline, like “within 30 days” or “by the end of Q2.”
Here you can find examples of SMART business goals:
Increase average post engagement rate by 15% in the next 30 days by optimizing post timing and using more video content.
Increase brand awareness by growing Instagram followers by 20% over the next quarter through influencer partnerships and consistent Stories.
Drive website traffic from Facebook by 25% in the next 60 days by sharing blog content and using UTM links for tracking.
02 Consider the report’s target audience
Once I have my goal, I think about who I am preparing this report for.
Depending on that, I will shape my narrative and communication and choose the indicators necessary to present it. Using marketing jargon is fine if I’m talking to a marketing team. But if the report is for another team, it’s natural that they won’t understand it, and different observations could be key.
It’s up to me to prepare a social media report that is clear and understandable to my key stakeholders.
How to do it?
First, I asked myself what the key message would be for them. What do I want to achieve by presenting this report?
Then, I prepare a map of topics I want to cover on social media platforms. Let’s say the first draft shapes the report’s narrative.
Then I can go further.
03 Choose key metrics
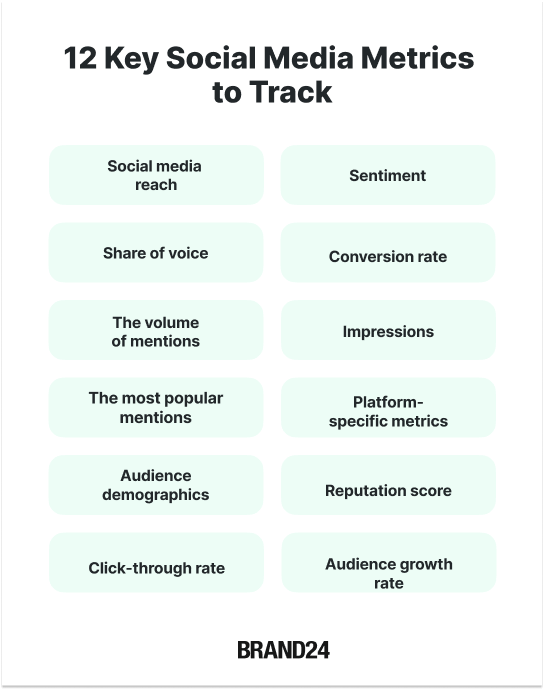
Knowing my goal and audience, I can select key performance indicators.
Choose only those indicators that really influence your goal. Not all numbers are equally important in different contexts. For instance,
If the report is about launching a new campaign, the essential metrics will be click-through rate, engagement, conversion, etc. However, if your goal is to increase brand awareness, prioritize metrics such as reach, mentions, and audience growth.
How I do it:
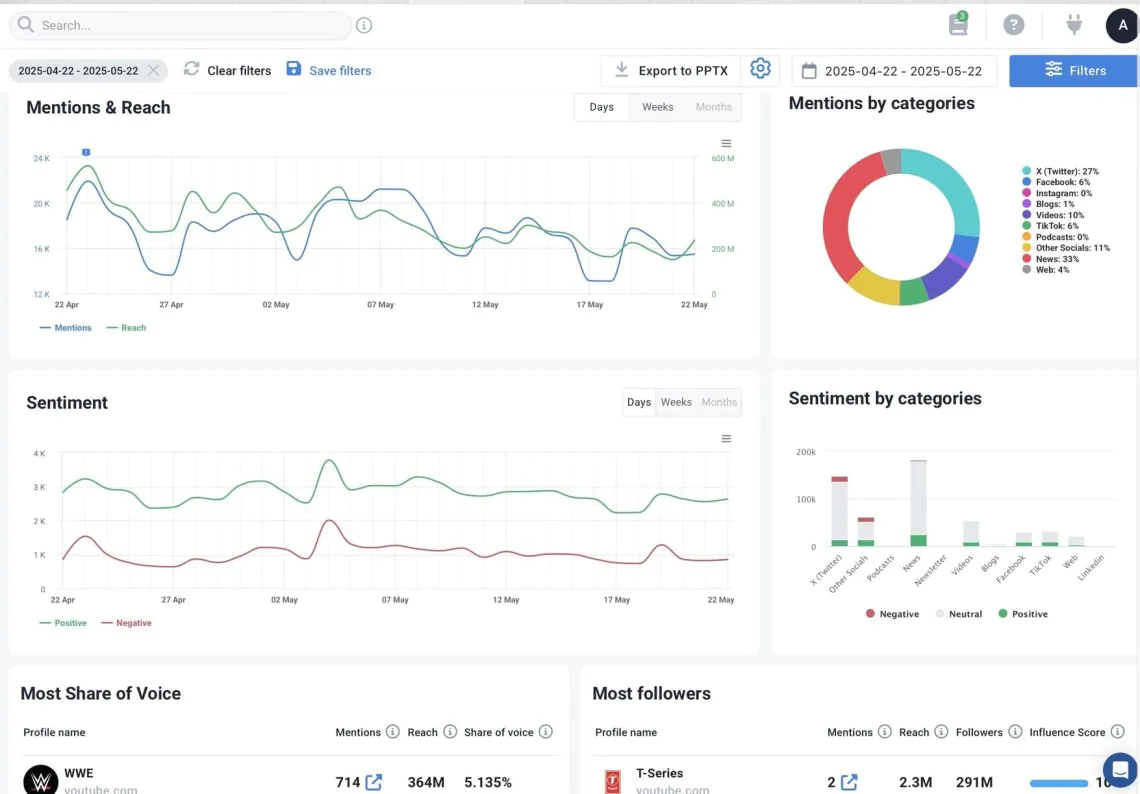
A good social media reporting tool should make gathering data across multiple platforms easy and fully customize your reporting periods, whether you’re preparing quarterly reports, monthly summaries, or annual overviews.
I do like to use several tools to capture the full scope of my performance data.
For example, I use Brand24 to monitor sentiment and mentions and to reach across social media channels. It’s especially useful for capturing platform-specific metrics and understanding how people talk about my brand.
To assess how social media drives website traffic and conversions, I turn to Google Analytics, where I also gather insights into audience demographics.
Then, I combine everything in Looker Studio or Whatagraph, creating clear, well-structured reports that deliver real value, without losing context.
Try the Brand24 tool. Create social media reports!
04 Remember about data visualizations
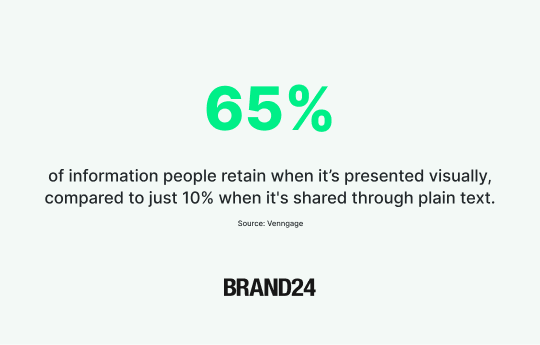
Visualisation is the secret weapon of any effective social media report.
Visuals bring clarity to insights and help tell the story behind the numbers. Especially powerful when presenting social media reports to stakeholders, clients, or cross-functional teams.
Why?
How I do it:
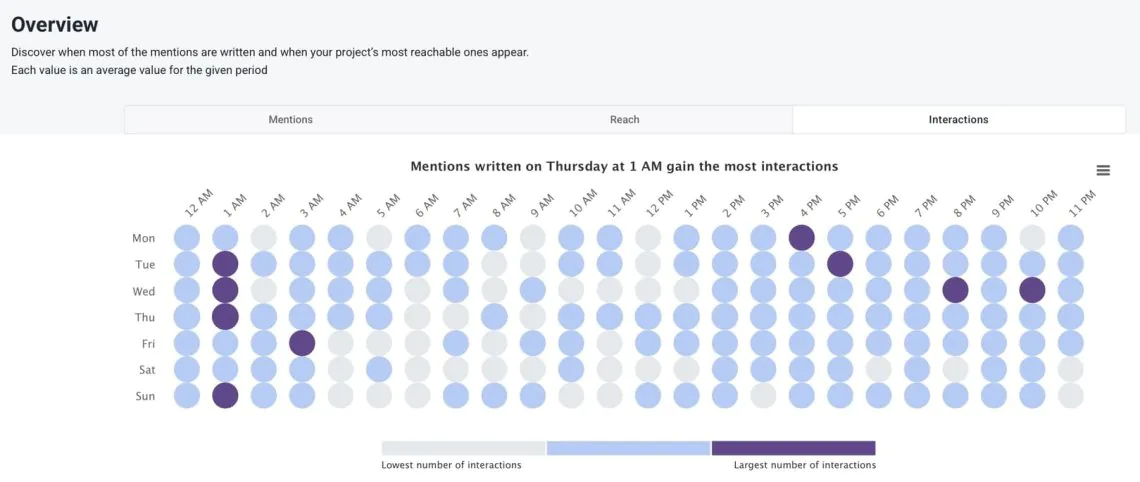
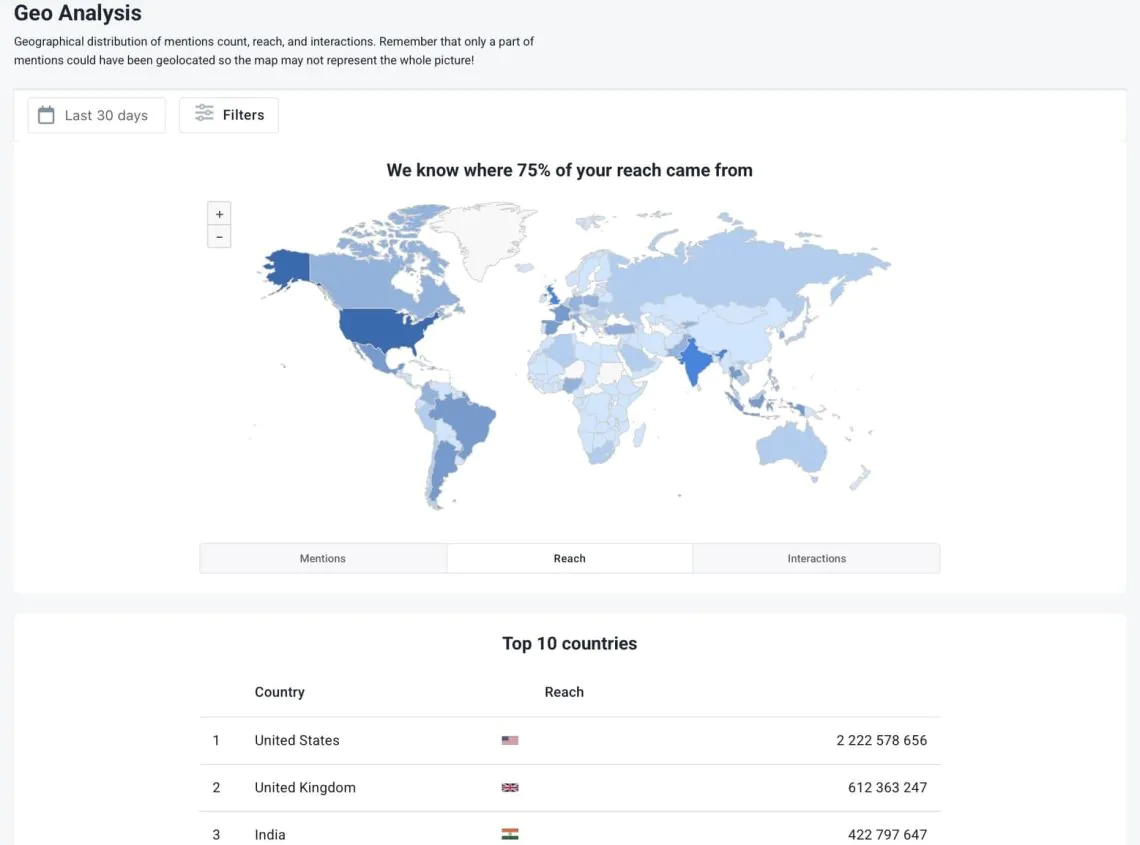
I chose a social media report template that offers different visuals. It’s even better if the tool provides an easy option to personalize and customize them. By simply changing the colors, you can show your brand identity.
Try the Brand24 tool. Create social media reports!
Helpful visuals to include in your social media report:
- Charts, graphs, and diagrams
- Infographics
- Images and screenshots
- Maps
05 Present campaign insights
Raw data by itself is not helpful.
You can have all the social media data & visualisations in front of you and still wonder: “What does this mean for my social media analytics?”.
The real purpose of a social media report is not just to show stats, but to provide valuable insights that will shape your entire content strategy and guide your future campaigns into more user-generated content.
For instance, I’m sure you heard of the Netflix Tudum event. Let’s check what the audience sentiment is about it!

Instantly filter out the noise and focus on what matters to the campaign. For example, by typing “tudum” in Brand24, I can access all mentions where this keyword appears. Whether it’s in posts, comments, or articles.
This allows me to:
- Understand the context in which the brand is being discussed
- Uncover long-term trends and preferences
- Track sentiment explicitly tied to that term
Get the results of any social media campaign!
Let’s check it deeper. With Emotions Analysis, you can find out precisely how people feel about your brand, what emotions are around the direct topic in real-time.
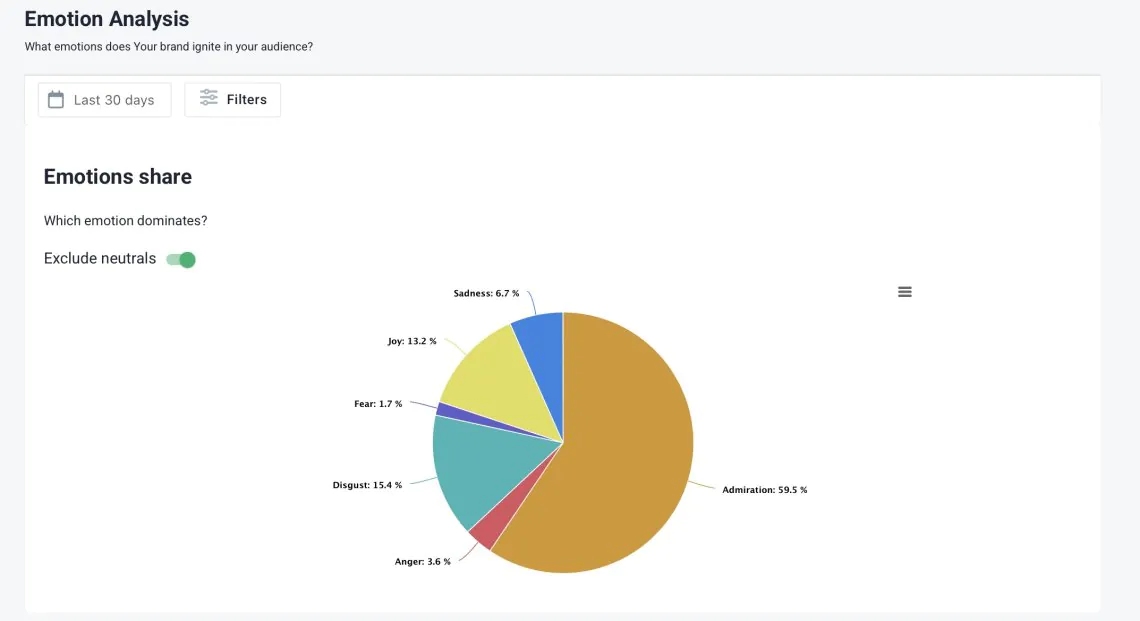
Look at the chart example: the orange in the bar graph represents the emotion of admiration, while the blue color indicates disgust.
When you see orange starting to overtake blue, that’s a positive sign!
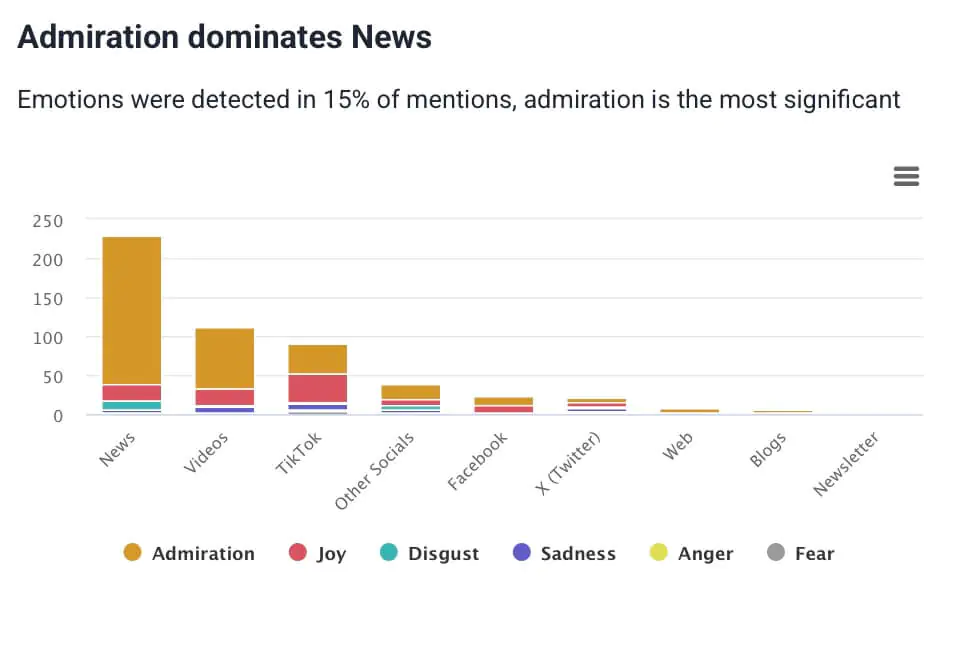
Analyzing those emotional mentions opens the door to deeper, actionable customer insights. It’s not just about numbers anymore.
It’s about understanding how people feel about your brand or new product and using positive and negative feedback to move forward smarter.
Find out how your audience feels!
06 Compare data with previous periods
Many social media report templates overlook data trends from previous periods.
Without a time reference, it’s hard to judge whether social media performance is improving or declining. Raw numbers may look great, but they don’t tell the whole story; context is everything.
That’s where Brand24’s Comparison tab becomes invaluable.
With just a few clicks, I can answer critical questions like:
- Are my efforts gaining traction?
- Is this campaign performing better than the previous one?
- What is the sentiment of the audience from month to month?
This means I can quickly separate each phase of a social media campaign and compare them with just a few clicks.
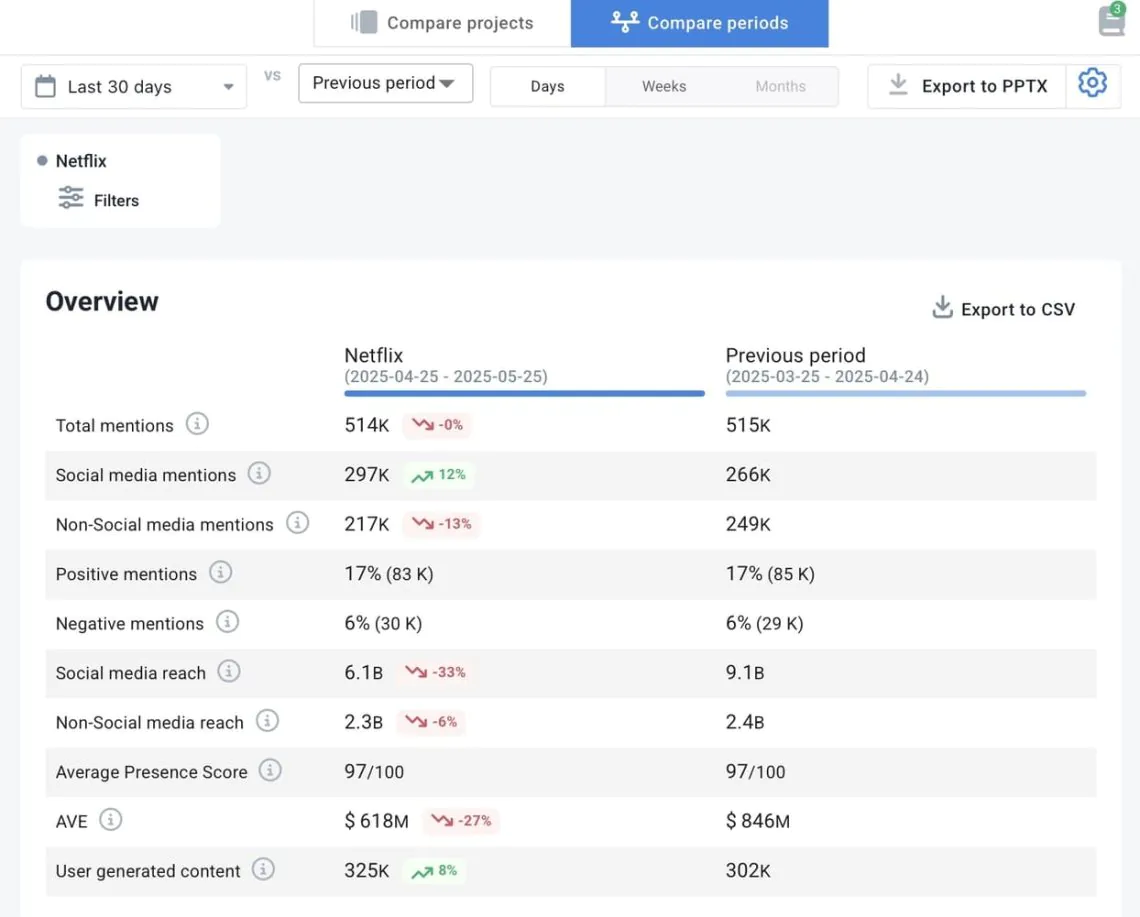
I compared Netflix’s performance during the TUDUM campaign to the previous 30 days.
Social media mentions and user-generated content are up, showing strong engagement. While both positive and negative mentions dipped slightly, that’s common with high-reach campaigns.
Create your social media reports!
07 Compare data with rivals
Tracking my social media performance over time gives me a clear view of how my social media efforts are doing, but at some point, I need to zoom out and ask:
What’s happening in the industry?
How are my competitors performing?
Are there any new industry trends I might be missing?
It might seem like my results are increasing constantly, and everything looks great. But if my competition is growing twice as fast, I’m not winning, I’m falling behind.
That’s where competitive analysis becomes essential.
How I Do It?
I can create projects for my brand name, claims of specific marketing campaigns, hashtags, or even individual products. It depends on my needs.
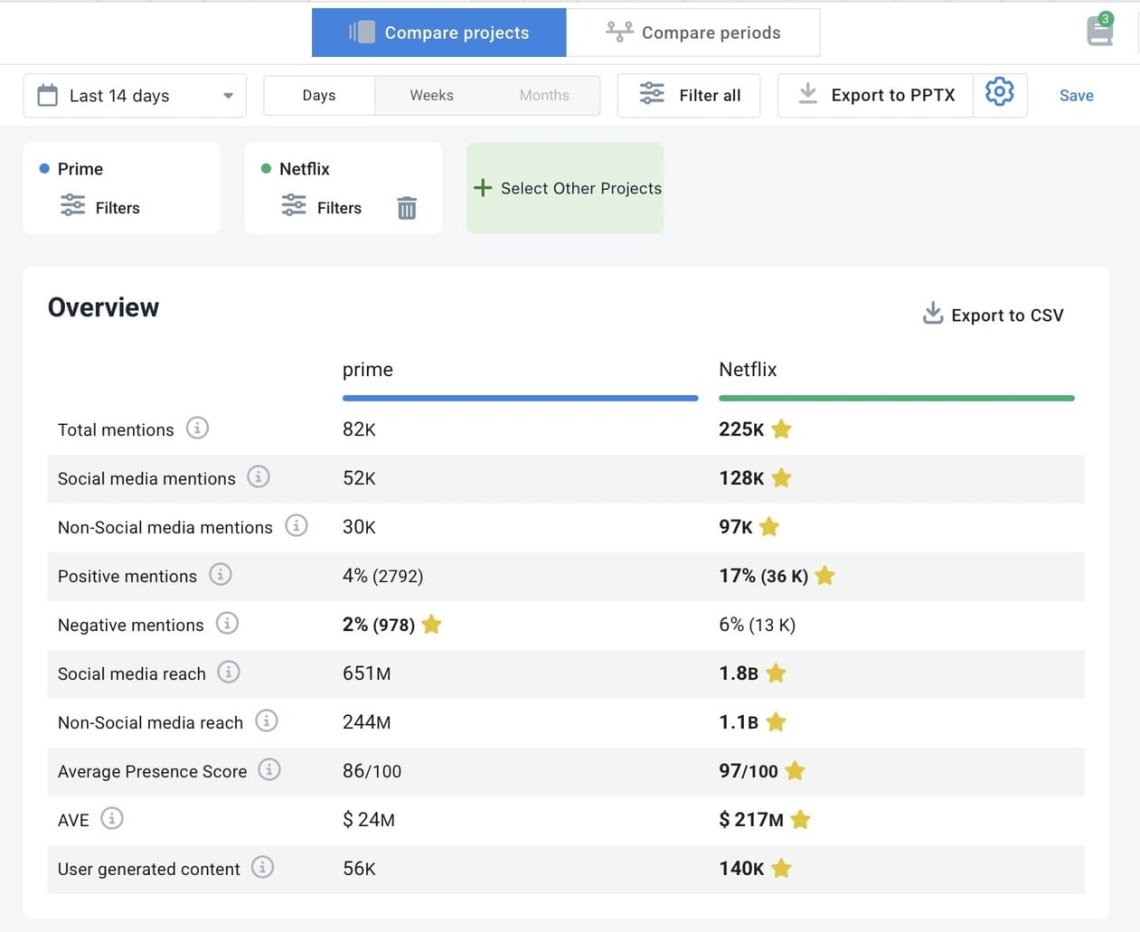
Then I set up additional projects for each competitor I want to monitor.
This way, I can:
- Track their social media performance in real time
- Monitor mentions, sentiment, and reach
- Compare everything directly on one dashboard
It lets me monitor my competitors closely, which is especially valuable for competitor analysis. I gain deeper audience insights and spot opportunities to improve my strategy there.
Check out how your competitors are doing!
08 Add summary
These steps might not seem obvious initially, but what’s the point of a social media report if it doesn’t lead to action?
The real value comes from drawing practical conclusions and turning them into clear next steps. This saves stakeholders time and highlights the key takeaways and social media metrics that truly matter.
A well-structured social media report template makes that process easier and more efficient. It doesn’t just summarize the past and guide the future by answering the following questions:
- What should I keep doing?
- What needs to change?
- What’s the next best move?
How I do it:
First, I review the entire document to ensure I haven’t missed any valuable insights.
Then, I open a new file or note to write a short, straightforward narrative that includes:
- Key findings
- Observations and identifying trends
- Strategic suggestions or ideas
Next, I run everything through Brand Assistant to double-check for gaps. A quick prompt like “Give me a monthly summary” or “Create quarterly reports” helps me catch anything I missed.
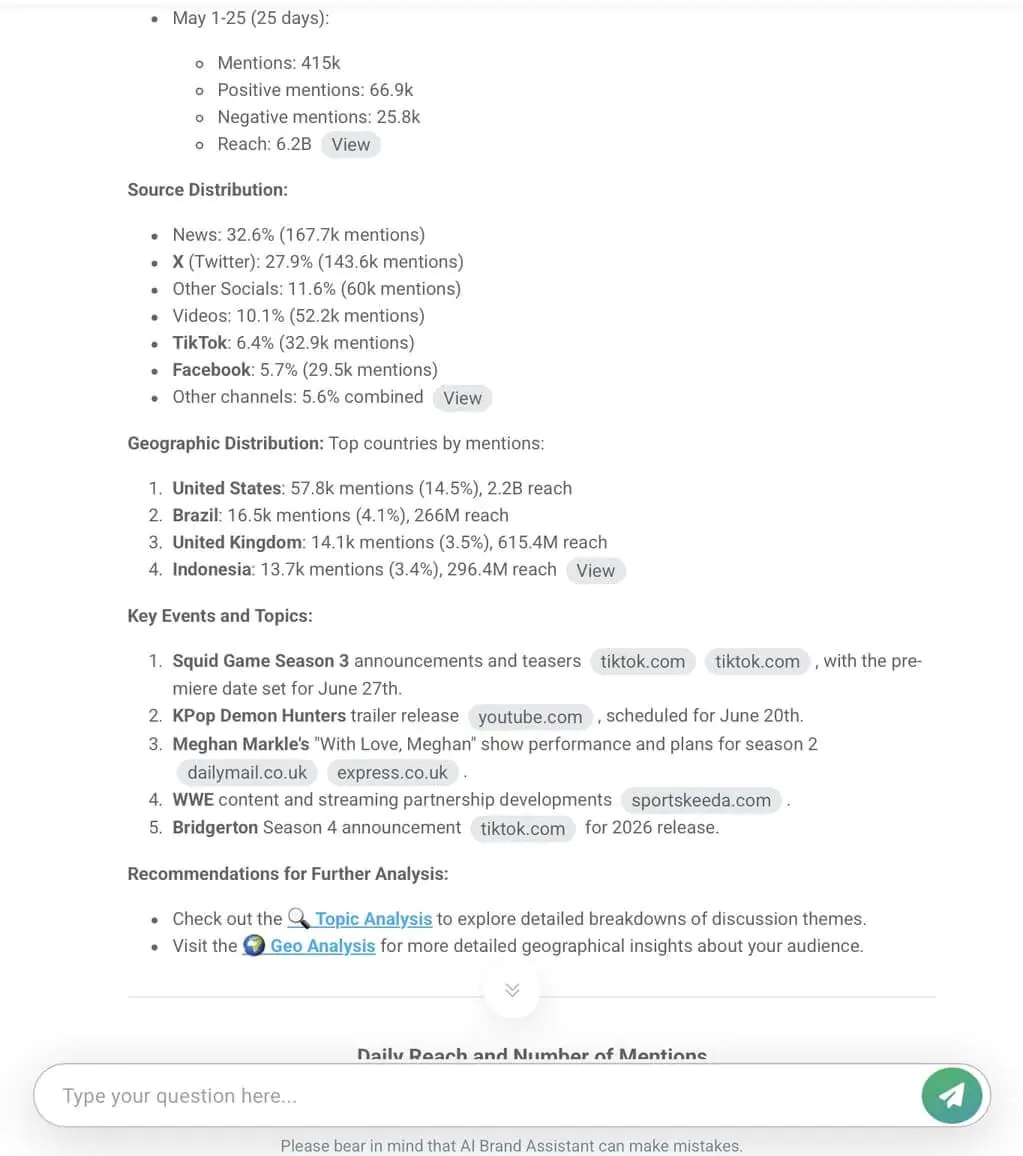
Brand Assistant delivers answers based on your internal project data, not just general knowledge. That makes it valuable for performance analysis, audience insights, and actionable recommendations.
Let AI Summarize the Conversation Around Your Brand
Here’s a list of social media prompts you can use with AI marketing tools:
8 AI Prompts for Social Media Reporting
- “Provide a summary of our brand’s social media performance over the past 7 days on Instagram, Facebook, and LinkedIn. Include total reach, engagement rate, top 3 posts per platform, and a one-line insight for each.”
- “List the 3 posts with the highest engagement last week (likes, comments, shares). Explain what likely contributed to their success: timing, format, topic, or visual?”
- “Which hashtags generated the most reach and engagement across our social posts in the past month? Group them by platform and suggest 3 new hashtag ideas based on trends.”
- “Analyze all brand mentions from last month across Twitter, TikTok, and Instagram. Provide sentiment breakdown (positive/neutral/negative), and flag any spikes with context.”
- “Summarize the most common negative comments or feedback themes about our brand this month. Include sample quotes and suggest 2 concrete actions to address them.”
- “Compare our social media KPIs (reach, impressions, engagement rate, click-through rate) this month vs. last month. Highlight what improved, what declined, and the likely causes.”
- “Write a concise, visually friendly summary of our monthly social media performance. Use bullet points and emojis to make it suitable for Slack or internal email updates.”
- “Scan Twitter and TikTok for emerging trends in our industry (e.g., wellness, tech, fashion). List 3 rising topics or formats we should consider, with example posts and engagement data.”
![AI Prompts for Social Media: [full list]](https://brand24.com/blog/app/uploads/2023/05/AI-Prompts-social-media-report.jpeg)
Ask Your Brand Assistant Anything!
Social media report template & examples
Social media reports are essential. They help you track growth, evaluate performance, and align your strategy. But let’s be honest: they can be time-consuming, especially when multiple stakeholders await updates.
That’s where a solid social media report template makes all the difference. Below are key examples and downloadable templates to save time, stay organized, and deliver important insights.
Competitive analysis example
Always include detailed competitor insights in your social media report.
Why? Because your performance only makes sense when viewed in context.
With Brand24’s competitor reports, it’s easy. You get top KPIs, like social reach, sentiment, and share of voice, right up front.
My favourite feature is that I can customize a report by adding my logo and colors to keep it consistent with the company’s.
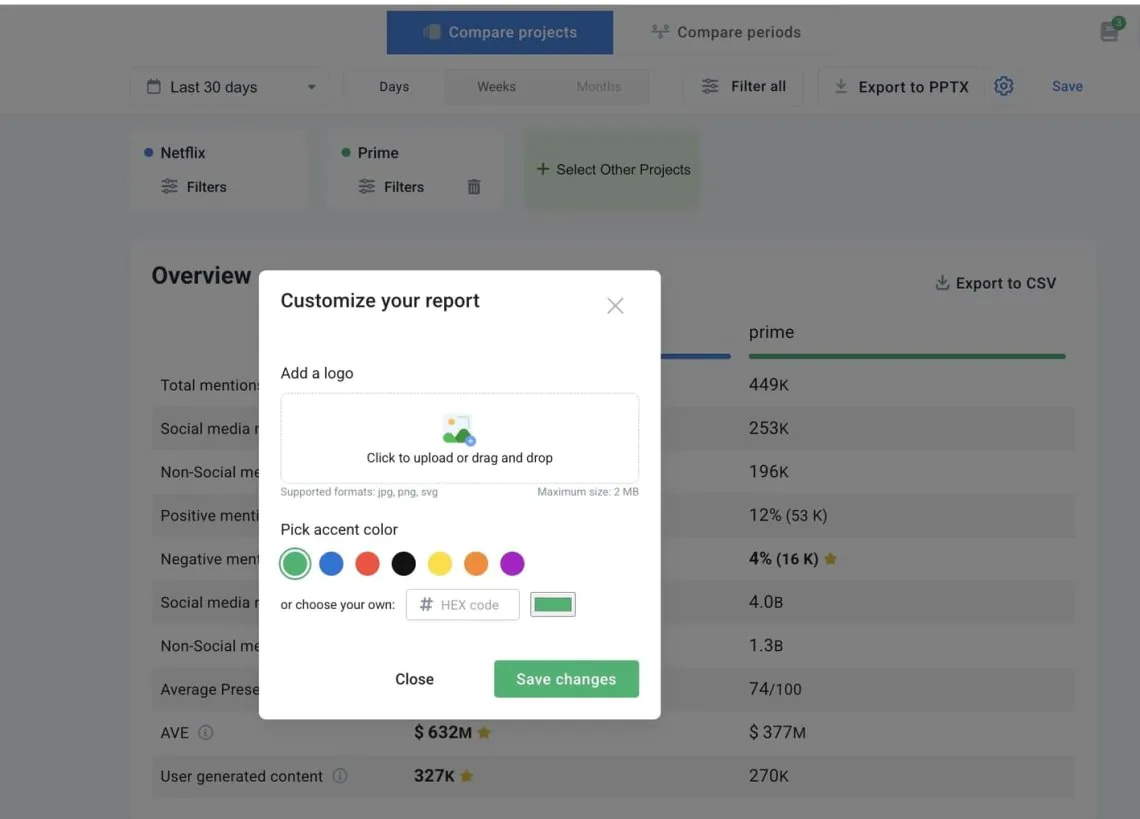
Customize your social media report!
Campaign reporting
Social media managers know how important it is to track new campaigns, create social media reports, and gather relevant performance data and audience insights.
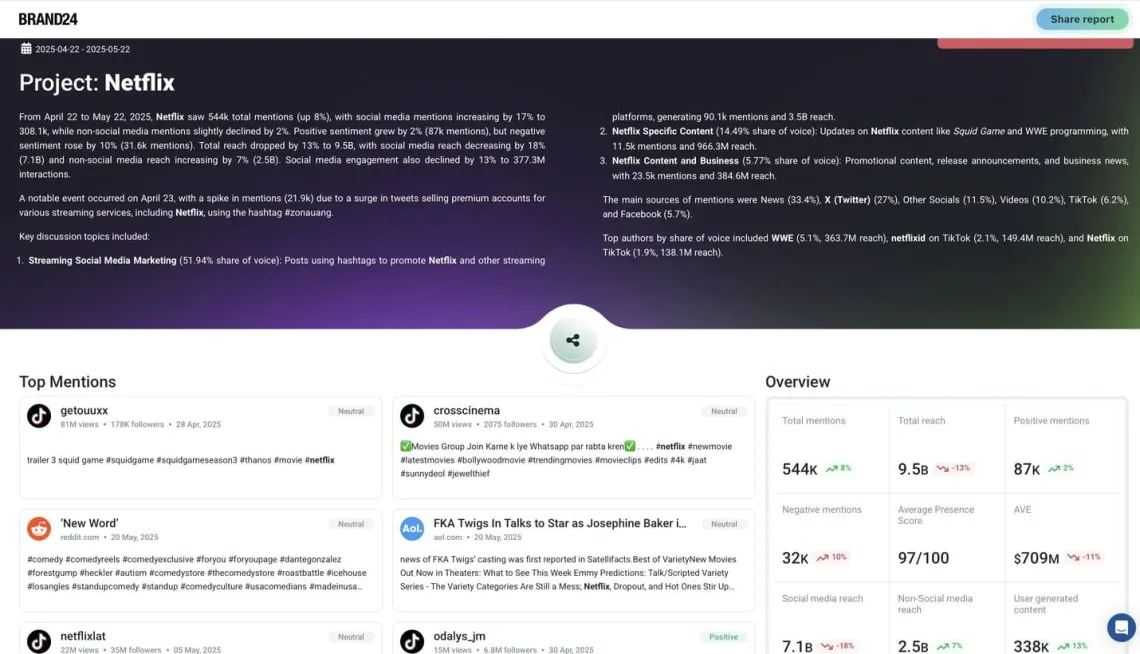
With Brand24’s main dashboard, you can generate QuickShare Reports in seconds. Fast, interactive, and without time-consuming deep analysis.
Simply click “Generate Report” on the right.
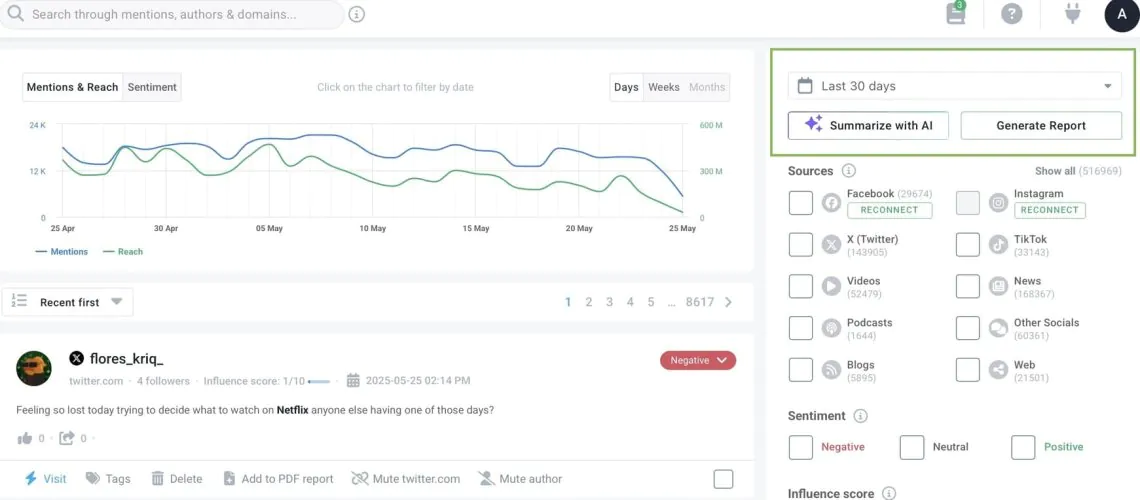
And instantly explore detailed data for every social media post.
You can also set up weekly comprehensive reports powered by AI, which are sent directly to your inbox.
These provide key audience insights, highlight trends, and deliver actionable recommendations based on the most relevant performance data.
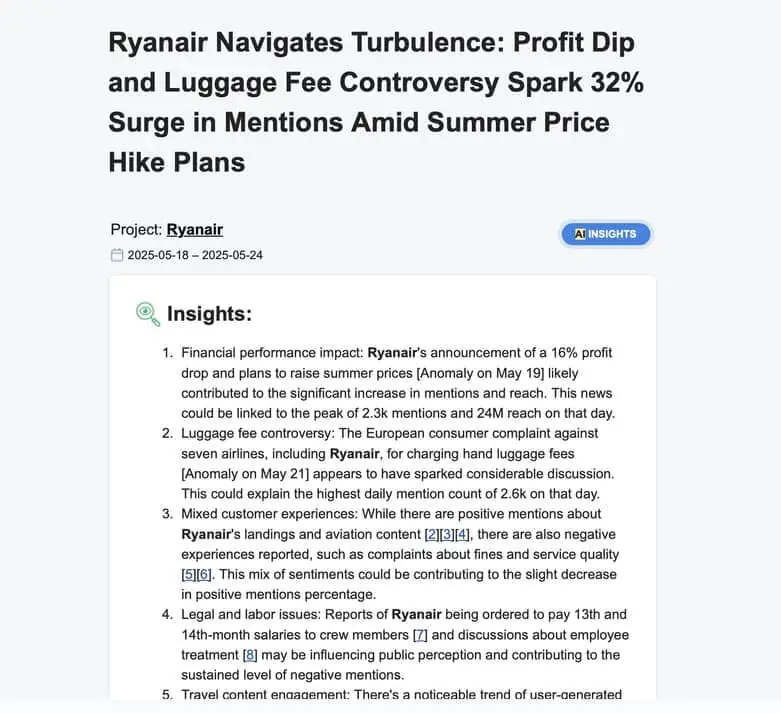
It’s a smart way to stay ahead, without missing a single trend.
Get your weekly automated social media reports!
Platform-specific reports
Every social media platform tracks engagement metrics differently; not all campaigns run across every channel. That’s why it’s essential to have a flexible social media reporting tool that keeps everything in context.
With Brand24’s Analysis tab, I can create custom reports with just a few clicks. I can filter by specific social media accounts, reporting period, authors, locations, or external domains.
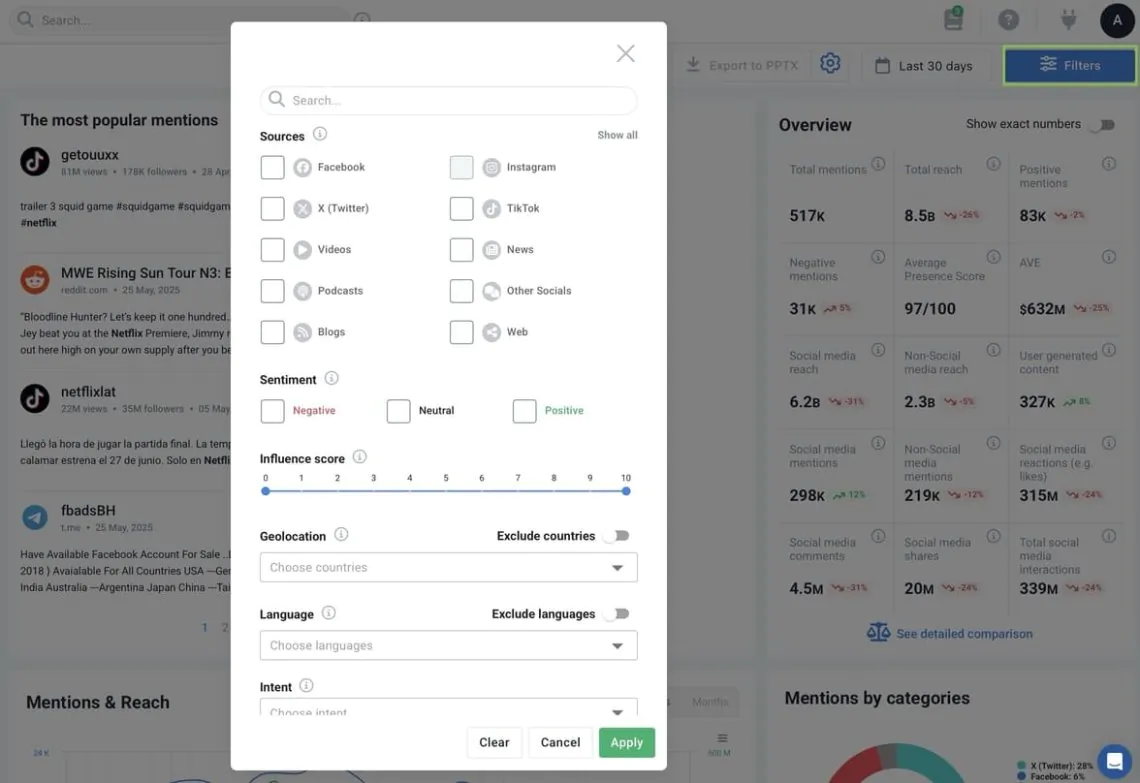
It’s perfect for tracking performance metrics, building tailored reports, and comparing outcomes across multiple marketing channels and other marketing channels. All in one place.
Transform Online Mentions into Actionable Reports!
Good Practices for Creating a Social Media Report
Here are some tips to make your social media report like a pro!
01. Automate your report
Many business intelligence reporting tools allow you to automate parts of the reporting process; use them!
Whether pulling in data, generating charts, or creating recurring templates, automation makes your work easier. It frees up more time to focus on the strategic side of social media reporting.
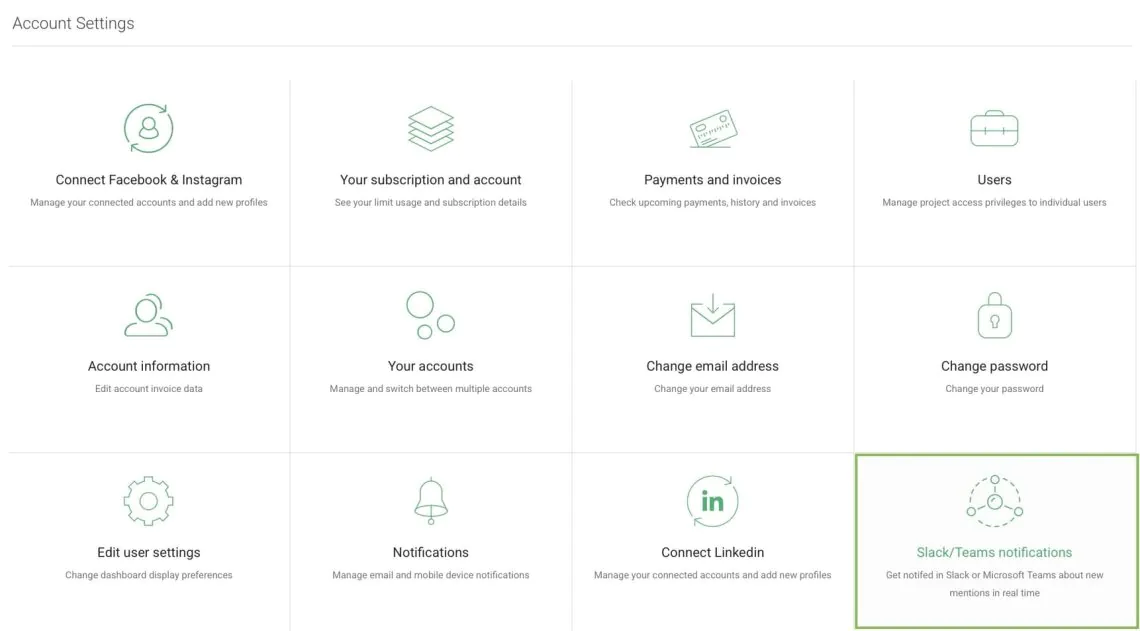
Below, you can see how to automate notifications to send them directly to your team or Slack:
Stay on top of what’s happening around your brand!
02. Customize your report
Social media report templates are a fantastic starting point, but not sacred.
If something doesn’t fit your needs, change it. Add metrics that are important to you. Change the structure. Abandon a section if it doesn’t bring value.
Don’t be afraid to personalise it!
03. Make little breaks
Adding small breaks in your reports will help keep your audience focused. Don’t overwhelm them with too much information at once!
You can include things like:
- Funny pictures or memes
- The best-performing social media posts or short videos
- User comments or testimonials


