Table of contents
8 Key Customer Engagement Metrics You Should Track in 2025
Customer engagement is like the goose that lays the golden eggs. Once you care for it, you’ll be rewarded. Nicely rewarded! Cause due to Gallup, improving customer engagement leads to 66% higher sales growth and over 10% increase in net profit. To implement it, you must know these top eight customer engagement metrics.
Customer engagement metrics are a set of measurements that show how actively customers interact with a brand or product. Analyzing these metrics allows businesses to understand how well they connect with their customers and measure customer loyalty.
Google surely showed you dozens of articles about customer engagement metrics.
And honestly, I know you may be confused. There are so many different of them! How do you choose the right ones and measure customer engagement effectively?
That’s why I decided to check them all and compile a piece that gathers only the eight essential indicators you need to measure customer engagement like a pro.
You’re most welcome!
Key customer engagement metrics to track:
01 Customer Satisfaction Score (CSAT)
As the name suggests, the Customer Satisfaction Score (CSAT) measures customer satisfaction level.
In other words, CSAT is customer feedback that informs you about your client’s happiness regarding a particular experience or interaction with your product or service.
You can use this metric to evaluate the customers’ experience regarding your product or service delivery & quality, buying process, customer support, etc.
CSAT is one of the most effective customer engagement metrics, as it:
- Provides you with immediate customer feedback and allows you to discover satisfaction levels quickly;
- Identifies areas where a product or service might be falling short to guide improvements;
- Enhances customer experience, retention & advocacy by addressing customer satisfaction.
Track key customer engagement metrics!
How to measure?
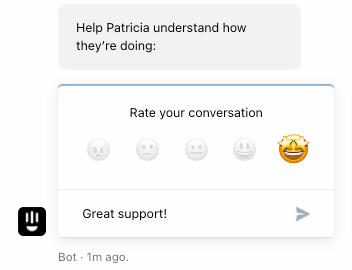
In practice, CSAT is usually used by asking customers a simple question, i.e., “How satisfied were you with your experience today?”.
Typically, the responses are given on a scale from 1 (very dissatisfied) to 5 (very satisfied). Later, the Customer Satisfaction Score is calculated by taking the average of these ratings.
If you want to enjoy the full power of the CSAT metric, you must follow some good practices:
- Ask clear and concise questions to increase the response rate and avoid misunderstandings;
- Send CSAT surveys at the right time, so while the experience is still fresh in your customer’s mind;
- Don’t ask for feedback too frequently to avoid survey fatigue.
As you might have guessed, you can implement multiple Customer Satisfaction Scores in your sales funnel. But as I stated above – it’s better not to overuse it.
CSAT is not the only feedback-based metric on our list. But before presenting you with another one, let’s focus on a slightly different type of customer engagement metric.
02 The volume of mentions
The volume of mentions indicates how frequently people discuss or mention your brand, product, or service online.
Let’s put it clear – no brand exists in a vacuum. People are constantly talking, commenting, and reviewing your brand online.
Knowing what your customers think about you is absolutely crucial to having a clear and unbiased picture of your brand.
Tracking the volume of mentions helps in:
- Discovering your brand visibility in your niche to evaluate your PR and marketing strategies;
- Understanding the contexts of mentions to unveil the most frequent problems users face;
- Conducting a competitive analysis to discover your share of voice and position your brand more effectively.
How to measure?
With a huge variety of platforms people use, a media monitoring tool is the most effective method to measure the volume of mentions.
When considering the right tool, you should always prioritize software that allows you to track as many sources as possible.
For example, Brand24 accesses a really impressive number of sources, including:
- Social media platforms – Facebook, Instagram, TikTok, (X) Twitter , YouTube, Reddit, LinkedIn, Telegram, and Twitch;
- News sites, blogs & forums;
- Podcasts & videos;
- Review sites, such as TripAdvisor, Yelp, Booking, App Store, Google Play, and Trustpilot.
Once you open the tool’s Mentions tab, you’ll see the chart presenting all your mentions.
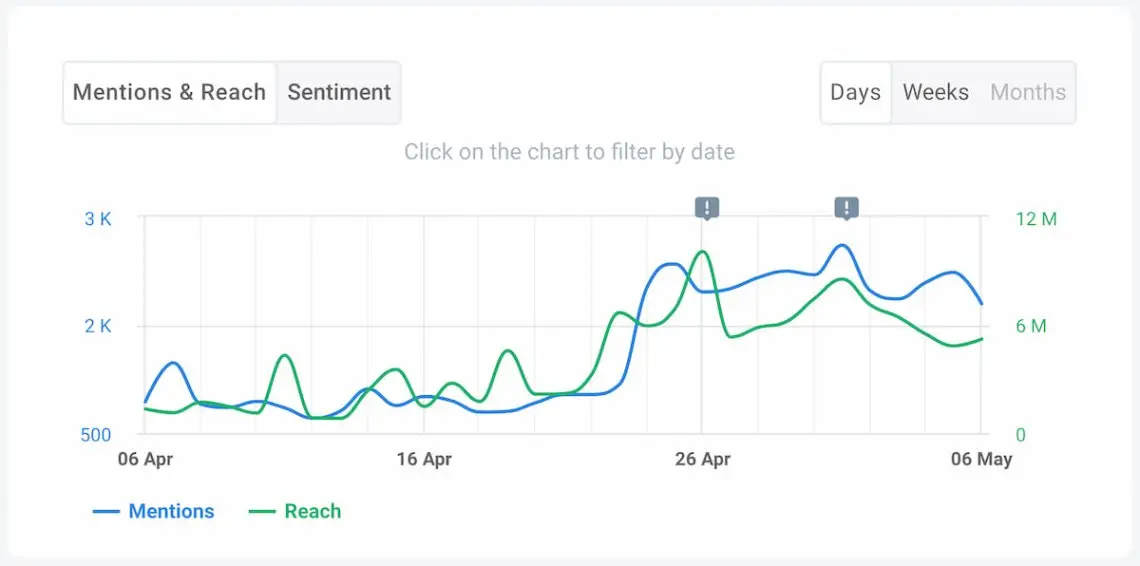
Moreover, Brand24 offers an AI-powered Anomaly Detector that automatically discovers unusual patterns related to your brand, product, or service mentions.
Why is it important?
Tracking hundreds or thousands of mentions is challenging.
You may be overwhelmed with the growing volume of mentions touching one particular context and miss the opportunity to engage your customers (or respond to their problems promptly).
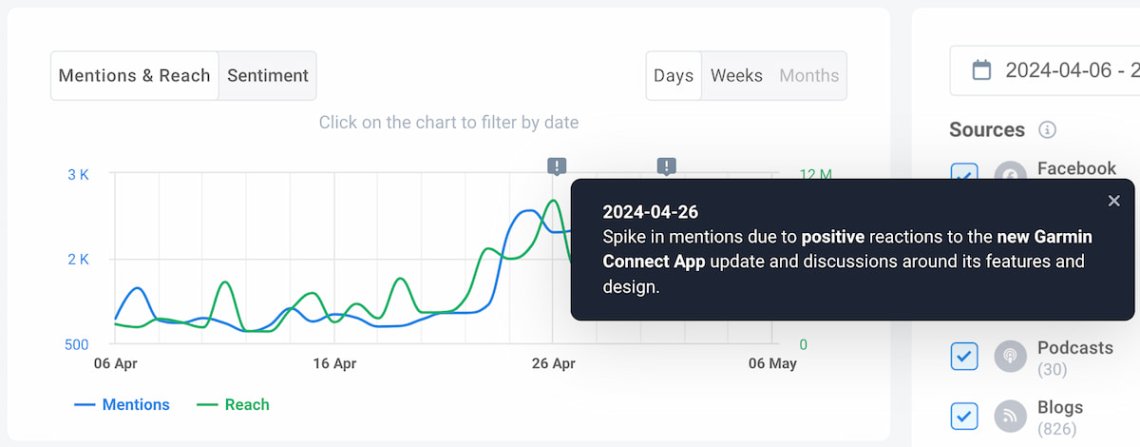
The Anomaly Detector identifies unexpected growth in the volume of mentions and scans the web to find the most probable cause.
As a result, it presents the conclusions in one or two essential sentences.
Look at the picture below. Garmin – a company known for producing sports wearables & software – has recently updated its Garmin Connect App.
Obviously, that was the leading cause of a sudden spike in their brand mentions.
As you can see, tracking brand mentions is crucial for understanding your customer engagement.
Start tracking your volume of mentions now!
For now, let’s go back to feedback-powered techniques. It’s time to introduce you to the NPS – an extremely useful metric to assess customer engagement.
03 Net Promoter Score (NPS)
NPS is an indicator showing what’s the likelihood that customers will promote your brand, product, or service to other people.
We all feel that word of mouth is the most effective marketing tactic. And it’s proven!
According to Nielsen’s Global Trust in Advertising report, 92% of customers trust recommendations from family and friends more than any other type of advertising.
That’s why measuring the number of satisfied customers is so crucial.
Of course, you can’t control their behavior, and be sure that all of your customers will spend their precious time on your brand advocacy.
But business is a strategy and probability game.
The happier the customers are about your brand, product, or service, the higher the chance they’ll tell about you to others.
And measuring the Net Promoter Score is the most effective strategy to judge the probability of advocacy.
How to measure?
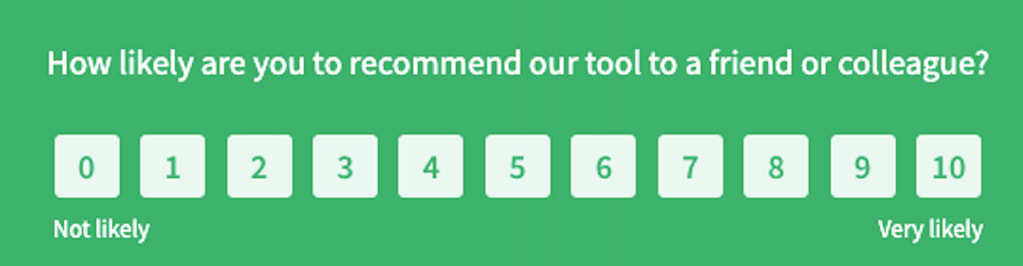
Just like in the case of the CSAT metric, Net Promoter Score is measured by asking a simple question, such as “On a scale of 0 to 10, how likely are you to recommend our brand/product to a friend or family?”.
The scale is the clue. NPS questions always ask respondents to rate their experience with a particular number.
Respondents fall into one of three categories:
- Promoters (9 – 10), so loyal enthusiasts that typically continue buying and refer others;
- Passives (7 – 8), so satisfied customers but not strong enough to advocate your brand;
- Detractors (0 – 6), so unhappy customers who can damage your brand reputation.
Later, you should subtract the percentage of Detractors from the percentage of Promoters. That’s how you’ll calculate your Net Promoter Score.
NPS = % of Promoters – % of Detractors
Increasing the positive attitude towards your brand is essential and requires a proper understanding of sentiment. This brings us to…
04 Sentiment analysis
Sentiment analysis is a metric measuring online texts to discover their emotional load.
In other words, it’s unveiling if the given mention has a positive, negative, or neutral tone.
Such analysis changes the perception of online mentions.
They cease to be elements of information noise and start to act as natural and unprovoked feedback of your brand, product, or service, providing an authentic insight into your overall reputation.
Customer engagement is not only about quantity but also about the quality of mentions. Understanding the feelings about specific topics gives you valuable insights.
Therefore, tracking customer sentiment broadens your knowledge and perfectly complements other metrics, like CSAT and NPS.
Moreover, according to Emplifi, 52% of customers expect a response from a company within one hour. That highlights the importance of timely reaction to publicly shared statements regarding your brand.
Tracking and analyzing your online sentiment brings a lot of benefits:
- Positive or negative mentions give actionable insights to improve your products and services;
- Prompt reaction to publicly stated customer’s pain improves the customer experience;
- You can identify people and profiles that advocate your brand, allowing you to engage with them directly and leverage their positive sentiment to influence a broader audience.
How to measure?
Measuring sentiment is very easy, but it requires a proper media monitoring tool offering such a feature. Preferably, the tool should track & analyze sentiment in real time to enable an immediate reaction.
Brand24’s AI-powered sentiment analysis constantly tracks your brand mentions. The tool automatically does the semantic analysis and categorizes each mention as positive, neutral, or negative.
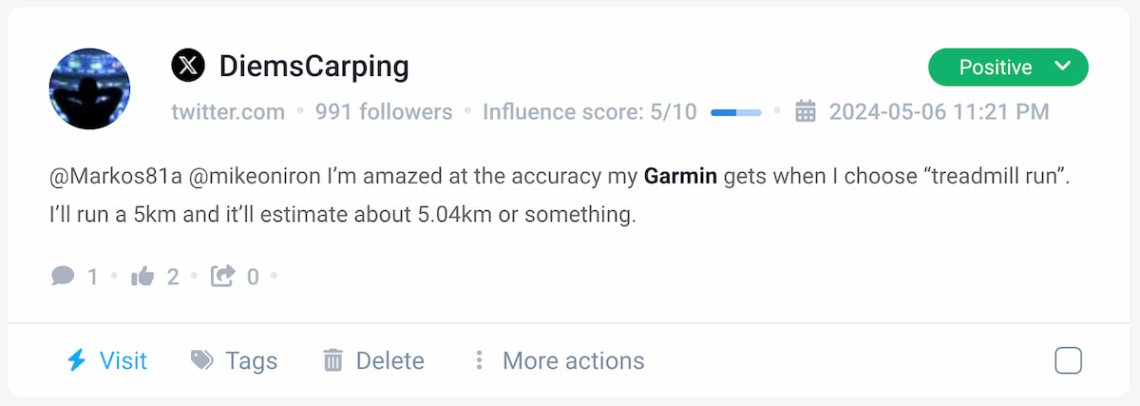
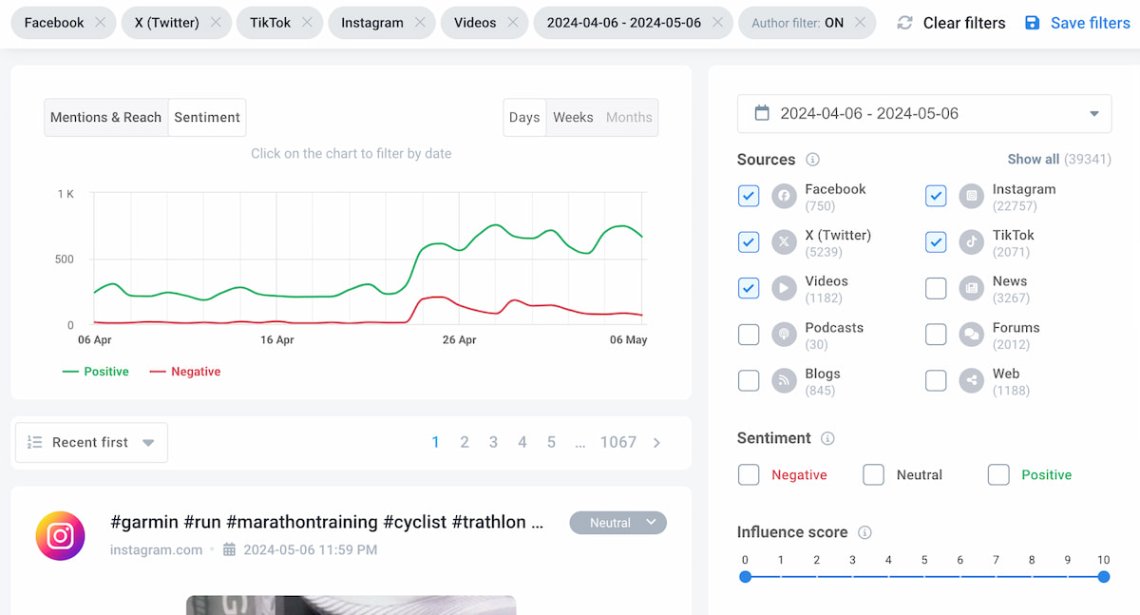
When you enter Brand24’s Mentions tab, just change the chart’s view to “Sentiment”.
You can adjust the chart according to your needs by applying filters such as period, sources, sentiment, geolocation, intent, author, etc.
As you can see below, I implemented a sources filter to exclude non-social brand sentiment.
It’s evident that Garmin enjoys an overwhelmingly positive reception on social platforms.
Test the best sentiment analysis tool in the world!
Speaking about social media, let’s go ahead and delve into another customer engagement metric.
05 Social media reach
Social media reach is the flip side of social mentions volume. In short, it’s an estimated number of social media users that could have seen a social media post.
This metric works as an early indicator of engagement.
Because although reach does not measure active engagement, this metric:
- Provides a foundational measure of how many people could potentially engage with the social media content;
- Measures how effectively your content resonates with your audience.
How to measure?
Nearly all social media offers native analytics solutions, including features to track the content reach on a particular platform.
However, to tie all of them together and thus save a lot of time, I recommend trying a social media monitoring tool like Brand24.
As I mentioned before, Brand24 accesses public mentions from eight major social media sites: Facebook, Twitter (X), YouTube, Instagram, TikTok, Reddit, LinkedIn, Telegram, and Twitch.
So, with just one tool, you can track and analyze all your social media presence.
What does it look like in practice?
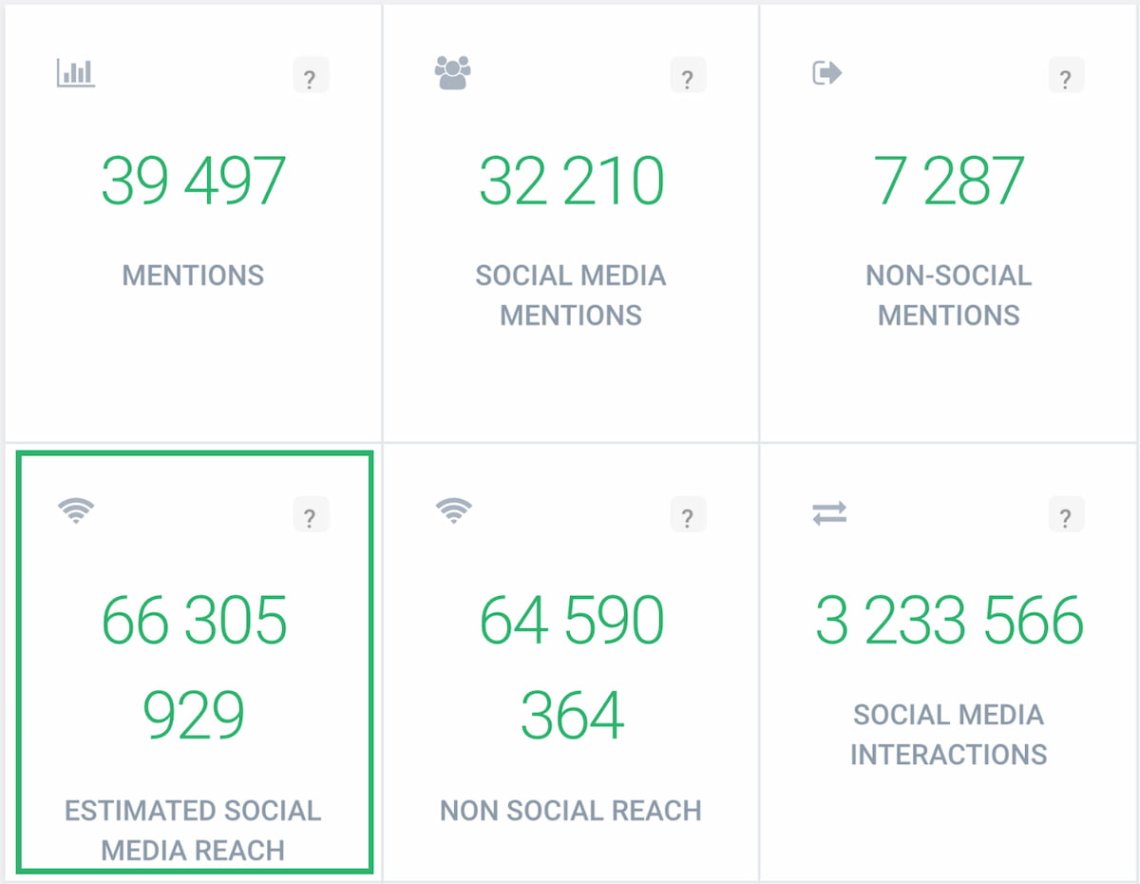
Going to the Summary tab, you’ll see the chart presenting the social media reach. In the case of Garmin, the brand is evidently on an upward trend.

You can also jump into the Analysis tab. On the right, there are tiles presenting precise numbers.
Only in 30 days, Garmin mentions reached over 66 million people. Wow!
Now, it’s time to present you with another crucial indicator.
If you want to track customer engagement metrics like a pro, the Churn Rate is a metric you shouldn’t omit.
06 Churn Rate
The Churn Rate refers to the percentage of customers who decide not to continue using your products or services over a specific period.
Let’s make it clear – it’s absolutely natural that customers resign from products and services. Therefore, having a zero Churn Rate is rather a myth than a goal to achieve.
But this process should be under your control.
Therefore, if your Churn Rate is getting higher systematically, you should treat it as an alert requiring revision of your customer engagement strategies.
Prevention is always better than cure.
According to the Harvard Business Review, new customer acquisition is between 5 to even 25 times more expensive than retaining existing customers.
So, as you can see, customer Churn Rate is a critical metric for calculating customer retention rate & loyalty and halting the unfavorable trend at the right time.
How to measure:
Measuring customer Churn Rate is pretty straightforward.
All you need to have is the number of your customers at the beginning of a given period (monthly, quarterly, annually) and the number of customers lost over that period.
Then it’s just simple math according to the following formula:
Customer Churn Rate = (total number of customers lost over a given period / total number of existing customers at the beginning of the given period) x 100%
07 Non-social reach
Non-social reach is a customer engagement metric presenting an estimated number of people who could have had contact with your content outside social media.
It refers to all non-social sources: review sites, websites, blogs, forums, podcasts, video sites, etc.
Okay, but does it even matter? We live in a social media era. Does anyone still read news sites and blogs?
The shortest answer is: definitely yes!
In general, tracking non-social mentions and their reach brings a lot of benefits, such as:
- Broader audience insights give you a more comprehensive picture of your audience and their perception of your brand, product, or service;
- Increased chance of reacting to unfavorable customer feedback & spotting the potential brand crisis.
Access your key customer engagement data immediately!
When someone is looking for software, he usually starts by reading reviews on sites like TrustPilot, G2, or Capterra.
Review sites are non-social sources.
Got a problem with your device? Many people still use traditional forums to discuss & fix tech issues.
Forums are non-social sources.
Need to buy a new car? You’ll surely google different models and read articles on industry blogs and websites.
Websites and blogs are non-social sources.
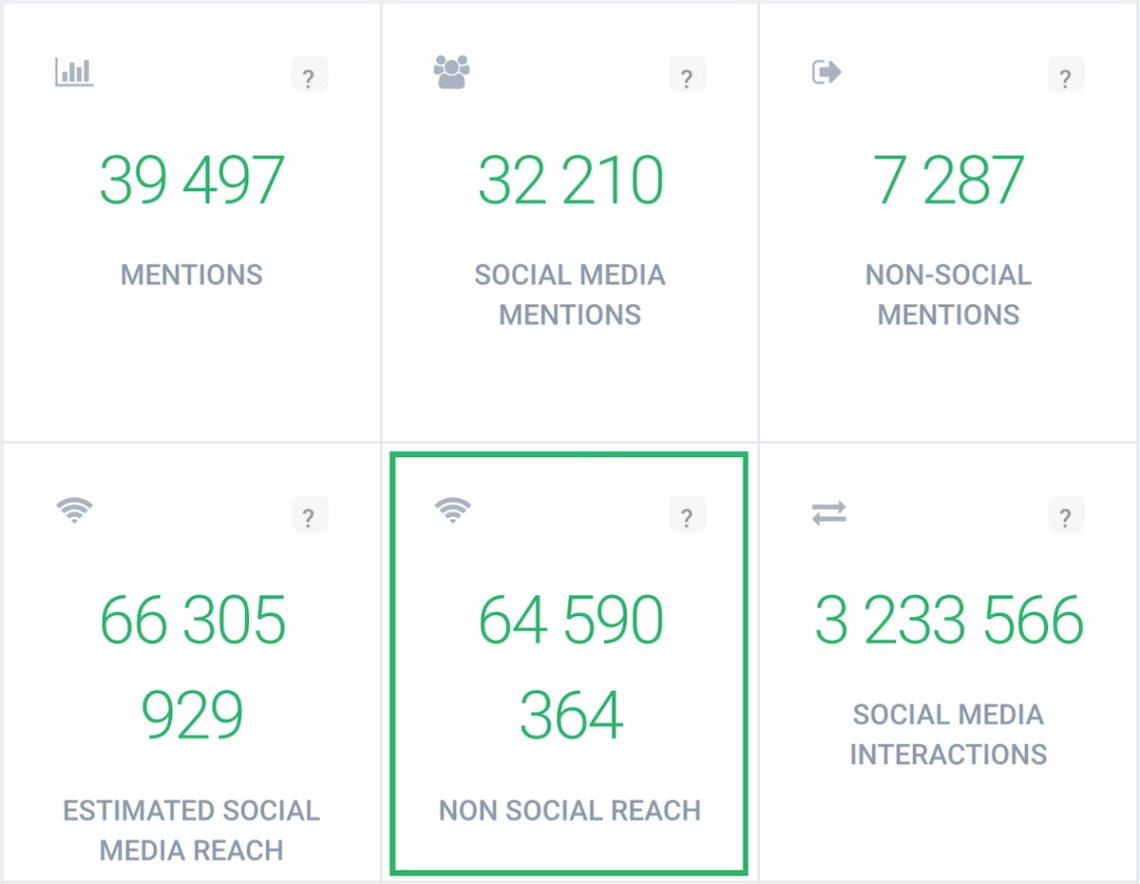
Not convinced yet? So, look at Garmin’s reach stats. Yes, that’s the same image I pasted in the paragraph about social media reach.
As you see, non-social reach is nearly equal to the reach coming from social platforms.
How to measure?
The most convenient way to measure non-social reach is good social listening software.
As I mentioned before, Brand24 has access to various sources outside social media: websites, blogs, video sites, forums, podcasts, and review sites.
Like in social media reach, you can open the Analysis tab for a numerical summary of your non-social reach (see the image above).
Another way to discover your non-social trend is by using the Compare Periods feature in the Comparison tab.
Once you set the period to benchmark your brand performance, you’ll see a table summarizing crucial data regarding your project, including non-social mentions’ volume & reach.
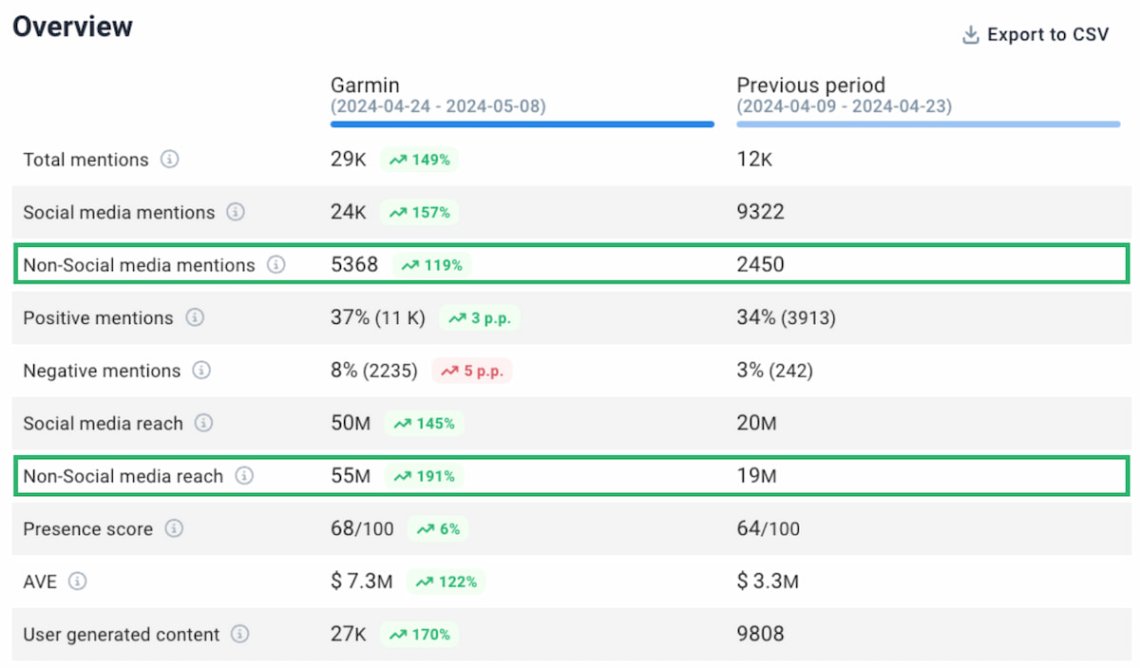
You can also switch the view to the Sources tab to discover which sites are the top ones regarding your non-social reach.
All you need to do is filter results by excluding social media platforms.
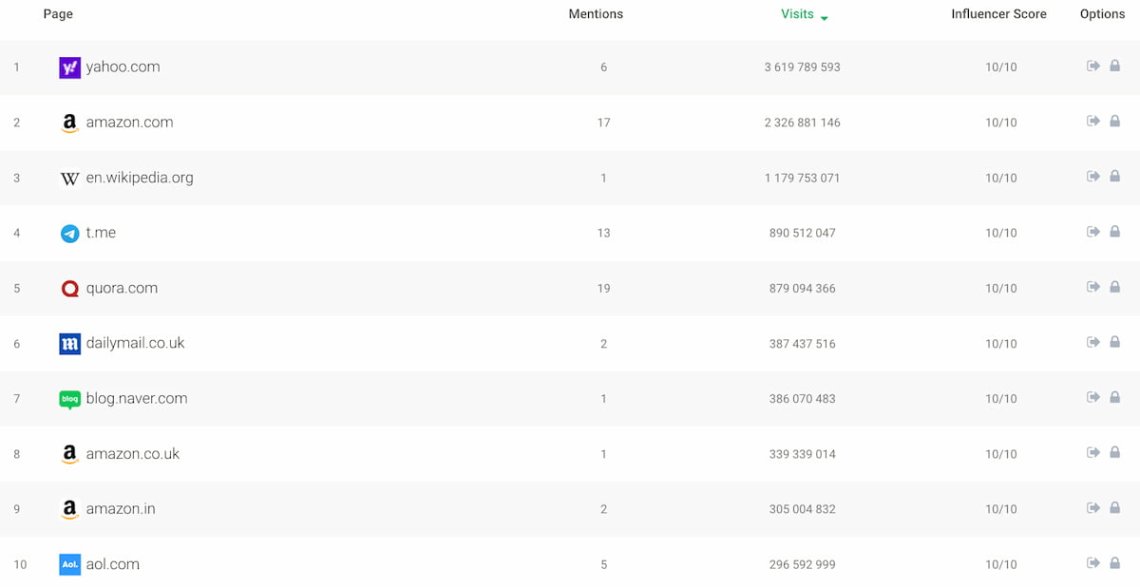
Below, you can see the list of Garmin’s most influential non-social domains.
08 Customer Effort Score (CES)
Customer Effort Score is another feedback-based metric used to measure how easy or difficult it is for a customer to interact with your company.
To put it differently, CES focuses on the touchpoints of the customer journey to find and eliminate disturbing points of the whole process.
Why is it important?
Because each difficulty the customer must face lowers the overall customer experience.
According to the NTT survey, reducing customer effort is the number 1 principle of the brands’ customer experience design strategy.
How to measure?
The first element of the Customer Effort Score measurement is placing the right question just after the customer has interacted with your brand, product, or service.
The interaction is any crucial step in the customer’s journey, such as making a purchase or getting customer support.
Each question should:
- Be straightforward and easy to understand;
- Use a numerical scale to rate the experience;
- Appear at the right time, so just after the given experience.
So, to put it into practice, imagine such a situation.
Your customer just made a purchase through your website. If you’d like to use CES properly, you should insert the question just after the payment.
The question might sound: “How easy was it to complete your purchase with us today? Please rate from 1 (very difficult) to 7 (very easy).”
When you gather multiple responses, you can define your Customer Effort Score by using the following formula:
CES = sum of all scores / number of responses
Track key customer engagement metrics!
Tip: Advanced tools can analyze metrics for you
As I stated in the introduction, customer engagement resembles the goose that lays the golden eggs.
I imagine that if such a goose exists, she requires proper treatment and time spent on it.
Therefore, I would look for mechanisms and tools to give the goose everything that makes her happy faster and better.
That’s exactly the case for customers. And advanced tools are essential to enhance your customer engagement metrics.
They track key metrics, analyze them, and draw actionable conclusions – especially since some of them implemented AI-powered features.
Let’s take Brand24’s AI Metrics Analysis.
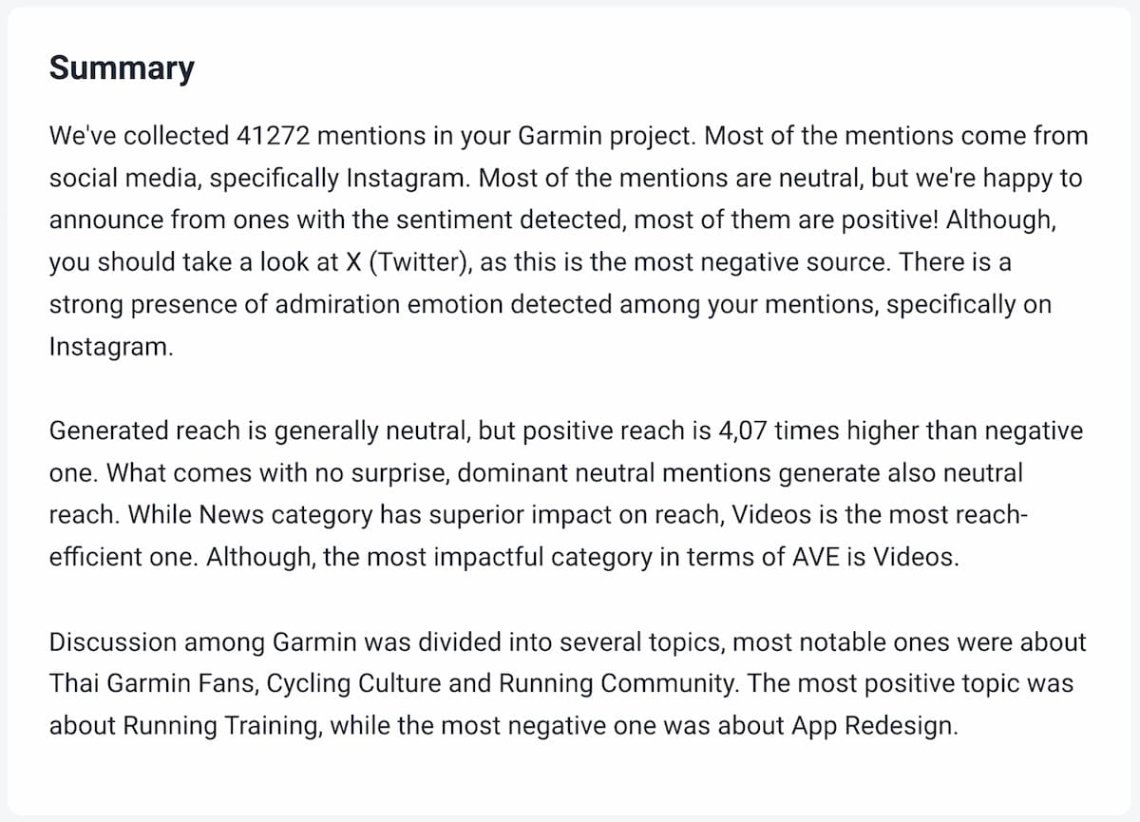
Once you open the Metrics Analysis tab, you’ll see a brief summary of your project. It includes all the most important numbers with interpretations made by artificial intelligence.
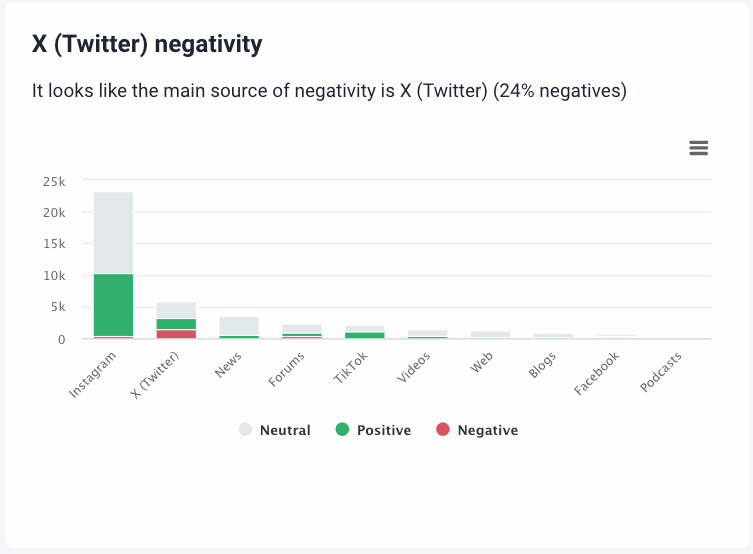
Below, there is a chart presenting what’s the sentiment towards your brand, product, or service through some major sources of mention.
It seems that Twitter users have the most unfavorable perception of Garmin.
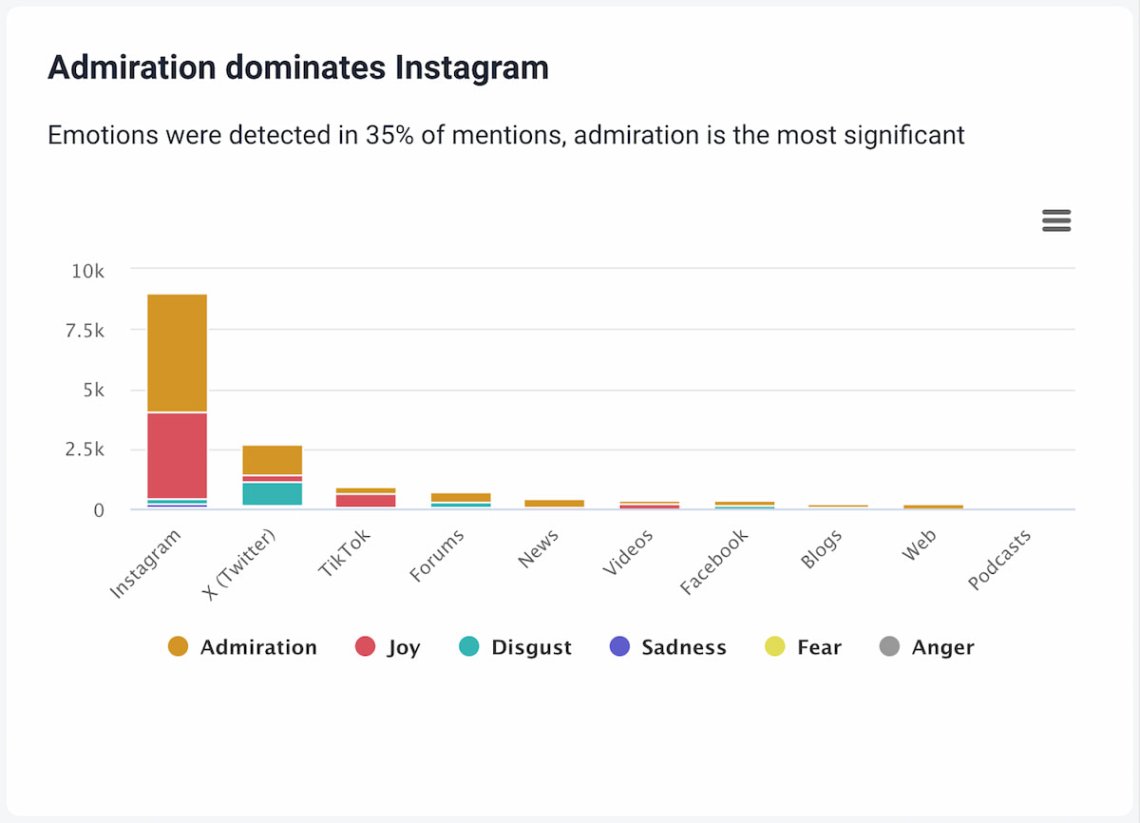
Going further, Brand24 not only detects if the mention sounds positive or not, but it can also attribute certain feelings, such as admiration, joy, disgust, sadness, fear, and anger.
Admiration towards Garmin is the dominant feeling among Instagram users. No wonder!
People using professional smartwatches are mostly active. It’s hard not to admire marathon runners or hikers sharing breathtaking mountain pictures.
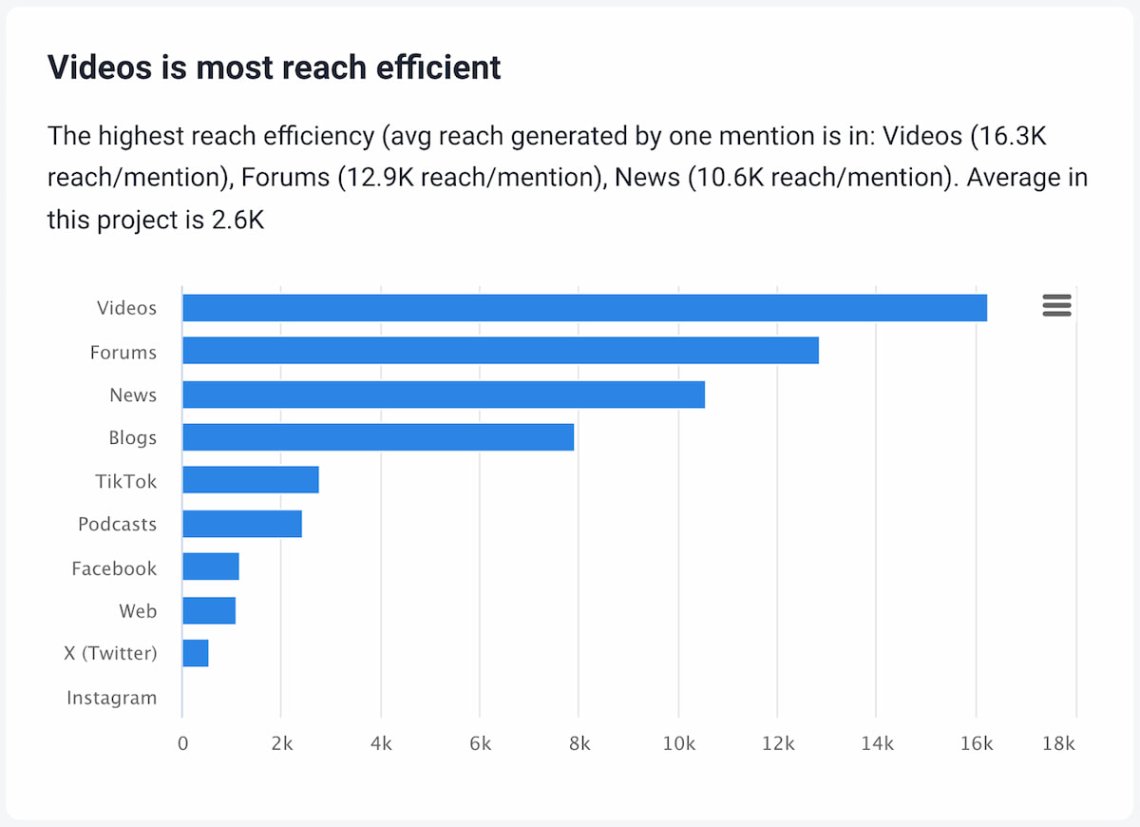
Moreover, the AI-powered Metrics Analysis detects which sources are the most reach-efficient.
Thanks to that information, you know where to allocate your marketing and communication budget to get the most impact.
Let the AI to track key customer engagement metrics for you!
Conclusion
Customer engagement is critical for building a successful brand and driving growth.
To maximize your efficiency, you should implement tracking the eight key customer engagement metrics I described in this article in your everyday work.
Trust me, using them in practice is much easier than it seems at first glance!
All you need to do is follow the rules and supplement your efforts with the right media monitoring software.
Key takeaways:
- Feedback-driven metrics require asking clear questions and being timed well to get the best insights from customers.
- Tools like Brand24 accelerate measuring customer engagement metrics by providing comprehensive and real-time data;
- No customer engagement metric exists in a vacuum. The best practice is to connect all of them to one system.
Now you’re almost ready to test the power of customer engagement metrics in real life! To be fully prepared, give a chance to Brand24 and test it for free!