CASE STUDY: How We Increased Our Monthly Blog Traffic by 136% with One Blog Post (and Pikachu)
On July 15 2016 we published our most popular post so far. The article was very simple, and it talked about how our team at the Brand24 headquarters spent $5 on Pokemon lure modules. They wanted to:
- See if lure modules would actually lure any Pokemon to the office (they did),
- Check if they could spot more players in the area than usual (they did).
The idea was to verify if and how Pokemon Go can be used in location-based marketing. Three days earlier, we actually wrote a post on how the world reacted to Pokemon Go, which hasn’t received that much attention. We discussed a popular subject, but didn’t approach it from the right angle to attract so many visitors.
In this post, we show some statistics and explain why it worked so well the second time around. Without further ado, it’s time for some stats!
Traffic Volume
OK, so this happened – the blog went “503 Service Unavailable” on us for 2 minutes after our CEO and our company profile posted about the article.

Here’s the reason why: the following chart presents blog users between 8-21.07.2016.

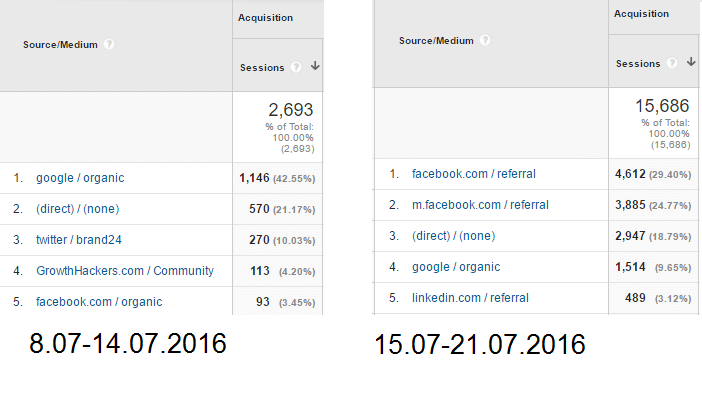
Traffic Sources
Have a look at the blog Source/Medium stats between 8.07-14.07.2016 and 15.07-21.07.2016 respectively:
Promotion & Engagement
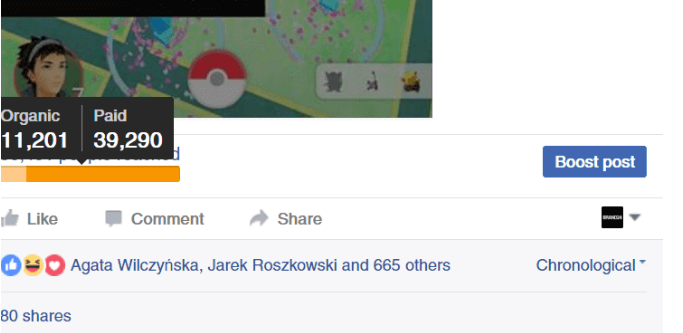
This post on our Facebook company profile had 50,5K reach (11,201 organic, 39,290 paid), with a total of 2.8K clicks. At the time of writing this article, the post got a total of 667 reactions, 80 shares and 27 comments.
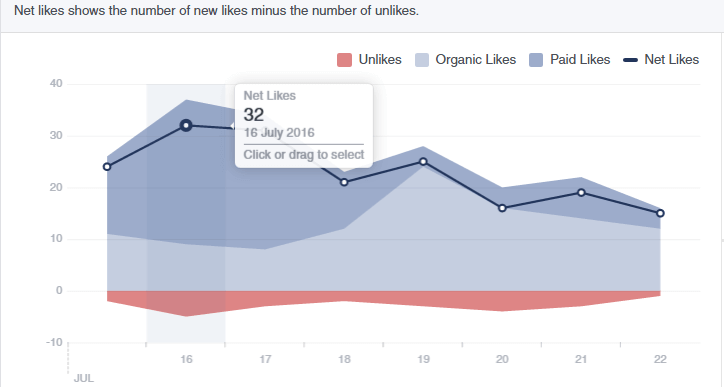
As pictured on the graph below, we saw an increase in net number of likes following the publication. The reach of our Facebook posts also increased significantly.
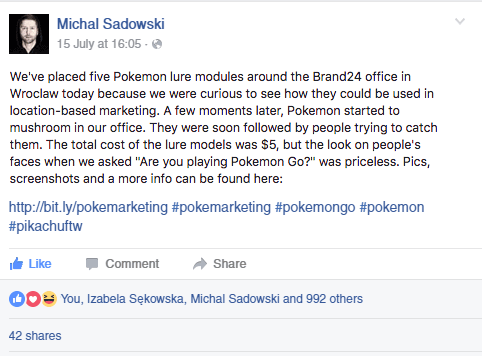
Our CEO Mike Sadowski promoted the piece via his personal Facebook profile, and got 995 reactions 42 shares.
The blog post was widely shared in social media, so it appeared in my Brand24 Dashboard a lot. I have a project monitoring blog post shares, as some people don’t use our official handle when sharing our content. Pretty sweet, right? If you’re a blogger, you can try monitoring the name of your blog to pick up the interactions you’re currently missing.
You can start your free trial here to see how many go unnoticed.
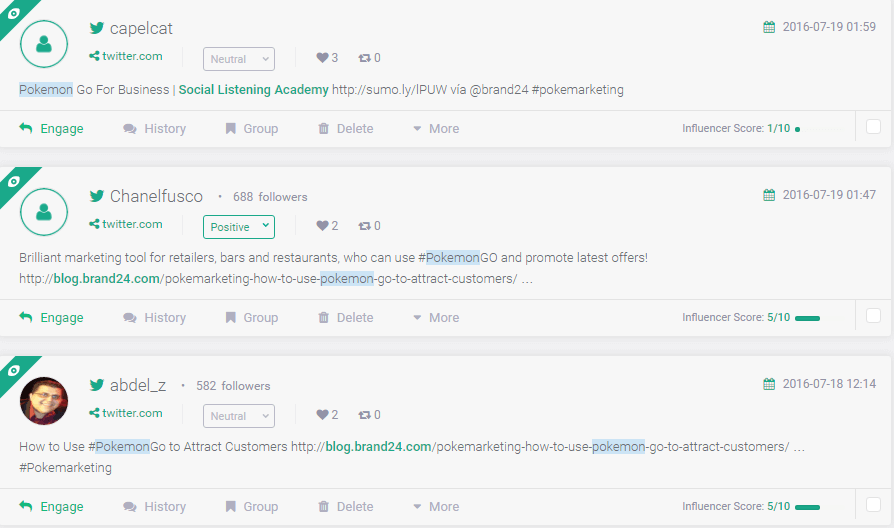
We also published the piece on Medium and promoted it on LinkedIn with good results, as well as posted updates on Inbound.org, GrowthHackers, but didn’t get any out-of-ordinary results there.
Content Drilldown

As you can see, the Pokemarketing post got over 12K pageviews in 1 week. Here’s the second most popular post from the list – 10 Outstanding Examples of Going an Extra Mile in Customer Service – as you can see, it’s a great “evergreen” post from 2015 which gets around 2k page views every month. Make sure to check it out.
New vs. Returning Visitor
Following the publication, we saw a change in New vs. Returning Visitor ratio:
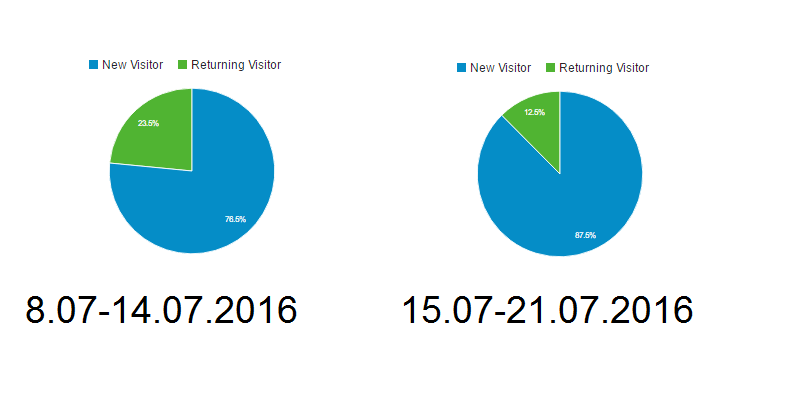
As you can see, new visitor index was 10% higher in the week of the publication, and it reached 83% for the whole of July.
Cost
Pokemon lure modules: $5 + Paid promotion on Facebook: $180= a grand total of $185.
Time to ask the big question: why was the post so successful?
Original Content with a Human Twist
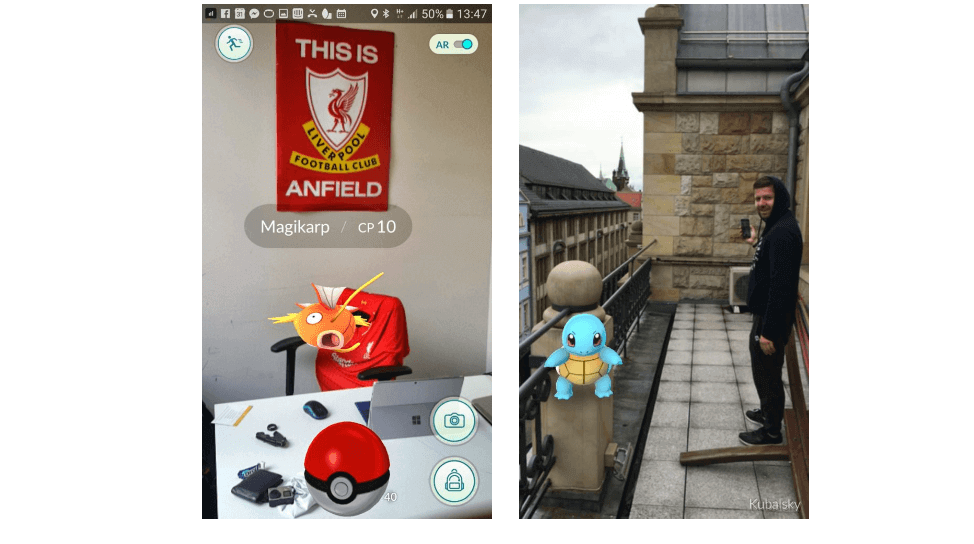
At the time of publication of the first post, the Web was already buzzing with Pokemon Go stories, and all we did was jump on the Pokemon bandwagon. What was different with the second post was that we gave the subject an original twist – we produced original photos and involved our team members in the process, which our audience loved. People are often interested in seeing the office space, employees and daily life details from the companies they follow or do business with – like this picture of Magikarp casually chilling in our CEO’s chair. Pricless.
Real Time Marketing
Real time marketing posts have always been the biggest traffic magnets on our blog. Here’s a couple of them: Facebook Reactions, Volvo Poland social media stunt, and the Oscars. However, none of them has ever been so popular as the Pokemarketing post. We will surely continue to take up trending subjects, but from now on we will most likely try to personalize them if possible.
The content was highly engaging and got over 2K interactions in total (Facebook – company and personal profiles, Twitter, LinkedIn, Growth Hackers, Inbound.org, Medium). Why is that the case? People are passionate about Pokemon Go and they are happy to share content related to it because they feel nostalgic. Ever seen a post on a song, toy, chewing gum, or another food item from your childhood? You may not have reacted on Facebook, but it certainly brought up some memories. Emotions are huge sharing triggers (some even more than others), so adding an emotional appeal to your content can increase its shareability. That’s exactly why Pokemon Go is so popular.
Timing
It’s no rocket science that timing is crucial on social media. Had we published the post mid-August, it would have probably been ignored by a lot of people.

Prepare to be flexible and leave room in your editoral calendar so you can squeeze content in whenever necessary.
Practicality
In the post, we talked about how Pokemarketing can be used in location-based marketing. We were quite practical about it as we wanted to see if as little as $5 would bring about a noticeable change in the number of players in the area. We didn’t flood people with a ranking of Pokemon with their characteristics, but kept it short and simple. We wanted to show people what the app looks like, as many people haven’t tried it at the time. That approach seems to have worked well for us.
Conclusion
When it comes to traffic, many factors are at play. From my experience, referring to trending topics before they become saturated and appealing to emotions yields great results. All it took was the right post at the right time.
What are your most popular posts? Looking forward to your reply in the comments section below!
Related read:
- How to measure PR campaign?
- The golden rules of PR crisis management
Top Reads
How to See How Many Times a Hashtag Was Used on X (Twitter)
Brand Monitoring: Tools & Guide for 2026
Brand Awareness Strategy [The Ultimate Guide for 2026]
The Best AI Hashtag Tracker and Other Hashtag Tracking Tools [2026]
Social Media Reach: How to Measure & Improve It in 2026?
X (Twitter) Analytics Tools: The 10 Best to Try in 2026
Sentiment Analysis: What is it & Why do You Need it in 2026?
Share of Voice: Definition, Calculation, Tools [2026 Guide]
Brand Reputation Management: 6 Expert Tips for 2026
Social Media Analysis: Complete Guide for 2026
Start Social Listening!
Get the Brand24 trial and start social listening like a PRO.
