Table of contents
How to Create an Instagram Analytics Report? Template & Example
Would you believe that creating a professional Instagram analytics report can take less time than watching one episode of the Squid Game? Really! All you need to do is to follow the set of simple rules and – preferably – let AI do the heavy lifting. With the right approach and tools, you’ll not only save time but also create reports that are both insightful and visually impressive. Ready to become an Instagram reporting ninja?
Instagram analytics report is a clear and focused summary of your account’s performance, designed to highlight key metrics like engagement, reach, and follower growth.
It provides essential insights, presents niche trends, evaluates your marketing strategy, and offers actionable recommendations to improve results. The report’s concise structure helps guide data-driven decisions and optimize your Instagram efforts.
What is an Instagram analytics report?
An Instagram analytics report is a clear, concise set of data and insights into your account’s performance.
Its main goal is to evaluate your Instagram marketing strategy, spot trends, and deliver practical recommendations.
Instagram marketing reports are typically presented to social media managers, marketing teams, or clients to demonstrate account performance and inform strategic decisions.
These reports are often created using Instagram analytics tools, such as Instagram Insights, Brand24, Sprout Social, or Hootsuite, which provide detailed data and visualizations to simplify the reporting process.
Where to get data for your Instagram analytics report?
In general, there are two types of sources you can explore to get data and insights for your Instagram analytics report: internal and external.
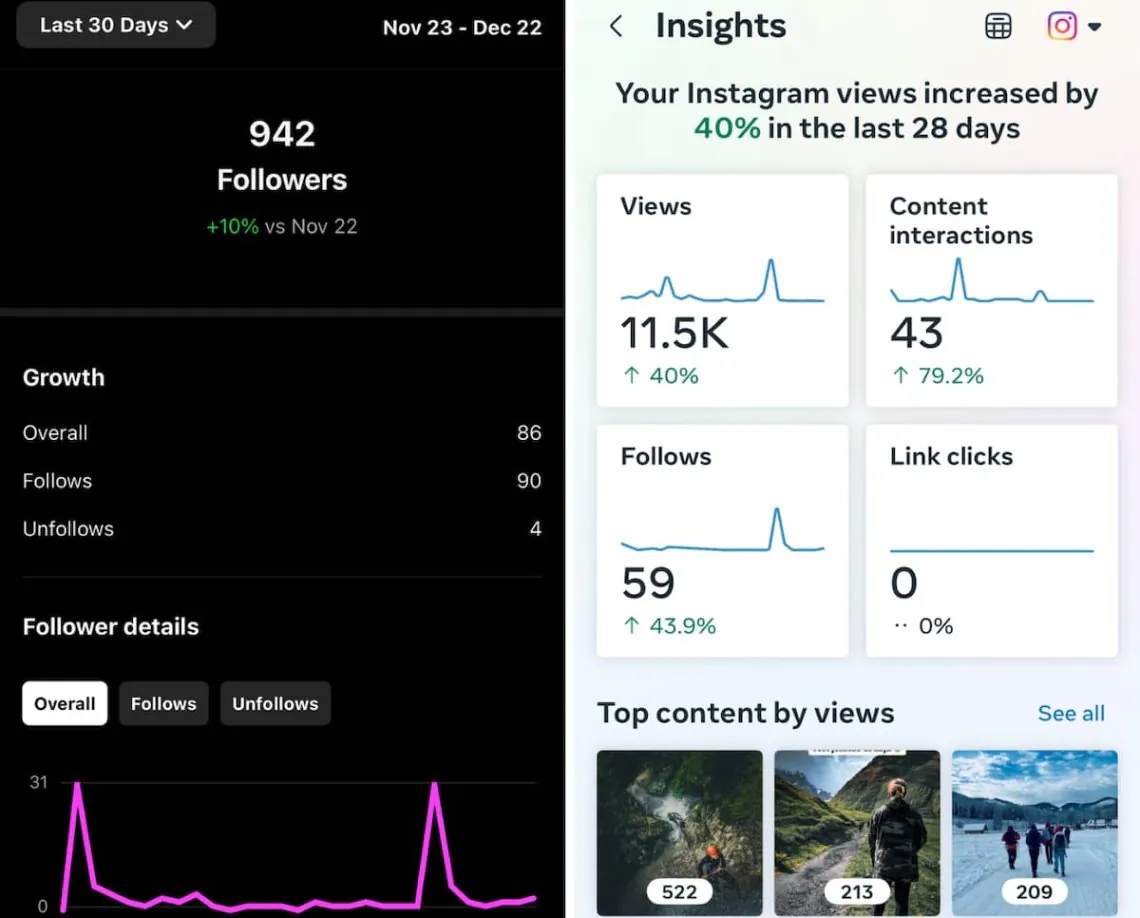
Internal sources are Instagram Insights and Meta Business Suite.
These native platforms offer a wealth of data, including follower demographics, post performance metrics, and engagement insights.
External sources are online tools that extract data from Instagram, process it, and present advanced conclusions that go far beyond what native Instagram analytics software provides.
These include:
- Social listening tools: Platforms like Brand24 allow you to monitor your social mentions on Instagram & many other sources and provide a lot of insightful data, such as audience’s sentiment analysis, trends identification & more.
- Social media management tools: Tools like Buffer or Later integrate with Instagram and provide deeper scheduling, performance analysis, and competitive benchmarking features, helping you optimize your content strategy.
- Google Analytics: While not specifically designed for Instagram, it can help you track traffic and conversions from Instagram links, giving you a broader understanding of how your Instagram efforts contribute to your overall web performance.
Instagram analytics report template
Let’s keep it as simple as possible: if you want to create an Instagram analytics report fast, you should use the Instagram analytics report template.
Fine, but where should you look for not only the template but also the valuable data to fill it with?
My favorite and super quick method is using the Instagram analytics reports generated in Brand24. What’s that?
In short, Brand24 is an AI-powered social listening software that allows you to track, analyze, and evaluate brand mentions published in various online sources:
- Social media, such as Instagram, Facebook, X (Twitter), TikTok, YouTube, LinkedIn, Reddit, Telegram, or Twitch;
- News sites, blogs, podcasts, video platforms & other websites;
- Forums, review sites, and newsletters.
What really matters is that Brand24 offers a huuuuuge variety of stunning AI features that make your everyday job better & faster, especially when it comes to the reporting process.
I know what you might think right now: “Okay, mister Smooth Talker, show me what you’ve got!”.
All right, then!
As I said, these are just samples.
If you need more specific data like, let’s say, a monthly Instagram analytics report, all you need to do is apply a date range filter, select the source to Instagram-only, and click “Generate Report”.
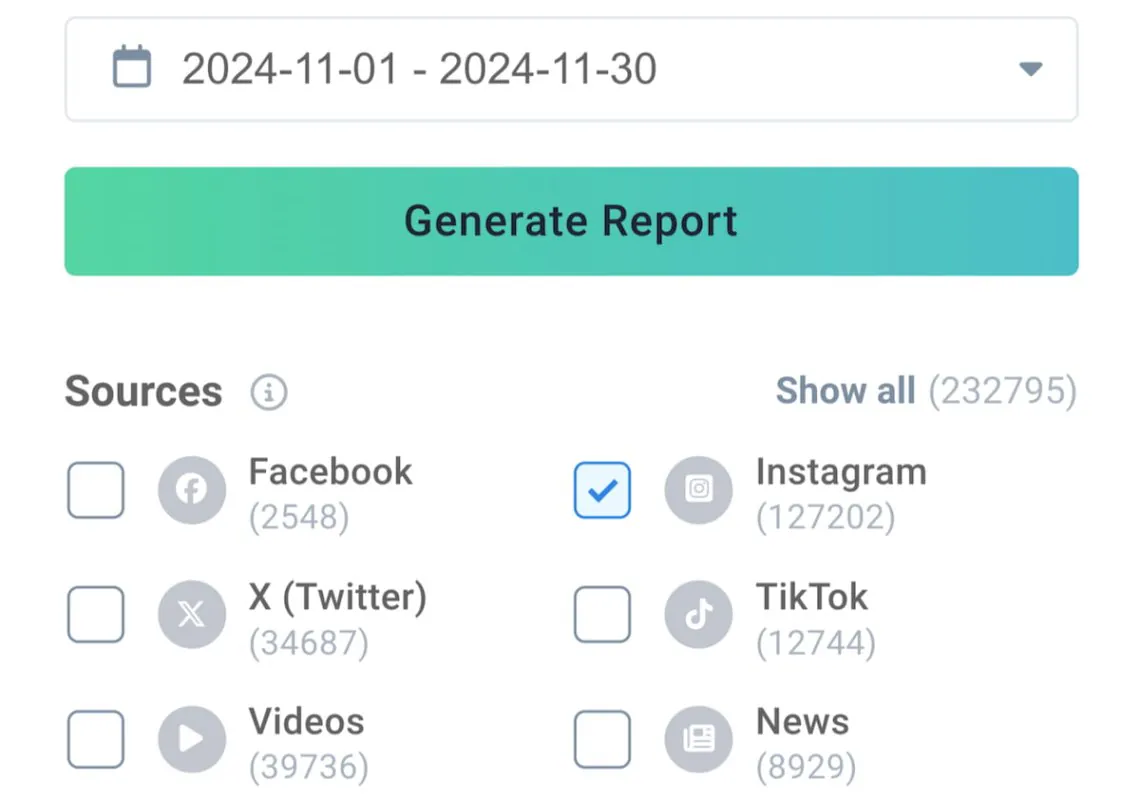
Now, you need to wait for about 20 seconds and voilà! Can it be simpler? I seriously doubt it.
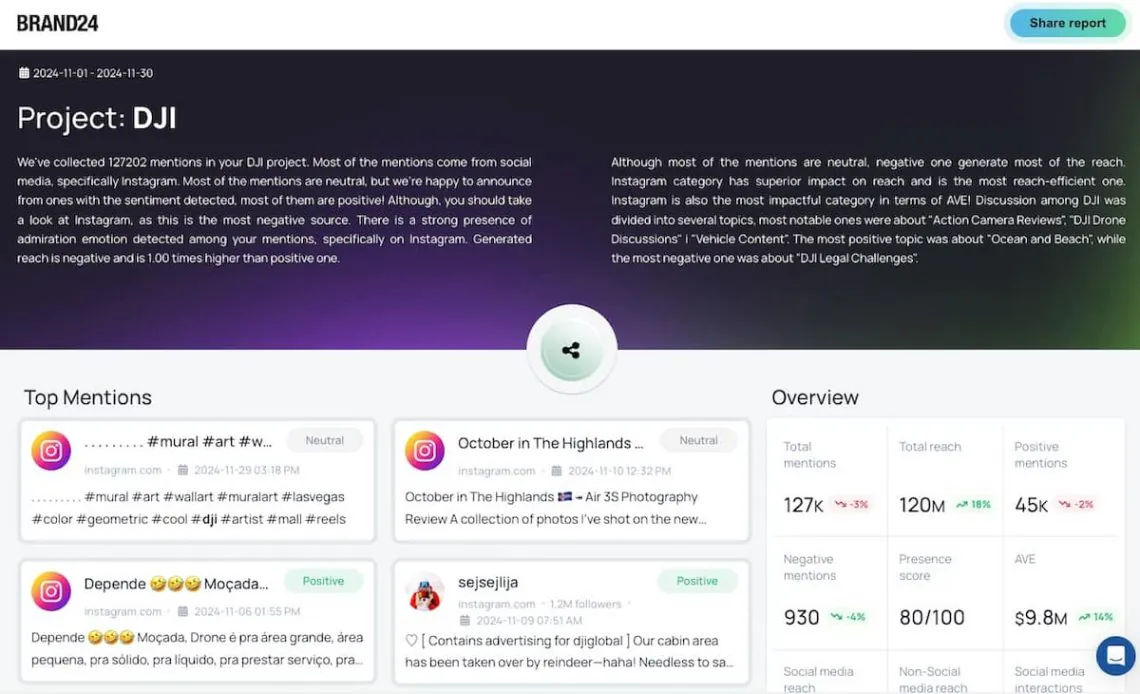
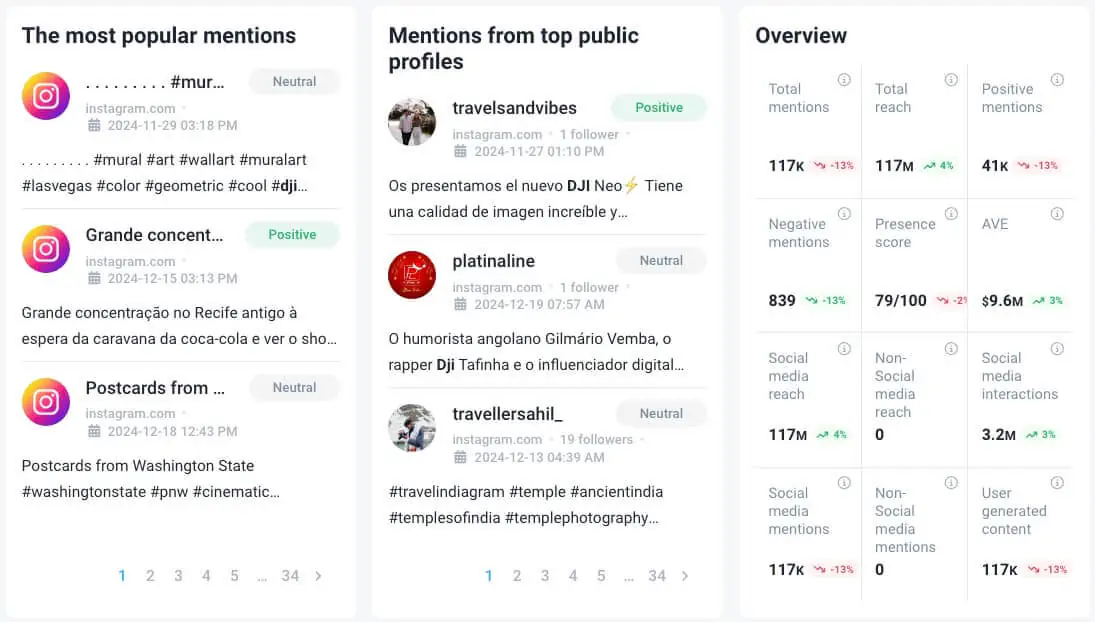
Okay, I know that this kind of Instagram analytics report template may not be enough for your specific needs.
So, let’s explore how to create a more detailed and tailored Instagram analytics report – step by step. Use the following points as elements of your template.
How to create an Instagram analytics report? 8 steps
01 Choose your goals
At the beginning, you should answer two essential questions regarding your Instagram analytics report:
- What is its main purpose?
Define why you are creating the report. Is it to analyze the performance of a recent campaign, track overall account growth, or identify trends to improve your content strategy? - Who do you create it for?
Specify the report’s target audience, such as your marketing team lead, upper management, or a client. This will help determine the level of detail and the type of Instagram insights to include.
From my experience, I must say that the most common Instagram analytics report goals include:
- Tracking engagement rates and trends
- Measuring Instagram campaign performance
- Analyzing audience demographics
- Optimizing posting strategy
- Identifying top-performing posts.
02 Choose key metrics
Alright, the first and the most important step is behind you. Now, it’s time to choose key Instagram metrics that align with your defined goals.
Depending on your needs, you can include the following metrics in your report:
- Follower growth rate
- Engagement metrics
- The volume of mentions
- Social media reach
- Hashtag performance
- Profile analytics
- Sentiment analysis
- Taps Forward / Back
- Reels Watch
- Reels Plays
- Best performing Reel
- Accounts engaged
For more detailed descriptions, I strongly encourage you to read our article about Instagram metrics written by a true social media expert.
03 Remember about data visualizations
No matter the goal of your report, who you plan to show it to, or which metrics you want to include, you must showcase your Instagram data in an attractive and easy-to-understand way.
Data visualizations are the simplest and most effective elements that can make your report look great and share the most essential data simultaneously.
I strongly recommend that you prepare templates for your visuals.
It’s much more effective than creating a new diagram, graph, or chart from scratch. Especially with simple graphic design tools like Canva or Piktochart.
As for types of visuals, use:
- Line graphs and progress bars to show growth and trends,
- Pie charts, bar charts, and tables to present audience and Instagram performance data;
- Word clouds and scatter plots to highlight relationships between metrics;
- Screenshots to provide context and real-world examples;
- Infographics to combine multiple Instagram analytics data into a concise summary.
04 Present clear insights
The first three steps are complete. Now, it’s time to transform raw data into actionable insights.
Focus on identifying key trends, patterns, and anomalies in your Instagram performance, highlighting successes and areas for improvement.
To illustrate this process, let’s look at one of the brands that achieved a marketing black belt – Red Bull.
It successfully leveraged Instagram to promote its Red Bull Dance Your Style campaign, a global street dance competition celebrating creativity and spontaneity.
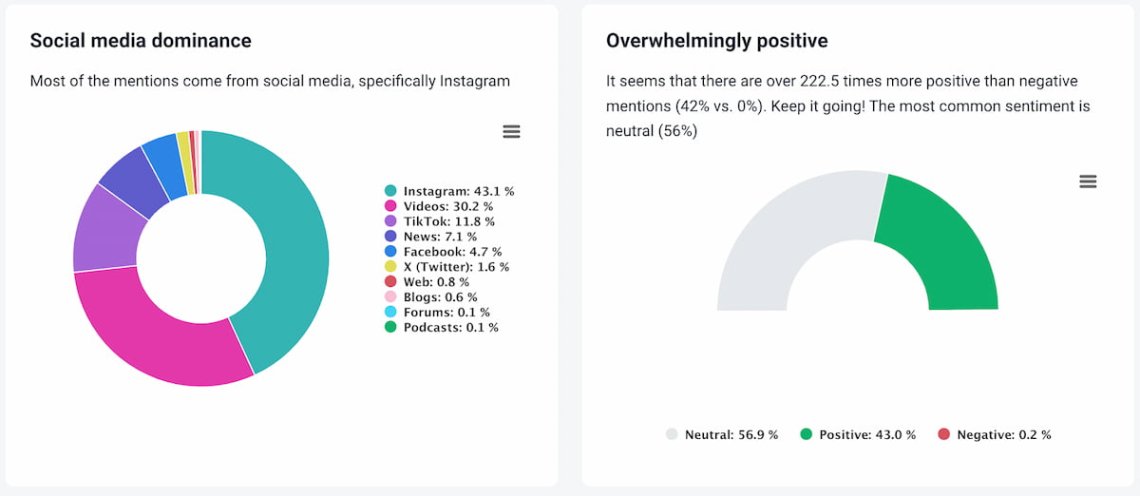
According to Brand24’s AI Metrics Analysis, Instagram was the main platform for this campaign, accounting for 43% of total mentions.
Moreover, the campaign generated over 222 times more positive than negative mentions, showcasing its strong audience connection.
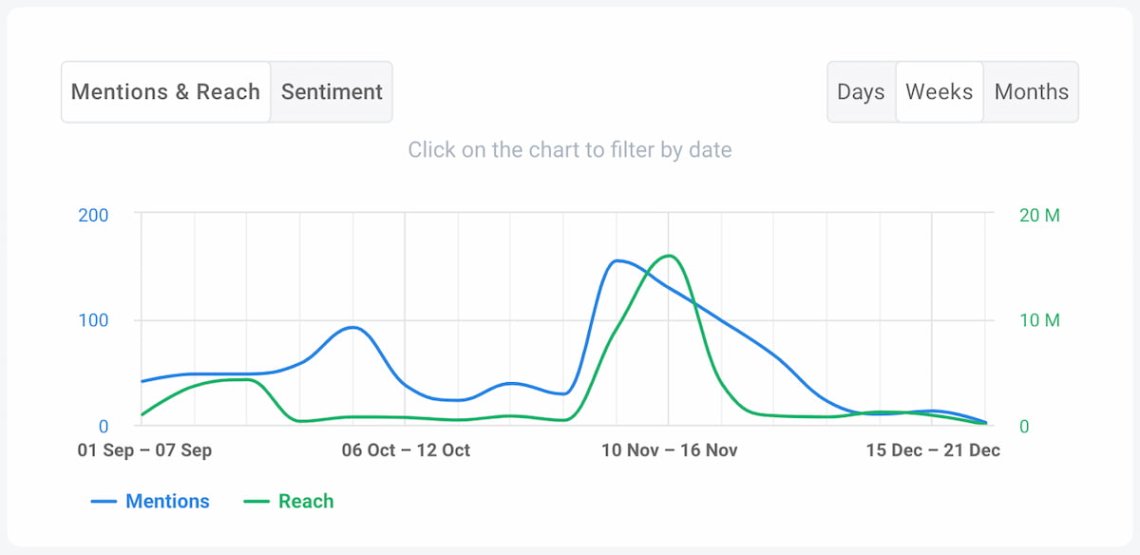
From September to December 2024, the campaign achieved impressive results:
- over 900 Instagram mentions,
- nearly 1 million interactions on the platform,
- +45 million Instagram users reached.
The peak interest happened on November 9th, when the Red Bull Dance Your Style World Final 2024 took place in Mumbai, India.
It marked the culmination of months of marketing efforts across multiple platforms, with Instagram playing a central role.
05 Compare data with previous periods
Tracking your Instagram performance and presenting it in the form of a report aims to show if you’re heading in the right direction or wandering in the fog. To fully understand it, you must have a reference point.
One such point is your past performance. In other words, you can compare the present state of your Instagram metrics with the analogical period in the past.
Unfortunately, Instagram Insights doesn’t offer a direct comparison feature. You can juxtapose data from different periods separately.
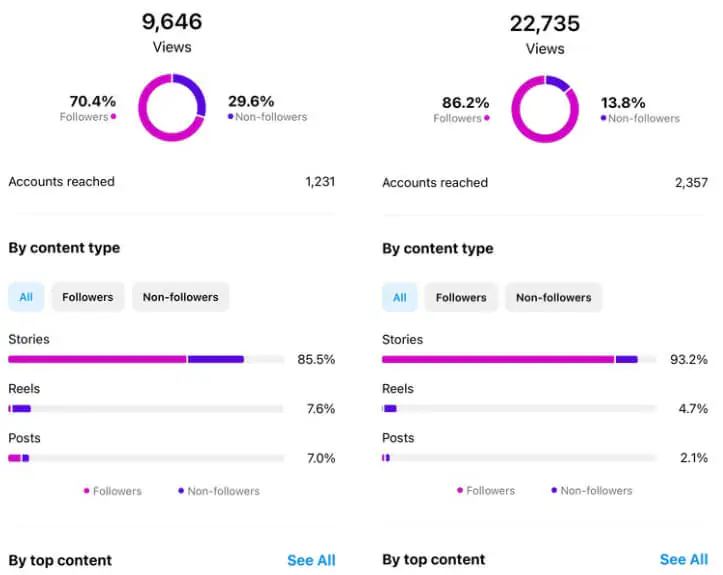
To compare them directly, create a dedicated Excel sheet to input your data and track progress.
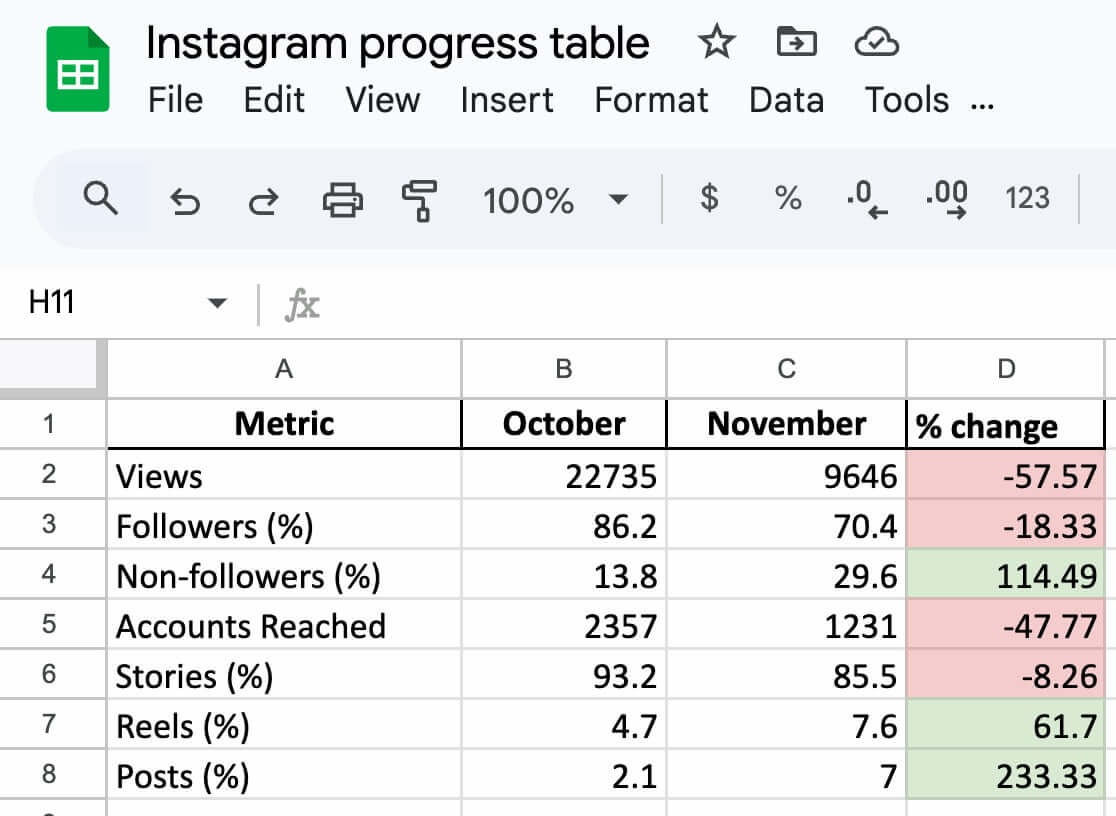
The good news is that most external Instagram analytics tools offer a comparison function.
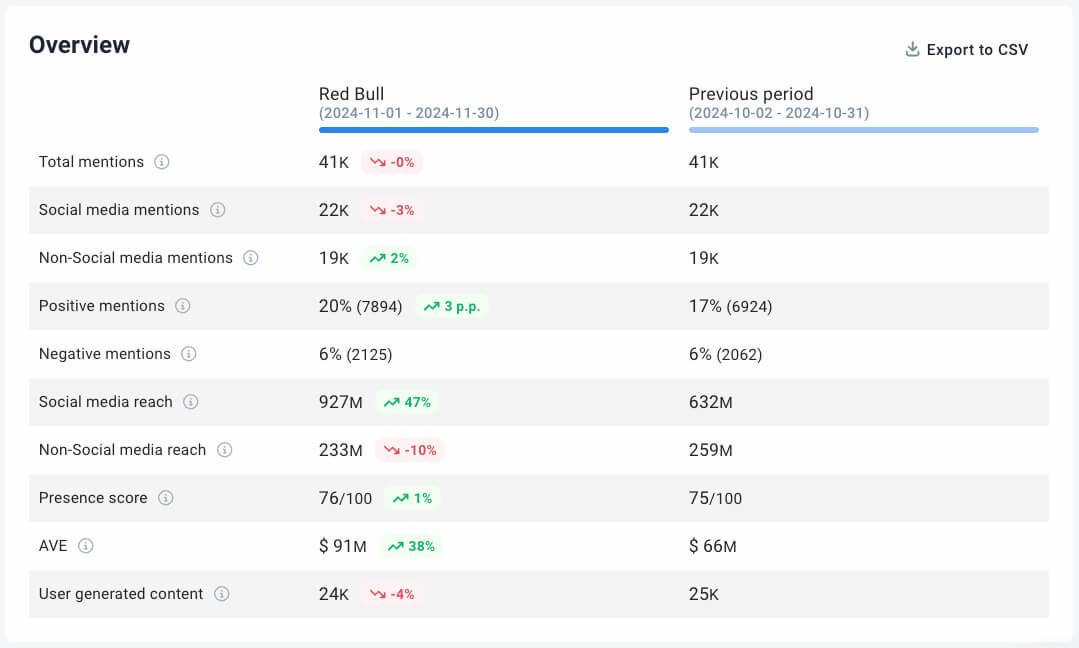
For example, Brand24 has a separate Comparison tab, where you can do two types of comparisons: with your past performance and with your competitor(s).
As for comparing periods, all you need to do is define the date range. The tool automatically visualizes the data, highlighting differences and trends over time.
I checked what it looks like in the case of Red Bull. It seems that their social media efficiency slightly dropped. To discover what caused that, I would need to do more detailed social media analytics.
06 Compare data with rivals
The second type of reference point in measuring your Instagram performance is comparing your metrics with those of your competitors.
This approach helps you benchmark your Instagram efforts with your industry rivals and identify areas where you may need to improve to stay competitive.
Besides, including competitor analysis in your Instagram analytics report provides its recipients with a broader context for your performance.
Okay, and how to do it in practice?
Just like in the case of comparing periods, native Meta solutions like Instagram Insights do not provide any advanced features for benchmarking with competitors.
In fact, all you can do is find your rivals’ profiles, visit them, and manually check how many followers they have, their top-performing posts, etc.
Fortunately, tools like Brand24 can do much more and much faster!
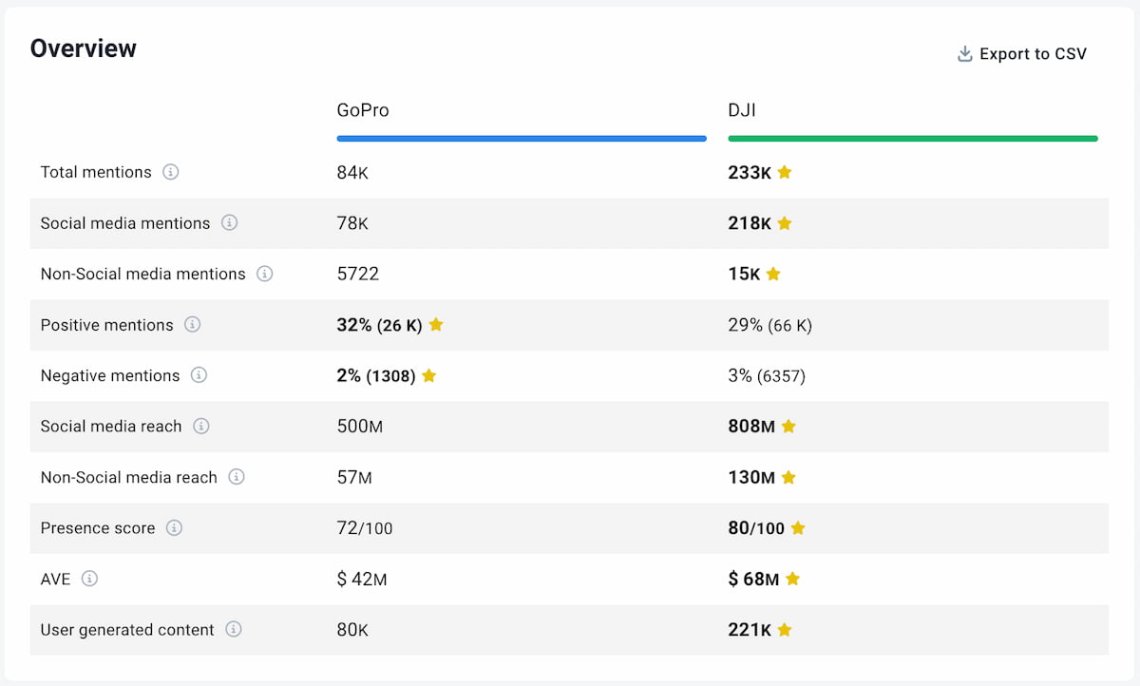
Again, open the Comparison tab. Now, pick “Compare projects” and select one or more competitors to juxtapose.
After a few seconds, you will see detailed analytics regarding your & your competitor’s brand mentions, social and non-social reach, Advertisement Value Equivalent (AVE), and more.
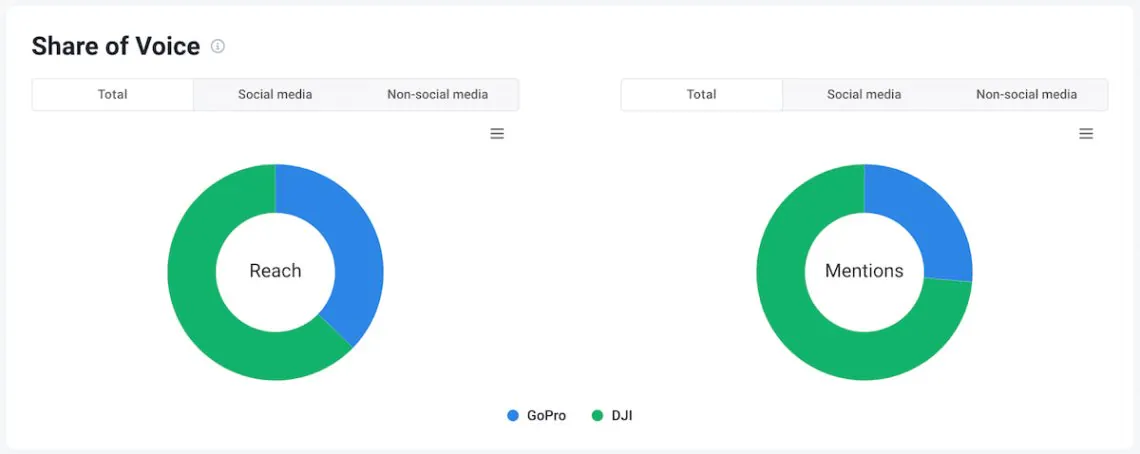
If you scroll down, you’ll notice two charts presenting your share of voice compared to your rival. You can take a screenshot and include them in your Instagram report template.
Check out our Instagram Competitor Analysis for more insights.
07 Include plans and recommendations
Instagram analytics report’s goal is not only to describe the reality and insights but also to deliver recommendations for the future.
This step transforms your report into a powerful tool for future planning and decision-making.
The best way to extract plans and recommendations from your report is to combine your own expertise with AI software capabilities.
In practice, you can simply copy-paste your report to an AI tool like ChatGPT and prompt it for recommendations. That’s a good starting point for basic reports.
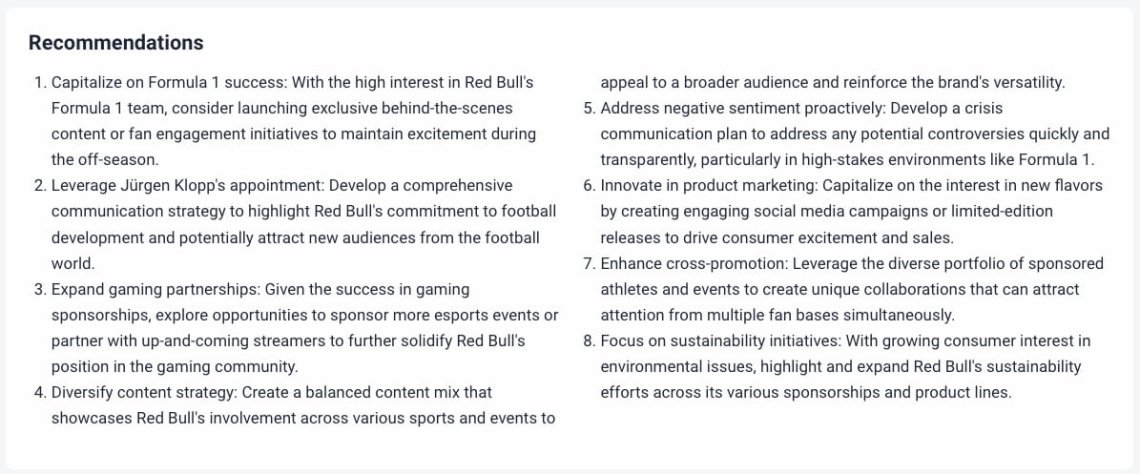
For more advanced perspectives, you can leverage AI-powered recommendations from more specialized tools like Brand24’s AI Insights.
It is an advanced feature that provides well-tailored reports presenting insights, trends, and – most importantly – recommendations.
Let’s go back to our Red Bull example.
According to AI Insights Recommendations, the energy drink brand should focus on enhancing its sponsorship strategies, particularly in areas like Formula 1 and football.
These sports resonate strongly with Red Bull’s audience and offer significant engagement opportunities.
08 Add summary
A good Instagram analytics report should be easy to read. Not everyone has time to go through all the details, so including a clear and short summary can make a big difference.
The summary gives readers a quick overview of the most important points without requiring them to examine every chart or table.
If you thought I would recommend AI to do it for you… You’re absolutely right!
Using tools like ChatGPT, you can generate a concise summary by simply inputting your report and asking for a brief overview of the most important points.
This saves time and ensures nothing significant is overlooked.
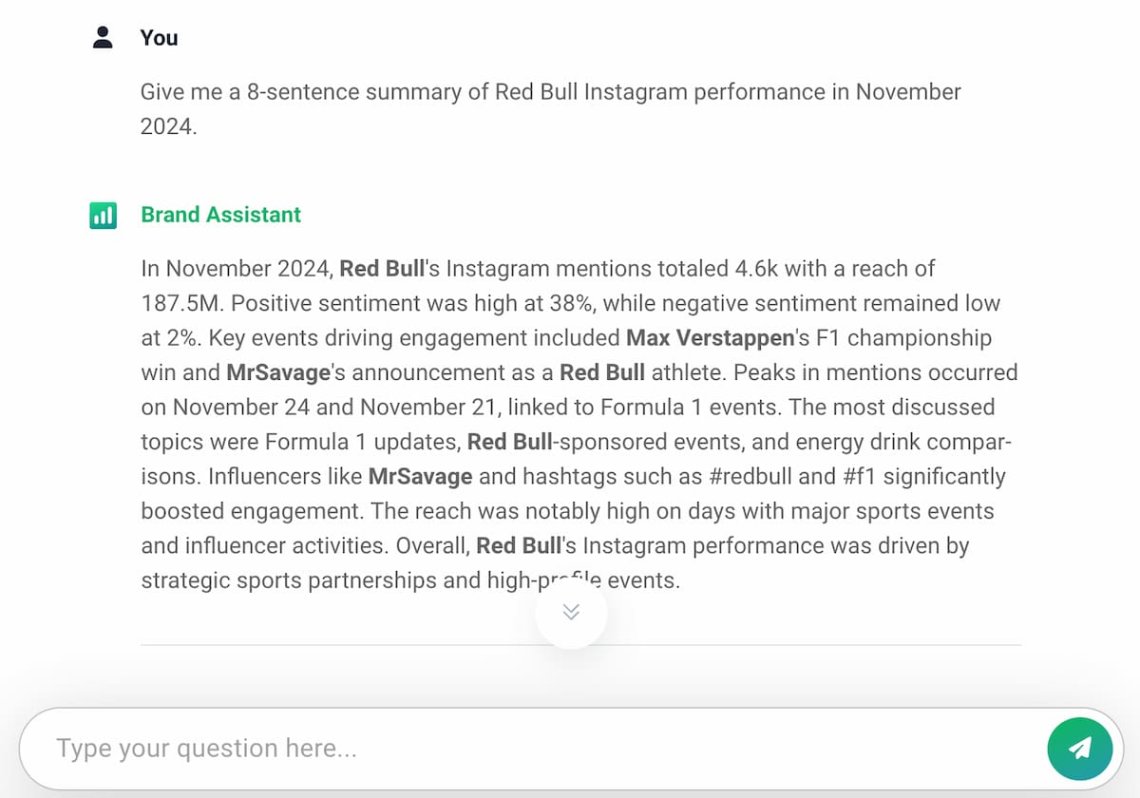
You can also use AI Brand Assistant – another great Brand24 feature. It’s better than ChatGPT, Gemini, or Perplexity because it has access to internal data.
Besides, Brand Assistant – and Brand24 overall – is specifically designed for social media and brand analysis.
Example?
I prompted the Brand Assistant to provide me with an 8-sentence summary of Red Bull’s Instagram performance in November 2024.
Honestly, that’s a ready-to-implement summary!
Conclusion
Creating an Instagram analytics report doesn’t have to be time-consuming or complicated.
By defining your goals and choosing the right metrics, you can focus on insights that truly matter for your Instagram marketing strategy. Tools like Instagram Insights or external platforms such as Brand24 can make data collection and analysis much easier.
Each report should have a reference point. Overall, it must show whether your Instagram strategy is heading in the right direction. Comparing your current performance with past periods or niche competitors helps to highlight trends and areas for improvement.
In addition to insights and trends, an Instagram analytics report also serves to present recommendations. They should be actionable and tailored to your specific goals.
Remember that your Instagram analytics report should be informative and easy to digest. You can achieve this by including appealing visual elements and summaries of the most important points.
And remember, a clear report makes your Instagram strategy shine brighter than your best selfie!
Final thoughts:
- A comprehensive Instagram analytics report combines data from internal (Instagram Insights) and external (i.e., Brand24) sources.
- The fastest way to create a report is by using an Instagram analytics report template.
- A well-crafted report not only tracks past performance but also sets the stage for future growth and success.
Start a Brand24 free 14-day trial and prepare an amazing Instagram analytics report fast!


