Table of contents
2M Marketers

All the data on LinkedIn can be confusing, right? Well, I’ve picked out and explained the most important LinkedIn metrics to help you out. Tracking LinkedIn analytics helps you understand how your LinkedIn page is doing – from how many people follow you to how they interact with your posts. So, read on and improve your LinkedIn performance!
Tracking LinkedIn metrics is a game-changer for optimizing your LinkedIn presence and building stronger connections. By monitoring LinkedIn analytics, you gain insights into what resonates with your target audience to enhance your content strategy and increase engagement.
Key LinkedIn metrics to track:
01 Follower analytics
Knowing who follows your LinkedIn page (and why) is key to tailoring your content effectively.
By understanding it, you can create more relevant and engaging content. And this can lead to higher engagement rates, better lead generation, and stronger professional relationships.
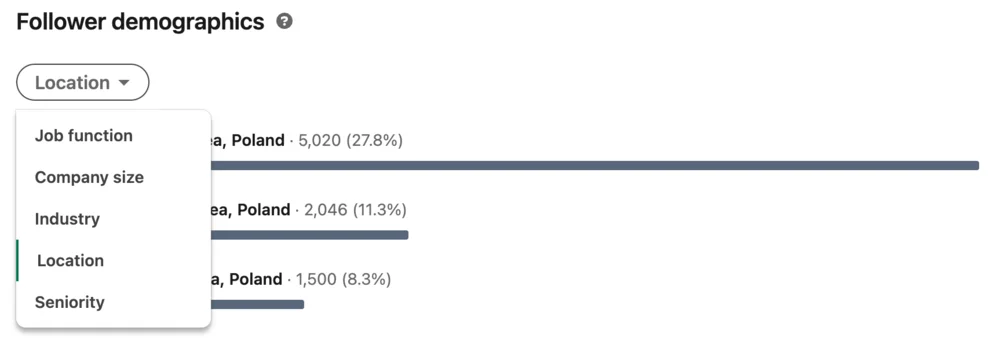
This metric includes demographic information like your follower’s industries, job roles, and seniority levels. Are they marketers or programmers? Juniors or seniors?
Your content will be very different depending on those aspects.
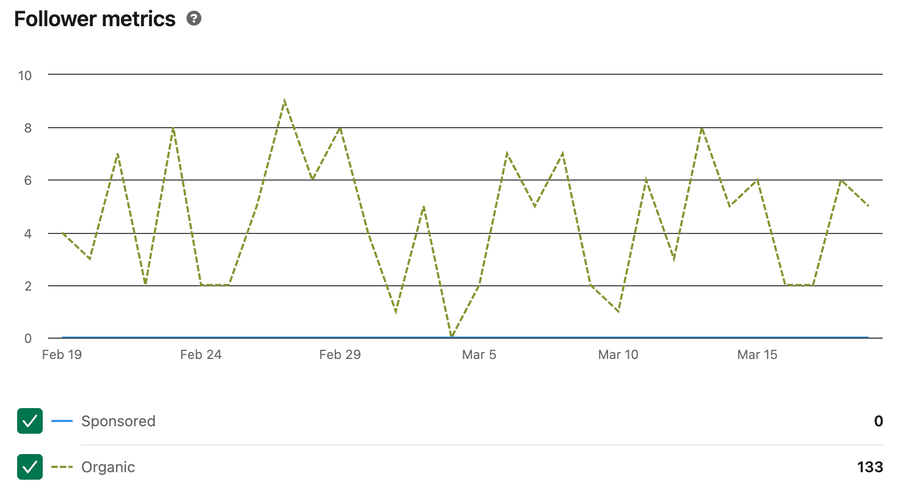
Follower analysis also tells you about your followers’ origins – whether they found you organically or through ad campaigns.
Knowing this balance between sponsored and organic followers can help you fine-tune your LinkedIn strategy for better audience engagement.
How to measure?
Measuring follower metrics is possible with LinkedIn’s analytics tools.
How?
Go to your LinkedIn page, click the ‘Analytics’ tab, and select ‘Followers’.
Here, you’ll see a detailed breakdown of your follower demographics. This feature also allows you to track the growth of your follower base over time.
It provides valuable insights into how your content is resonating with your audience.
The follower’s origin is nicely presented on charts as the one below:
02 The volume of mentions
Mentions on LinkedIn are super important but usually underrated.
Simply put, the volume of mentions stands for how many times other LinkedIn users used your brand name or related keywords.
Tracking mentions on LinkedIn helps you understand your brand impact and level of engagement within your professional network.
It’s also an essential tool for reputation management. By monitoring Linkedin mentions, you can understand how your brand is perceived, engage in relevant conversations, and respond to any negative sentiment swiftly and effectively.
The cool thing is that this metric can go beyond LinkedIn and reflect your visibility in the broader online discussions.
How to measure?
LinkedIn doesn’t offer a built-in tool for tracking mentions across the platform and the wider internet.
You’ll receive a notification like the one below if the mentions are tagged.
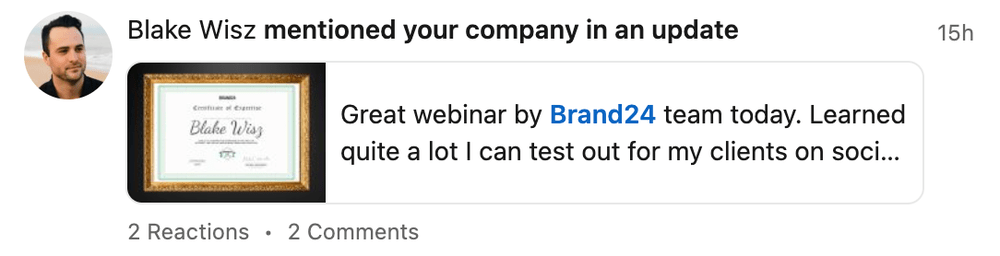
Sadly, you won’t be able to track the actual numbers and the untagged mentions without using media monitoring tools.
But don’t worry!
Social listening tools come to the rescue, allowing you to track mentions on LinkedIn and across other social media platforms, blogs, and forums.
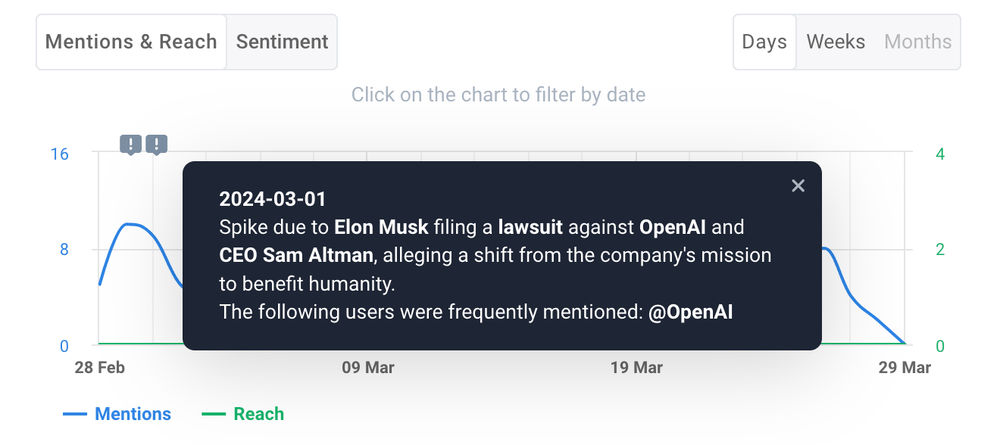
This is what a LinkedIn untagged mention looks like in a Brand24 dashboard:

Tools like Brand24 can monitor these mentions and provide data on sentiment, the share of voice, presence score, reputation score, and AVE.
Plus, AI technology detects anomalies or spikes in your brand’s mentions. These can indicate a boost in popularity or an issue needing immediate attention – the detector has the answer!
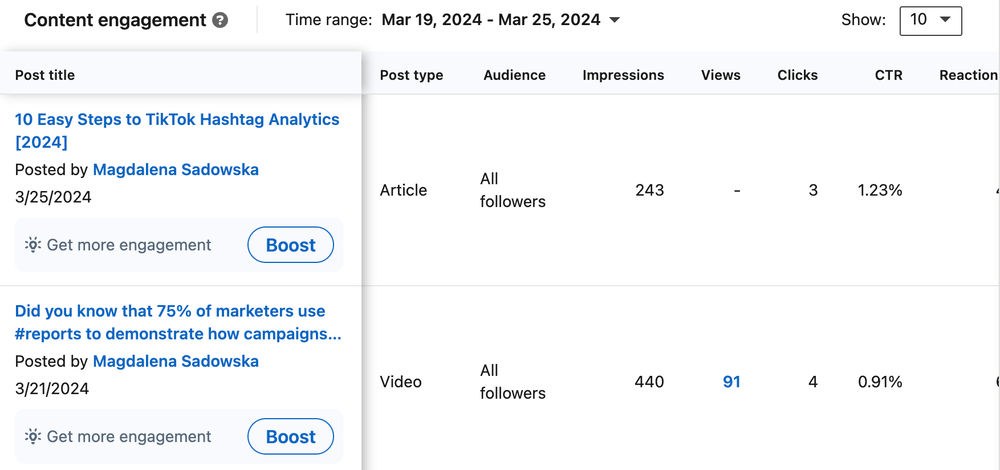
03 Content engagement
LinkedIn analytics include several key indicators regarding engagement, which is more like a whole LinkedIn metrics category.
Tracking these metrics helps you understand which types of content resonate with your audience. High engagement signals your content is relevant, engaging, and valuable to your followers.
This, in turn, can increase your content’s reach and strengthen your brand’s presence on LinkedIn.
In terms of content engagement, it is worth tracking metrics like:
- Impressions
It’s a number of times your post was shown to LinkedIn users (both organic and paid).
- Reactions
This is the summed number of all reactions your content received.
On LinkedIn, there are 7 different reactions imitating emotions: Like, Celebrate, Support, Funny, Love, Insightful and Curious.
Getting a reaction is almost always good, as it generally means your content has drawn attention.
However, in some contexts, these reactions can be ironic (so not positive), and you should be aware of it.
That’s why using external sentiment analysis tools is valuable. This analysis will allow you to truly understand how your audience feels and how to adjust your social media strategy.
- Post clicks
It’s the number of times users click on links, media, the “more” icon, or your organization’s page from your post during a certain time.
- Views
This one counts the number of times users have watched your video content. This metric is a solid indicator of how engaging and compelling your video materials are.
- Shares
Shares indicate the number of times your post was shared by LinkedIn users. Posting shareable content helps you increase reach, visibility, and brand awareness. In this case – the more, the better.
- CTR (click-through rate)
The click-through rate (CTR) is a percentage of the number of clicks divided by the number of impressions on a post. This metric shows how much your content inspires the audience to click on your company name, content, or “more” to read the whole caption.
- Follows
The total number of Followers clicks on your sponsored content.
- LinkedIn engagement rate
This metric is expressed as a percentage and sums up the average engagement level of your LinkedIn posts.
- Total engagements
This is the number of interactions users had with your post (including likes, comments, shares, and clicks). In this case counts the same way both organic and sponsored posts.
How to measure?
LinkedIn provides these metrics directly. You can see each post’s likes, comments, shares, and clicks on your LinkedIn page in Analytics > Content.
For a more comprehensive view, LinkedIn’s analytics section breaks down these metrics over time, showing you trends and patterns in your audience’s engagement with your content.
Don’t need such details?
Highlights that are placed in LinkedIn analytics at the top of the Content tab work like a preview of more detailed analytics.
You’ll find information about the total number of reactions, comments, and reposts to your content during the selected period.
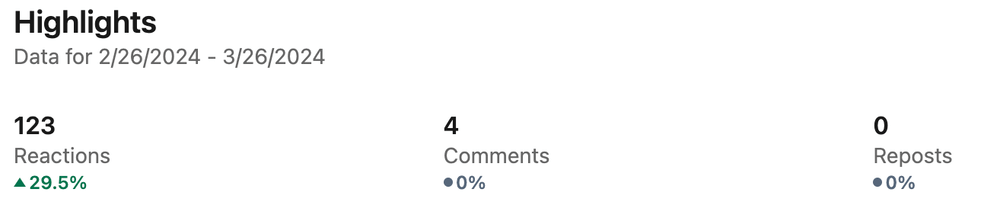
Tracking the highlights tab is a great starting point. It’s super simple and, just as the name suggests – highlights the essential metrics.
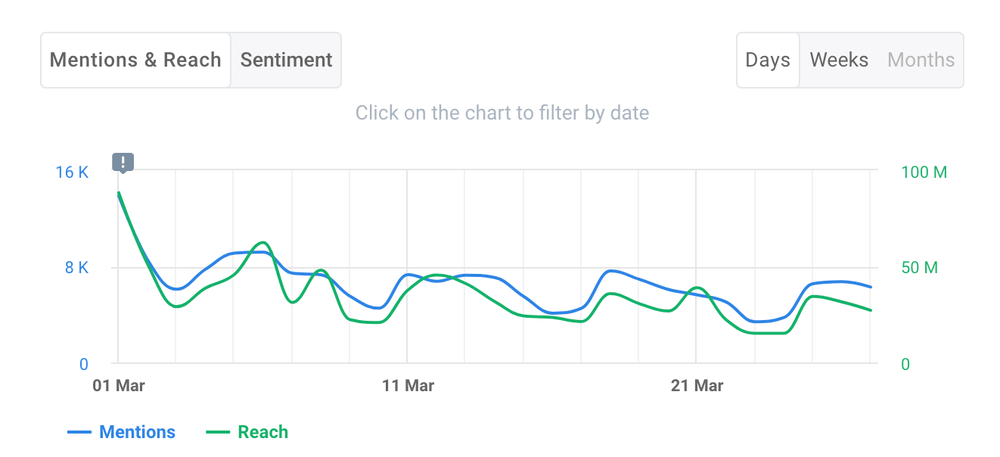
04 Social media reach
This is basically the average scope of how far and wide your posts travel across the internet.
Why should you track it?
The more your LinkedIn posts make your brand appear in conversations beyond LinkedIn, the more it grabs attention, creates interest, and brings in new followers.
It’s all about making your content magnetic enough to pull in views and engage well-targeted new audiences.
How to measure?
Social listening tools like Brand24 can measure social media reach. They can track how widely your brand and your content are shared and discussed across various platforms.
It’s not just about tracking online presence. It’s about understanding the dynamics of how your LinkedIn content resonates across the digital world.
In the long run, this data will give you a broader understanding of your content’s visibility so your future posts will perform better.
Data sources of Brand24 include:
- Social media platforms (Instagram, TikTok, Instagram, LinkedIn, YouTube, Facebook, Reddit, Telegram)
- Review sites TripAdvisor, Yelp, Booking, App Store, Google Play, Trustpilot
- Blogs
- Video platforms
- Podcasts
- Discussion forums
- Newsletters
- Online news sources
- Other publicly available sources
05 Visitors
Visitors analytics give you insights into who’s checking out your company page. These visitors could be anyone who stumbled upon your page and showed interest in what you offer.
LinkedIn analytics provides more 3 detailed visitor metrics to track:
- Page views
This metric counts whenever someone looks at your page within a chosen time frame. It’s the total number of views, including if the same person visits multiple times.
- Unique visitors
Unique visitors are different. This number tells you how many individual people have visited your page, not counting repeat visits. It’s like counting each person who walks into your shop just once, no matter how many times they return.
This metric is great for seeing how many unique individuals are interested in your company.
- Visitor demographics
Here’s where things get more specific. The visitor demographics section lets you see the types of people visiting your page. You can sort this info by their location, the industry they work in, their job roles, the size of their company, and their level of seniority.
How to measure?
All these visitor analytics can be found in the LinkedIn Analytics tab and “Visitors”.
You can filter your data by source type (mobile/desktop) and a specific page.
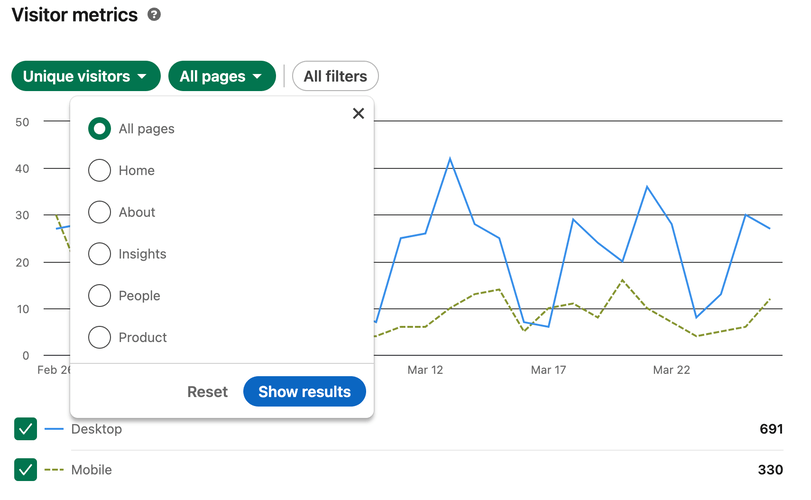
Plus, it’s possible to download this data in sleek LinkedIn analytics reports.
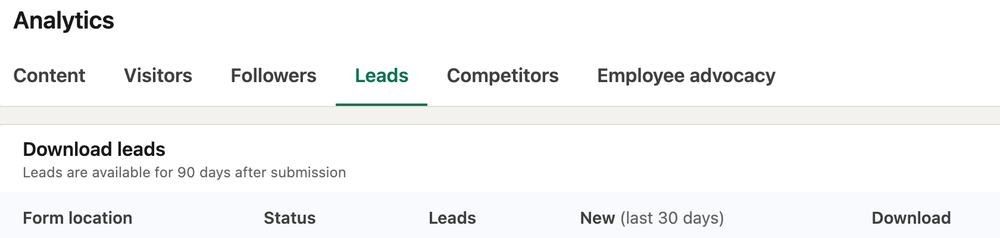
06 Leads
LinkedIn leads are potential clients who’ve shown an interest in your business through LinkedIn.
They may engage with your profile, content, ads, or indicate their interest by providing contact information or expressing a desire to learn more about your services or products.
These leads are particularly valuable for the B2B sector, where LinkedIn’s professional user base includes many decision-makers.
LinkedIn offers various internal tools for lead generation:
- LinkedIn Ads
- Sponsored InMail
- LinkedIn Sales Navigator
- LinkedIn Lead Gen Forms
How to measure?
- Track Ads and InMail messages
Monitor how many users interact with your LinkedIn Ads and Sponsored InMails, and how many of these interactions convert into leads. - Analyze Lead Gen Form submissions
Pay attention to the number and quality of submissions through your Lead Gen Forms. This can become a direct measure of interest generated from your campaigns. - Monitor Sales Navigator
If you decide to use Sales Navigator, track how your identified prospects engage with your content and how many convert into leads.
Pro tip: Remember, not every engagement on LinkedIn is a potential lead.
If you make content that is relevant to what your LinkedIn audience network wants and needs, you’re more likely to get good leads.
07 Competitors
Competitors serve in LinkedIn analytics as a place to compare your LinkedIn performance to others.
These metrics are all about your social media performance on LinkedIn vs your competitors. They track how your page’s posts have been doing within the time range you select.
You can easily access this data and compare your brand performance regarding important social media metrics like:
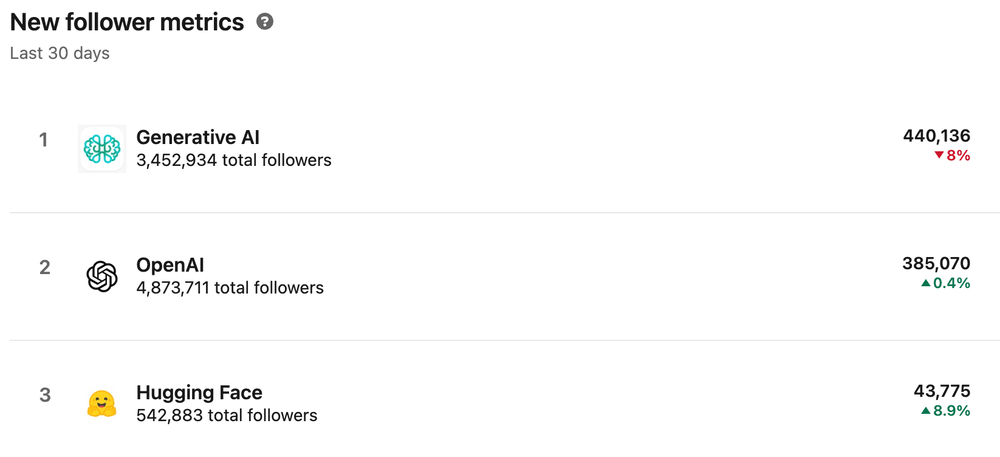
- New followers (new followers gained within the last 30 days)
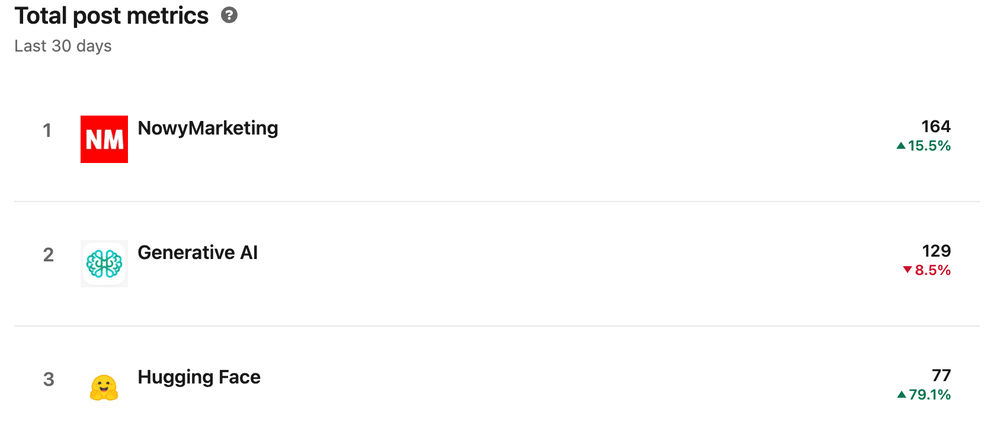
- Total post (all content added to the company page)
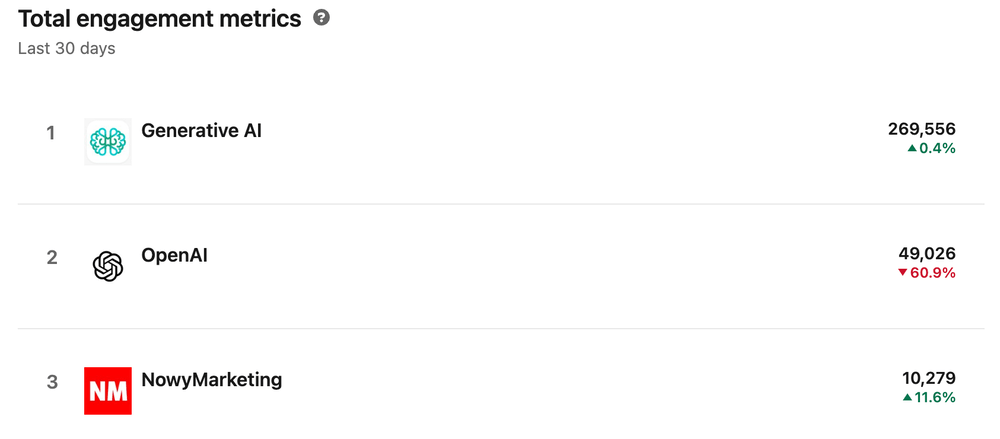
- Total engagement (LinkedIn reactions, comments, and shares)
Want to know what’s hot in your industry?
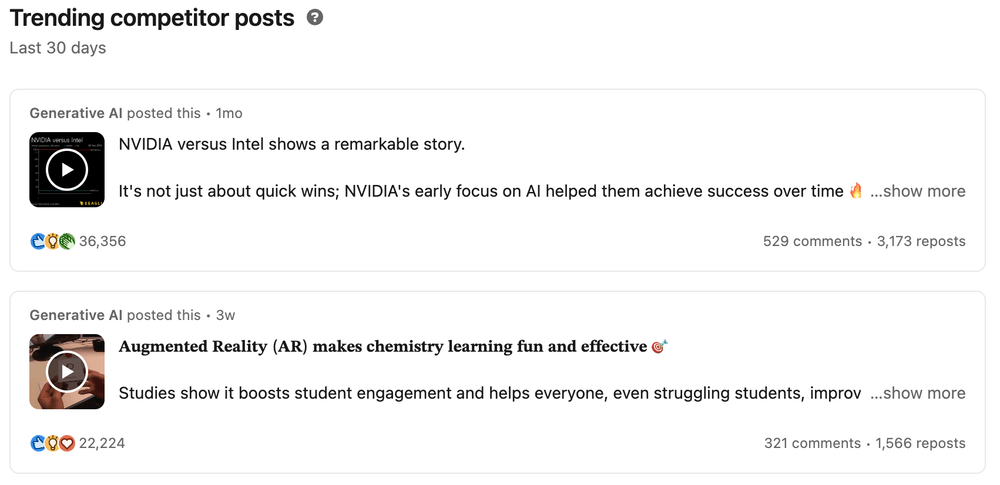
Here’s the cool part: The Competitors tab shows you the top original posts made by your competitors in the past 30 days.
This can give many valuable insights for staying in the loop regarding what your peers discuss on LinkedIn.
The data here is updated daily, so you’re always getting the freshest insights into your competitive landscape.
The less fun – these metrics are quite basic and definitely not enough for a well-crafted competitive analysis report.
How to measure?
After adding their profiles to your competitor analytics, you can access LinkedIn analytics related to competitors’ pages. You need to go to Analytics > Competitors > Edit Competitors.
The list of competitors can contain up to 9 competitors’ LinkedIn pages.
After adjusting the list, you get the LinkedIn analytics reports of each company page and a percentage of how you’re doing compared to them:
08 Employee advocacy
LinkedIn highlights the value of employee advocacy and admits that employee content drives the best engagement:
While only 3% of employees share content about their company, those shares are responsible for driving a 30% increase in the total engagement a company sees.
Here’s a quick case study:
Visa teamed up with LinkedIn Elevate for an employee advocacy program.
The goal? To spotlight innovative work in local markets worldwide and establish themselves and their employees as thought leaders.
The results? Since starting with Elevate, Visa’s employees have been sharing content six times more than before. What’s more, their shares have quadrupled the followers on Visa’s Company Page.
It’s a great example of how powerful employee advocacy can be in amplifying a brand’s presence on LinkedIn.
Ok, all fun and games, but…
Establishing an employee advocacy program is difficult and requires lots of marketing efforts. Especially for small to medium companies.
However, LinkedIn analytics provides a lot of metrics to measure your results, which makes the whole thing a bit easier.
You can easily track analytics related to:
- Recommendations
- Employee posts from recommendations
- Reactions to posts
- Comments on posts
- Reposts
Plus, it’s possible to filter these metrics by:
- Location
- Seniority level
- Job function
- Industry
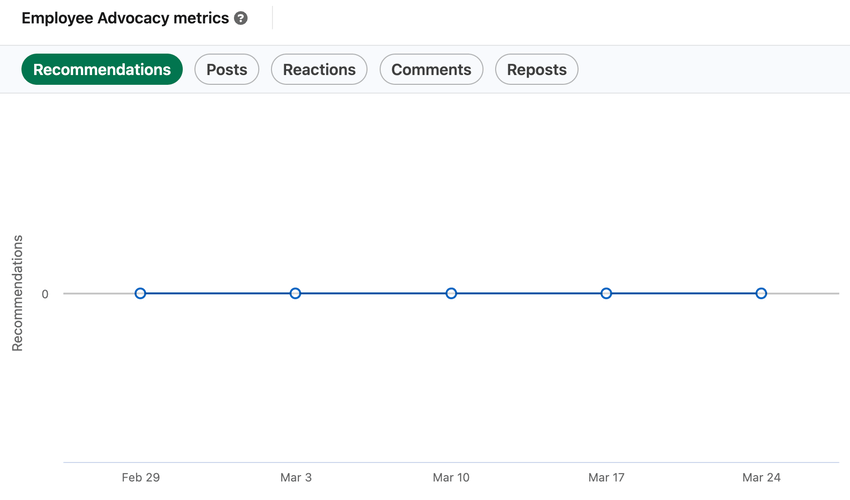
How to measure?
You can measure this metric by going to LinkedIn Analytics > Employee advocacy.
But remember that you’ll only access in-depth insights if you gain enough content. Otherwise, you won’t be able to track these data points.
Tip: Advanced tools can analyze metrics for you
LinkedIn provides a lot of detailed metrics. But navigating and choosing the important ones can be challenging.
No worries, though!
Internal LinkedIn analytics is not your only option. With today’s technology, you can find LinkedIn analytics tools that will gather the most important data and analyze it for you.
You’ll receive a ready-to-use report and go straight to the best part – improving your LinkedIn marketing efforts.
Let’s take a look at Brand24. It uses advanced AI technology that can analyze your data within seconds. No more wasting time on manual analysis!
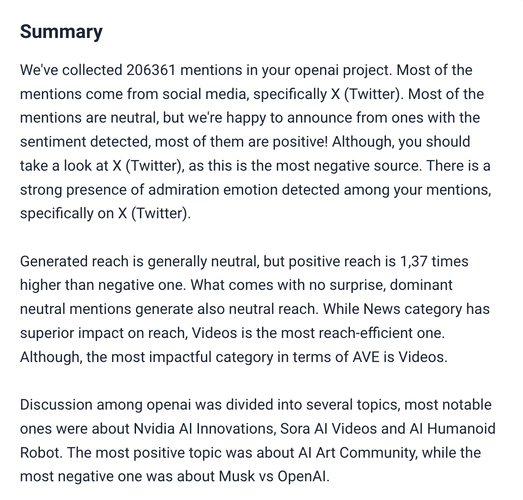
This is what a Metrics Analysis looks like in the tool. It summarizes your project data neatly, offering a concise overview of your LinkedIn performance.
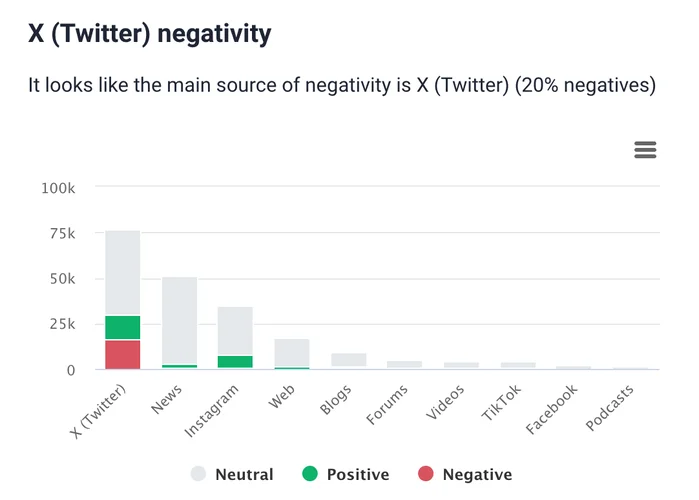
Brand24 doesn’t just count your social mentions – it looks at the feelings behind them. It sorts these mentions into positive, negative, or neutral and addresses the sources they come from.
It’s useful because it shows you where the most negative feelings come from. This helps you see what parts of your marketing strategy might need some work or changes.
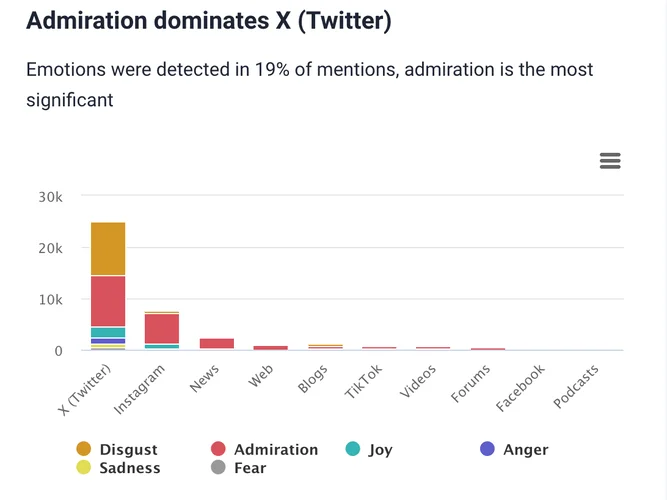
And here’s a fun feature – the tool can even detect exact emotions.
Despite being cool, this feature can be a game changer in understanding how your audience really feels about your content.
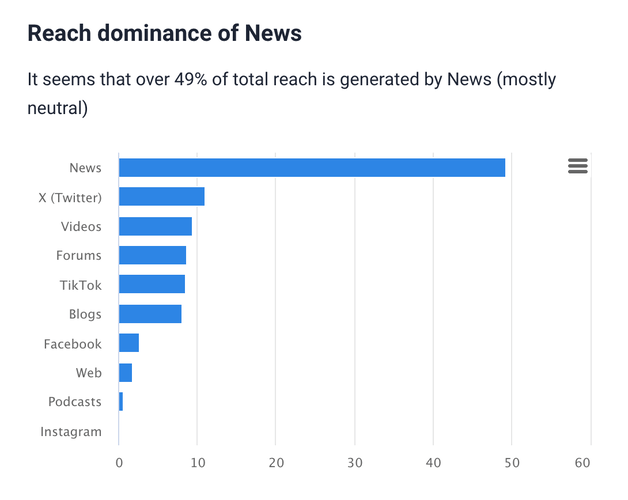
Another great aspect of using Brand24 with your LinkedIn strategy is how the tool defines the most efficient source in reach.
This feature lets you identify where your marketing strategy works best. Knowing this helps you fine-tune your approach, ensuring you’re focusing your resources in the right areas for the best results.
Conclusion
And there you have it! We’ve navigated through the essential LinkedIn analytics you should be tracking in 2024.
Let’s be honest, it’s a hefty list, but mastering these metrics is key. Incorporating advanced tools like Brand24 into your strategy can simplify tracking these metrics.
Key takeaways:
- Knowing your target audience is at the heart of a successful LinkedIn presence. Metrics that offer insights into their interests and behaviors are gold.
- Engagement metrics on LinkedIn are crucial. Whether it’s through likes, comments, shares, or post clicks, these metrics are vital signs of your strategy’s performance.
- Remember, the goal isn’t just to collect data. Gain insights to refine your content, grow your professional network, and boost your brand on LinkedIn.
Ready to boost your LinkedIn performance? Start with a Brand24 trial and transform insights into action!