Table of contents
15 Key Digital Marketing Metrics You Should Track in 2026
Ever feel lost in a maze of marketing metrics? Don’t worry, you’re not alone! Many businesses struggle to understand which marketing metrics truly matter. But here’s the good news: data can be your secret weapon! Companies that use customer insights outperform their competitors by 85% in sales growth.
Example? Spotify. They used data-driven marketing to personalize music recommendations, and their popularity skyrocketed in a crowded market.
This article is your guide to mastering marketing metrics. Let’s dive in and explore how you can unlock similar growth for your business!
Marketing metrics are measures used to evaluate the effectiveness and performance of marketing strategies and campaigns. They are crucial as they provide insights into how well marketing efforts drive engagement, conversions, and ROI. One of the most important aspects of this evaluation is tracking key performance indicators (KPIs).
Key digital marketing metrics to track:
01 Cost per acquisition (CPA)
Imagine you’re at an archery contest, where each arrow represents a bit of your budget, and the bulls-eye is a new customer.
This is the essence of Cost Per Acquisition (CPA), a crucial metric in the marketing world.
CPA calculates how effectively each dollar is spent.
Understanding CPA is essential, but it’s also important to consider the customer acquisition cost (CAC).
Customer acquisition cost measures the total cost of acquiring a new customer, including all marketing and sales expenses.
By analyzing both CPA and CAC, businesses can gain a comprehensive view of their marketing efficiency and overall performance.
How to measure?
Add up the cost of your marketing efforts. Then, count how many customers you’ve acquired. Divide the total cost by the number of hits, and voila, you have your CPA.
Let’s count it together!
If you’ve spent $500 on your marketing arrows and hit 50 targets, your CPA would be $10 per customer.
Why should every marketing team watch CPA?
By lowering your CPA, you can:
- Allocate your budget more effectively, ensuring no dollar is wasted.
- Sharpen your targeting and focus on the most efficient channels.
- Adjust pricing with the right balance of costs and competitiveness.
- Adapt quickly by adjusting strategies based on real-time data.
As any pro archer would tell you…
Track key marketing metrics!
02 The volume of mentions
It is a crucial marketing metric that shows how often your brand is discussed online.
This metric is important because it helps understand the reach and impact of your marketing efforts.
How to measure?
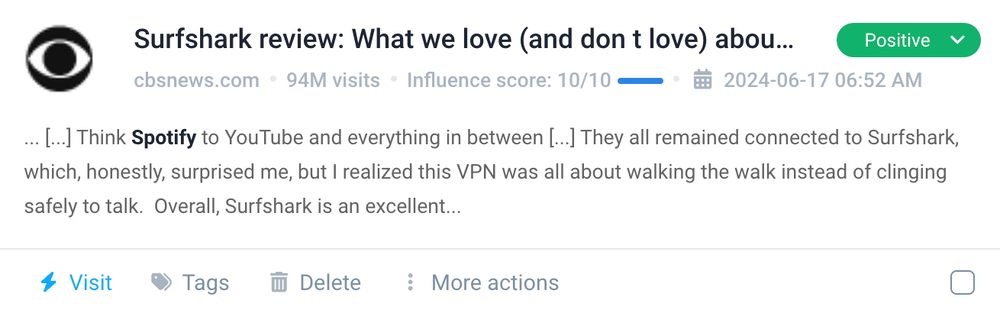
Marketers use advanced tools like Brand24, Brandwatch, or Hootsuite to measure the volume of mentions. These tools collect data from various sources and analyze your data for you.
For example, Brand24 data sources include:
- Social media platforms such as Facebook, Instagram, LinkedIn, YouTube, Twitter, TikTok, Reddit, Telegram, and Twitch
- Review sites such as TripAdvisor, Yelp, Booking, App Store, Google Play, Trustpilot
- Blogs
- Video platforms
- Podcasts
- Discussion forums
- Newsletters
- Online news sources
- Other publicly available sources
These social listening tools analyze the number of times your brand is mentioned and provide details about the context and sentiment of these mentions.
You should track the volume of mentions to:
- See how well your brand is being recognized and discussed
- Understand customer feelings about your products
- Identify the best influencers for your brand
- Take care of any PR crisis before it escalates
This information is vital to improve brand awareness and customer engagement.
By monitoring this metric, marketers can respond quickly to changes in public perception and capitalize on positive trends to boost their brand’s presence and effectiveness.
03 Cost per Lead (CPL)
It measures the cost-effectiveness of marketing campaigns in generating potential customers or leads.
How to measure?
To determine your CPL:
- First, total all the expenses related to a specific marketing campaign.
- Then, count the number of leads that the campaign generated.
- Divide the total campaign cost by the total number of leads to find your CPL.
For instance, if you spent $300 and generated 30 leads, your CPL would be $10 per lead.
Why do marketers track CPL?
Marketers focus on CPL to improve the efficiency of their marketing investments.
A lower CPL indicates that you use your marketing budget effectively to attract more leads.
Monitoring and striving to reduce CPL helps businesses allocate their resources wisely. It ensures that each dollar spent contributes to valuable customer engagements.
04 Social media reach and non-social reach
Each post you share sends ripples across the digital waters and touches the screens of countless users.
The social media reach metric measures how far each ripple travels and how many shores it reaches.
And if my “pro writer metaphor” wasn’t clear enough – each shore is a unique viewer.
Non-Social Reach, on the other hand, extends beyond these familiar waters into the broader sea of digital and traditional media. This includes viewers reached through websites, email newsletters, press releases, podcasts, and forums.
By tracking marketing metrics across these different channels, marketers can monitor and analyze the effectiveness of their marketing efforts and understand how well they are engaging their target audience.
Monitoring both social and non-social reach ensures you get a full view of your message’s impact.
How to measure?
You can try to count it manually. Most social media platforms provide this data in their analytics panels.
But good luck with the non-social reach… I don’t think it’s even possible to find this data without additional tools.
You may need to employ tools like Google Analytics for website traffic and email marketing tools for newsletter engagement.
Or, go for one of the media monitoring tools to gather this data in one place.
Why do marketers track reach?
Marketers track these marketing metrics to see how effective their content is.
A wider reach means more eyes on the brand. That means greater brand recognition and increased engagement.
Plus, by understanding where your audience is most active (whether on social media or other channels), you can tailor your strategies to engage them more effectively.
Monitoring reach helps marketing teams adapt their messages, ensuring they resonate well across all media.
05 Customer Lifetime Value (CLV)
Customer Lifetime Value (CLV) quantifies the total revenue a business can expect from a single customer throughout its relationship.
It’s a pivotal metric for understanding the long-term value of investing in customer relationships.
How to measure?
To calculate CLV, multiply the average purchase value by the average number of purchases a customer makes in a year. Then, multiply that result by the average customer lifespan (in years).
For example, if the average purchase value is $50, the average purchase frequency is 4 times per year, and the average customer lifespan is 5 years, the CLV would be:
$50 * 4 * 5 = $1,000.
Why should you track CLV?
Understanding CLV will help you identify the most profitable segments of your customer base. This information shows where to focus marketing efforts for maximum return.
Tracking CLV encourages businesses to shift from short-term gains to long-term profitability.
Engaging existing customers is crucial in this context, as retaining them can significantly improve customer retention metrics and maximize customer lifetime value.
By dedicating marketing campaigns to existing customers, businesses can cut marketing costs and ensure long-term profitability.
06 Click-through rate (CTR)
Every click signals interest and propels your audience through the digital journey, right from initial curiosity to potential conversion.
Click-through rate measures the percentage of people who click on a specific link compared to the total number of people who view the page, email, or ad.
It’s a direct measure of the effectiveness of your digital advertising.
How to measure?
To calculate CTR, divide the number of clicks a link receives by the number of times the corresponding ad is shown, then multiply by 100 to get the percentage.
Let’s break it down:
If your campaign ad were displayed 1,000 times and received 100 clicks, your CTR would be 10%.
Why is this metric crucial?
A high CTR indicates that your ads are well-targeted and relevant, attracting the right audience.
Keeping track of CTR helps:
- Optimize your ad creation (copy, etc).
- Refine targeting strategies to enhance relevance.
- Boost your campaign’s overall performance.
- Manage your ad spend effectively by focusing on what works.
So, are your digital arrows hitting the mark or missing the target?
07 Sentiment
It is a measure of the emotional tone behind how people talk about your brand across various platforms.
It’s a crucial indicator of your brand’s health. Plus, it has a significant impact on everything from sales to customer loyalty.
Sentiment can be positive, negative, or neutral and is nuanced; a brand isn’t simply loved or hated but exists in a spectrum of public opinion based on the context.
How to measure?
Brand sentiment can be gauged through:
- Direct feedback – collect insights via surveys, focus groups, and online reviews.
- Tools analysis – Use tools that can scan your social mentions for tone and emotion.
- Word of mouth – Harder to measure but incredibly valuable, this includes customer recommendations and more personal feedback channels.
The most accurate method is using a specialized tool as it will gather a vast amount of data and create a more qualitative analysis.
Why does sentiment matter?
Brand sentiment is important for several reasons:
- Positive sentiment can translate directly into better business outcomes, enhancing everything from market share to profitability.
- Keeping a pulse on sentiment helps you manage and respond to potential crises more effectively.
- Understanding sentiment helps you grasp how well your product or service meets customer expectations.
- Strong positive sentiment boosts brand equity, strengthening customer loyalty and the overall value of your brand in the market.
08 MQL to SQL ratio
Welcome to the sales funnel world! This metric is all about how your Marketing Qualified Leads (MQLs) transform into Sales Qualified Leads (SQLs).
This ratio measures the effectiveness of converting initial leads (MQLs) into potential sales opportunities – sales qualified leads (SQLs).
It’s a clear indicator of how well your marketing team qualifies leads. They should meet your sales team’s criteria and the impact of your marketing initiatives.
How to measure?
Calculate by dividing the number of SQLs by the number of MQLs and multiplying by 100 to get a percentage.
To make it clear:
If you generate 100 MQLs and 25 of those become SQLs, your MQL to SQL ratio is 25%.
Why does it matter?
It sheds light on:
- The quality of leads generated by marketing efforts.
- The alignment between marketing and sales teams.
- Areas for improvement in lead nurturing and qualification processes.
Every marketer’s goal is to boost this ratio, ensuring that the sales team receives the cream of the crop.
09 Return on Investment (ROI)
ROI isn’t just a metric; it’s the ultimate measure of marketing success.
Cause the question is: Are you making money or just spending it?
ROI compares the profit generated by your marketing efforts against the cost of those efforts. It’s the king of business metrics, indicating whether you’re on the path to profitability.
How to measure?
- Subtract the marketing cost from the sales growth attributable to that marketing.
- Then, divide it by the marketing cost.
- Multiply by 100 for your ROI percentage.
Example? There you go!
Your campaign cost $1,000 and generated $4,000 in sales. Your ROI is 300%.
Why should you focus on ROI?
ROI is important because it:
- Justifies your marketing spend.
- Guides budget allocation based on profitable strategies.
- Provides a clear picture of marketing effectiveness.
Every dollar counts, and ROI tells you how many dollars your marketing strategy is actually bringing back.
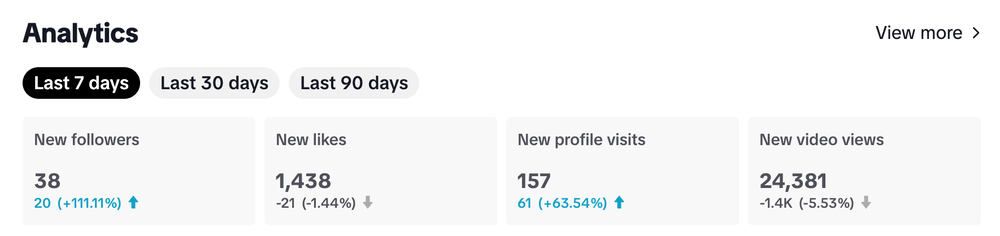
10 Engagement metrics
Engagement metrics tell the story of how interactive your audience is with your content.
But what exactly is it?
Engagement metrics include various indicators such as:
- likes
- shares
- comments
- page views
- time spent on page
- and more!
How to measure?
You can track these actions through analytics tools provided by social media platforms.
Higher engagement rates are often correlated with:
- Increased brand loyalty.
- Better conversion rates.
- More effective content strategy.
Engagement metrics are the applause for your brand performance. Are you hearing cheers or silence?
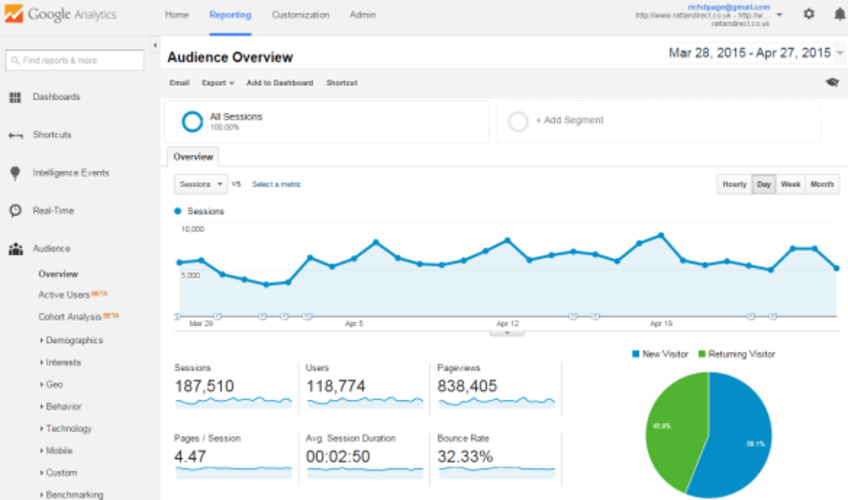
11 Website metrics
Website metrics include traffic volumes, bounce rates, average time on site, and conversions.
They help you understand how visitors interact with your site and where there may be room for improvement.
How to measure?
Tools like Google Analytics offer insights into these metrics. Tracking things like how long people stay, what they click on, and when they leave gives you actionable data to optimize user experience.
Why monitor these?
- Strong website metrics mean:
- Better user engagement and satisfaction.
- Improved SEO and higher search rankings.
- Higher conversion rates and better overall performance.
If your website was a garden. Would you grow flowers or just pull weeds?
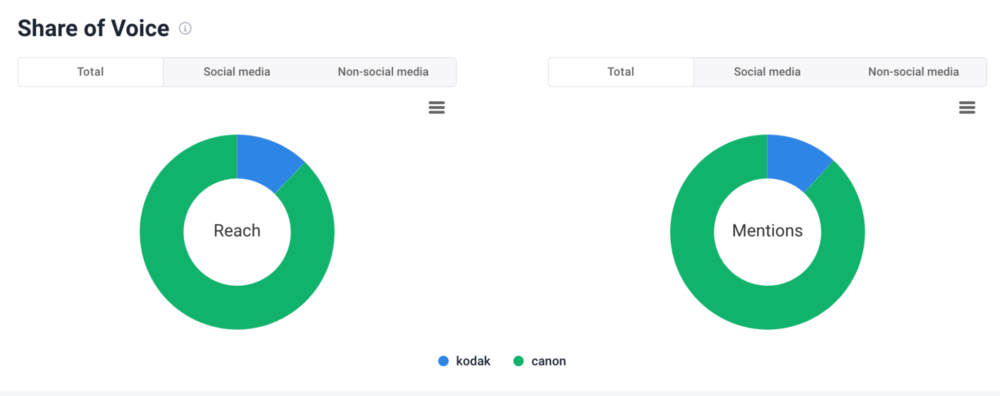
12 The Share of Voice
Share of Voice (SOV) measures how much of the conversation around a topic or industry you own compared to your competitors.
It calculates your brand’s visibility in advertising, social media, or other platforms relative to the total market activity. It’s a snapshot of your market presence and influence.
How to measure?
Measure your brand’s mentions, ad placements, or search engine rankings and compare them to the total in your industry.
For instance, if there are 1,000 mentions of products in your category and 300 are about your brand, your SOV is 30%.
Sounds complicated? Lucky you, there are tools that will count that for you 😉
And why does it matter?
SOV shows:
- Brand awareness and competitive positioning.
- Market influence and potential reach.
- Strategic insights into market trends and consumer preferences.
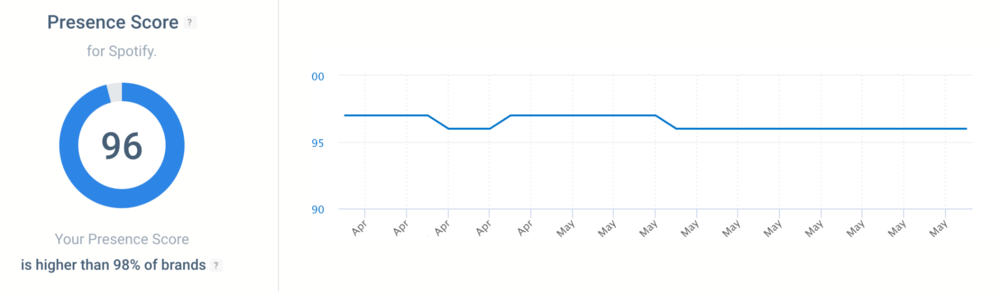
13 Presence Score
The Presence Score measures your brand’s online presence, taking into account how often and how broadly your brand is mentioned across the web.
It offers a concrete number that reflects your digital visibility and impact.
It’s the metric that Brand24 designed in order to make monitoring brand visibility much easier.
How to measure?
To get your Online Presence Score, you’ll need to track mentions of your brand across various online platforms using specific keywords related to your business or campaign.
This involves setting up monitoring projects that gather and analyze this data.
Go to Brand24 > Analytics and there you go.
Why keep track?
Keeping an eye on your Presence Score gives you a real-time snapshot of your brand’s health in the digital space. It’s crucial for:
- Comparing your market presence with that of your competitors.
- Evaluating the success of your marketing and PR efforts.
- Understanding how your online activities influence brand awareness.
- Pinpointing optimal times for launching campaigns based on peak interest levels
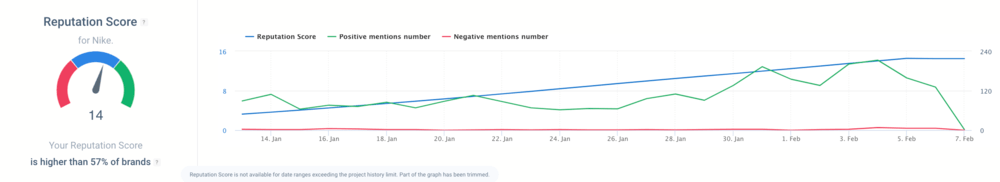
14 Reputation score
Think of your Online Reputation Score as your brand’s credit score in the marketplace. It reflects how trustworthy and credible your brand is perceived to be.
It is calculated based on customer reviews, social media feedback, and online ratings. It’s a holistic view of your brand’s reputation.
How to measure?
You can find your Reputation Score in Brand24 > Analysis.
15 AVE (Advertising Value Equivalency)
Advertising Value Equivalency (AVE) estimates the monetary value of earned media by comparing it to what the same exposure would cost if paid for as advertising.
How to measure?
Calculate the cost of equivalent ad space or time for the media coverage you received.
For example, if a magazine ad costs $5,000 and you receive a page of editorial coverage, your AVE is $5,000.
Why monitor AVE?
While its relevance is debated, AVE can:
Quantify the impact of PR efforts in familiar financial terms.
Help compare and contrast the effectiveness of paid vs. earned media.
Serve as one metric in a broader marketing performance evaluation.
AVE is like a translator for your PR efforts – turning media mentions into a language that stakeholders understand: dollars and cents.
Tip: Advanced tools can analyze metrics for you
Have you ever felt overwhelmed by the large amount of data you must process to gauge the effectiveness of your marketing campaigns?
You’re not the only one.
Navigating through analytics can sometimes feel like wandering through a maze of numbers… Wouldn’t it be wonderful to have a clearer path through it?
Here’s a tip: consider leveraging tools that incorporate AI technology. These tools can do the tedious analysis for you, saving you a ton of time for more important tasks!
After all, the goal is to make the data work for you, not vice versa!
Do you know the Metrics Analysis tab from Brand24?
It displays trends, sentiment analysis, and critical stats in an easy-to-understand dashboard. Here’s an overview based on Spotify’s example.
First, you receive a condensed summary packed with all the essential info about your marketing metrics:
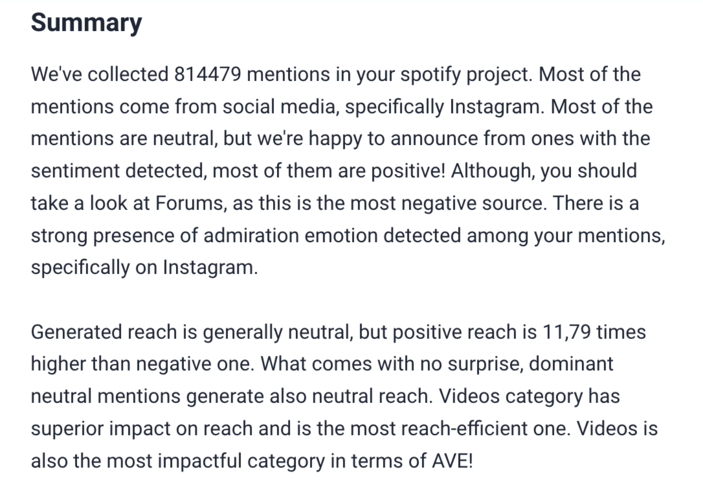
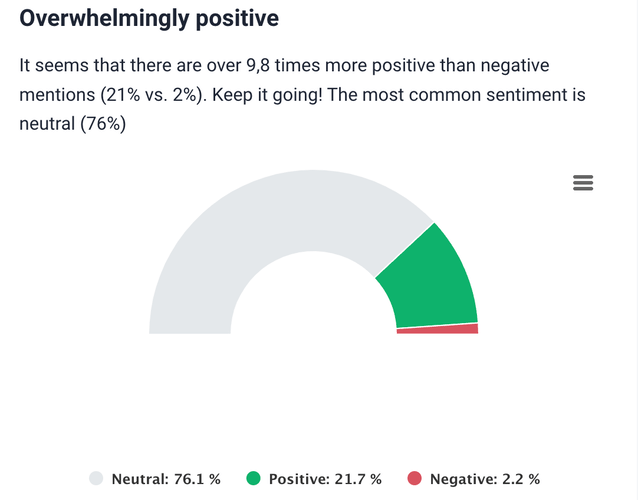
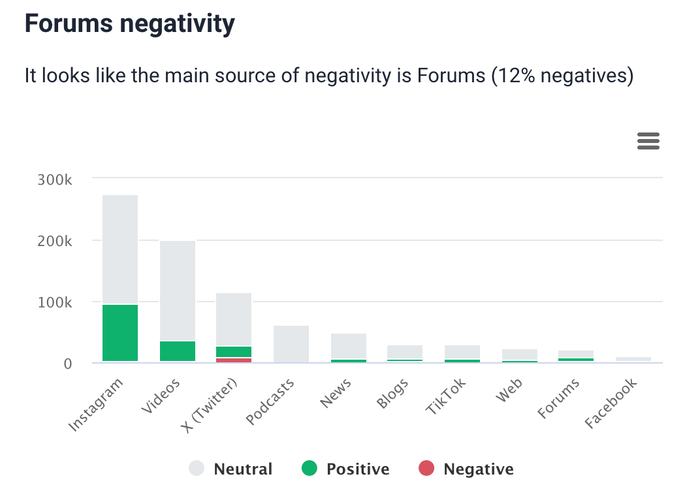
And also some more detailed analysis, like the sentiment breakdown:
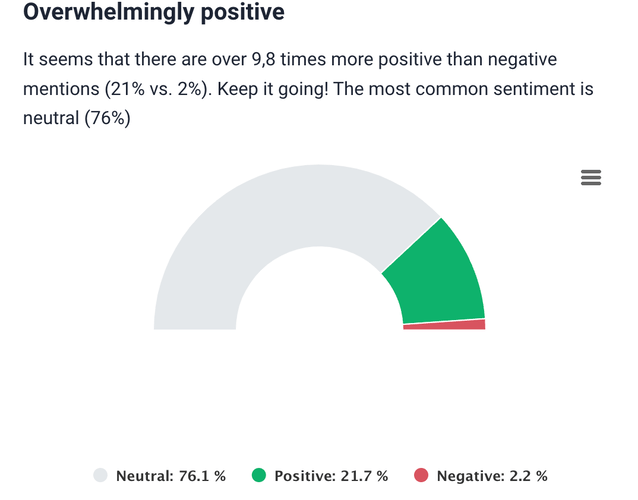
But does it really capture how people feel about my brand? Will I need to dig through the data to learn more?
Brand24 also offers a detailed emotions analysis:
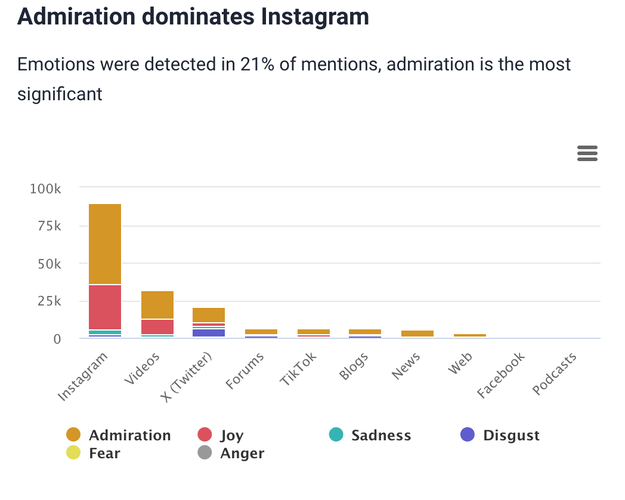
The tool segments the emotional responses associated with your brand, providing a clear picture of your audience’s feelings.
This feature is fantastic if you want to understand:
- Which channels are positively resonating with my audience?
- Where could I make improvements?
- Do people actually like my brand?
All fun and games, but what about optimizing marketing efforts?
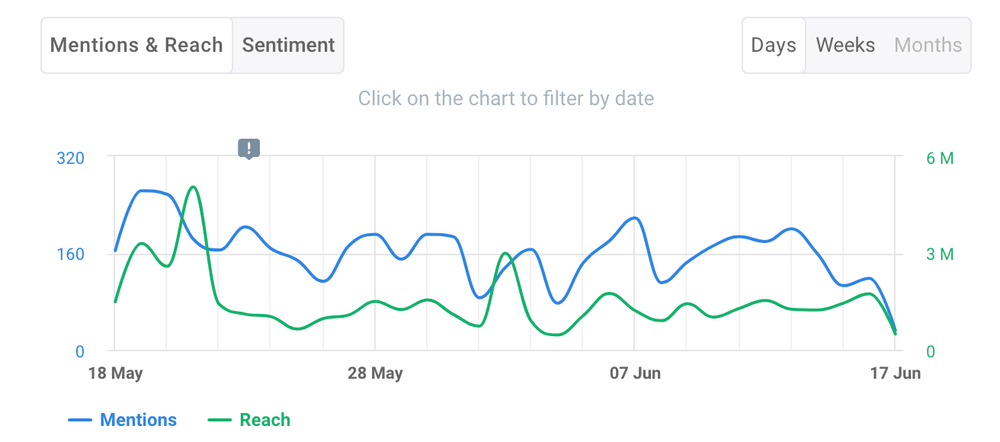
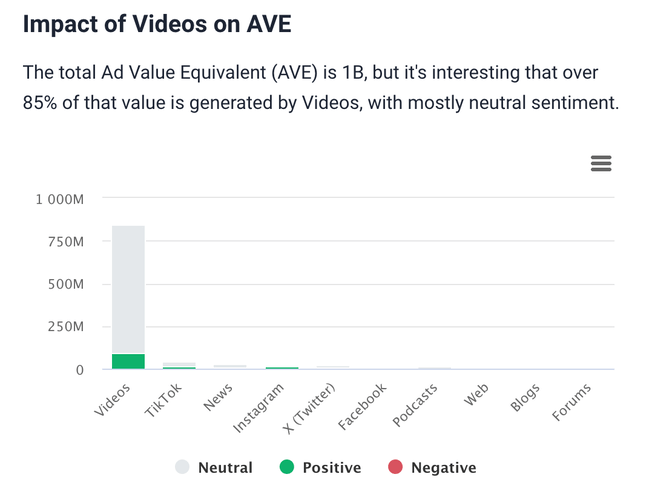
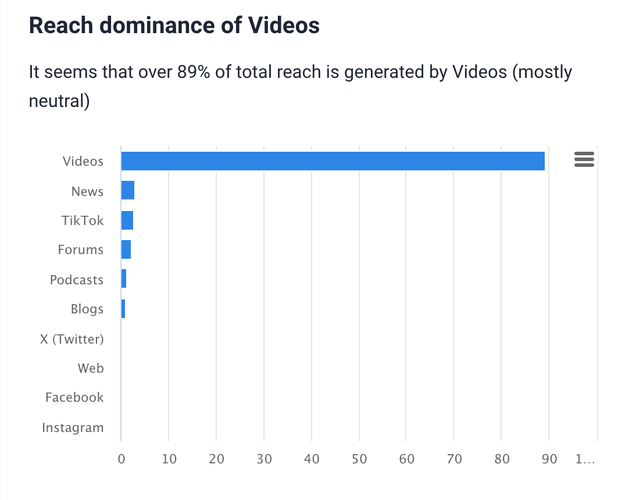
Brand24 helps you identify which marketing channels generate the most reach:
And which ones might need a bit more attention:
This knowledge allows you to optimize your marketing budget, focusing on channels that can increase your visibility.
As you saw in the analysis, for Spotify, videos (particularly on platforms like YouTube or TikTok) dominate in terms of reach and engagement.
Spotify can use this information to produce more video content that appeals to its target audience, ensuring its efforts are seen and impactful.
Conclusion
Monitoring digital marketing metrics can seem a Sisyphus work. But with the right tools, it’s very manageable and essential for growing your business.
Basic analytics might be enough for small businesses, but as your company grows and data gets more complicated, you’ll see the limits of simple methods.
That’s why I recommend using more advanced AI tools to help analyze data automatically. These tools save you time and make it easier to understand complex information.
Final thoughts:
- Don’t just collect data. Really look into it to understand what it says about customer habits, product performance, and market trends.
- Choose tools that make analyzing data easier, not harder. The right tools should help clarify things, not complicate them.
Are you ready to step up your marketing game? Start with Brand24 today and boost your brand success!

Article Reviewed by