Table of contents
Social Media Performance: How to Measure It in 2026
As of October 2025, over 6 billion people use social media—so your customers are already there. The key is not posting more, but posting smarter. The fastest way to do that is simple: track what brings results and repeat it. In this guide, you’ll learn which metrics to track to measure your social media performance, so you can see what works, fix what doesn’t, and grow faster.
And because metrics without context are just numbers, you’ll also learn what tools can help analyze organic social media performance—so you can measure what happens on-platform (reach, engagement, watch time) and off-platform (mentions, sentiment, share of voice) without guessing.
Key takeaways
-
What is social media performance?
Social media performance is how well your social presence helps you hit your marketing goals—through visibility, audience interaction, and real outcomes.
-
Start with clear KPIs
Decide what you’re optimizing for (awareness, traffic, growth, customer experience), then choose metrics that match—otherwise you’ll track numbers that don’t matter.
-
Track a simple core set.
Use reach/impressions to measure visibility, engagement/watch time to see if content resonates, and CTR/follower growth to check if it drives action.
-
Measure what people say about you, not just what you post.
Mentions and sentiment show brand reputation and can flag issues early; share of voice tells you how you stack up against competitors.
-
Turn tracking into a routine.
Review your metrics regularly, spot patterns, repeat what performs, and make one focused improvement each cycle.
What is social media performance?
Social media performance measures how well a brand’s online presence meets its marketing goals. It reflects how effectively a brand interacts with its audience, engages followers, and achieves its marketing objectives.
Key fact: Tracking social media performance can help you understand your audience’s perception and areas needing improvement. It provides invaluable insights to enhance social media marketing strategy.
What tools can help analyze organic social media performance?
Organic performance is tricky because it happens in two places at once:
- On-platform (reach, impressions, watch time, engagement)
- Off-platform (people talking about you elsewhere, sentiment, competitor buzz)
Here’s the tool stack that covers both—without turning your workflow into a spreadsheet marathon:
1) Native platform analytics
Use these to measure reach, impressions, engagement rate, follower growth, watch time, and CTR inside each channel:
- Instagram Insights
- TikTok Analytics
- YouTube Studio
- LinkedIn Analytics
- X (Twitter) Analytics / Analytics tools in-app
Best for: post-level performance, audience basics, video retention, timing tests
Limitation: each platform is a silo (and you usually can’t see the full “brand conversation” outside that app)
2) Social listening / media monitoring tools
These tools track mentions volume, sentiment, reach beyond your own profiles, and often share of voice across social + non-social sources.
Best for: brand mentions, sentiment shifts, PR risks, “what people actually say”, trend detection
Limitation: not designed to replace native post-level analytics (it complements it)
3) Link tracking + attribution tools
Organic social still drives clicks—just not always in obvious ways.
Use:
- UTM tags + GA4 (or your analytics platform)
- Link shorteners / click trackers (optional)
- Landing-page-specific tracking (optional)
Best for: CTR validation, traffic quality, conversion follow-through
Limitation: social can influence conversions even when last-click attribution doesn’t give it credit (so pair this with listening + engagement data)
Quick rule for choosing tools (so you don’t overbuy)
- If you mainly care about post performance → start with native analytics
- If you mainly care about brand conversations + sentiment + PR → add social listening
- If your KPI includes traffic/revenue → you need UTMs + analytics
How to measure social media performance?
Your first step in measuring the effectiveness of your social media strategies is to set up your goals (social media KPIs).
Ask yourself:
- Do you want more website traffic?
- How about the follower growth?
- Or perhaps increase brand awareness?
- How about spreading the word about your brand?
- Do you want more satisfied customers?
- Would you like to get some feedback and improve your customer journey?
To effectively measure social media performance, setting clear goals is crucial.
Key fact: Your social media marketing KPIs will impact the way you measure your social media performance.
You should consider tracking social media metrics from the categories below:
- awareness metrics
- customer service metrics
- social metrics
- engagement metrics
You can find more examples of key social media metrics below.
But these are just for inspirational purposes. Make sure to adjust your list according to your established KPIs.
01 Social Media Reach
Social media reach represents the total number of unique users who have seen your content. It’s a crucial metric that shows your potential audience size.
By measuring reach, you can identify which platforms, content, or campaigns generate the most visibility and tailor your efforts to maximize your brand’s exposure.
But it’s not just it!
Thanks to measuring social media and non-social media reach, you will find out:
- Which social channels effectively bring awareness and enhance brand visibility?
- Which types of content resonate most with your target audience and boost engagement?
- The seasonal patterns or trends crucial for brand visibility.
- Your audience demographics so you can tailor your content better.
- The effectiveness of social media campaigns.
- Reach competitive analysis (and use this knowledge for better market positioning).
- Any changes in reach (to identify and respond to potential PR crises early).
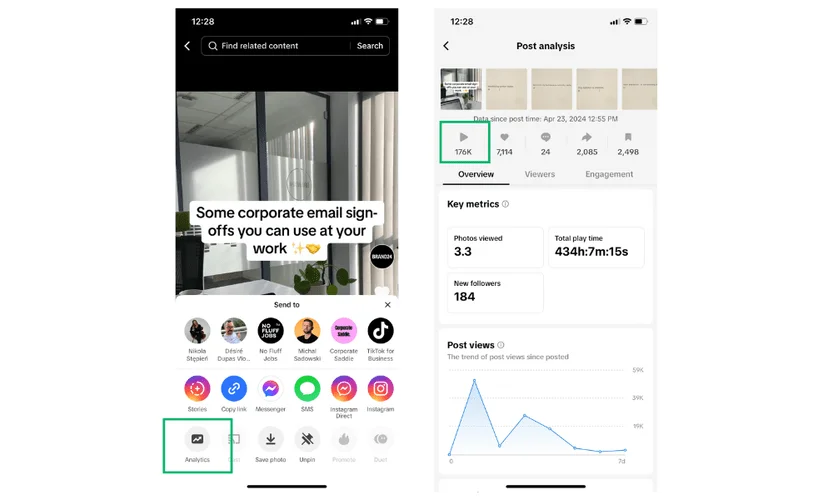
Measuring social media reach can usually be done internally in the apps.
You need to know that TikTok, Instagram, X (Twitter), and other most popular social media platforms provide each post’s reach data in their internal analysis.
And it’s pretty easy to access this data!
Just go to the specific social media post > analytics.
This is what it looks like on Instagram:
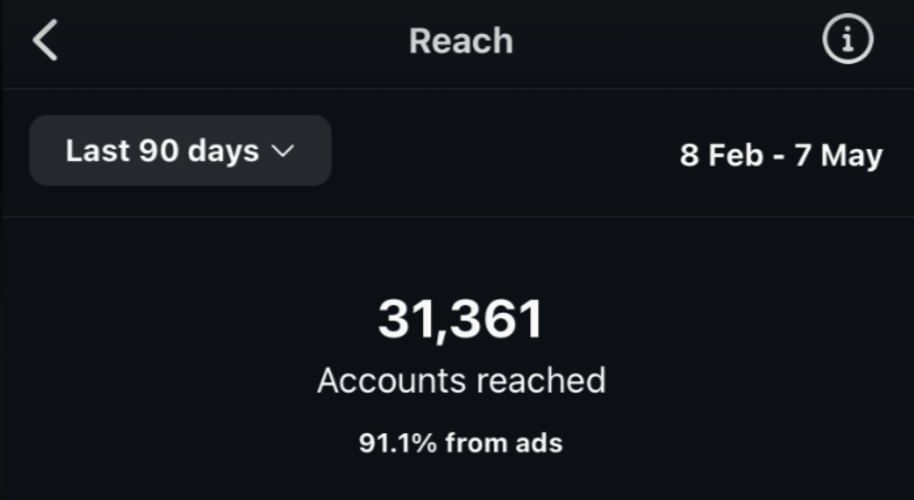
However, social media reach is just the tip of the iceberg.
Important: If you want to make reach metrics matter, you must get the full picture of how your message speeds online.
And it gets more complicated to measure it for non-social reach.
You’ll need advanced media monitoring tools to do that accurately.
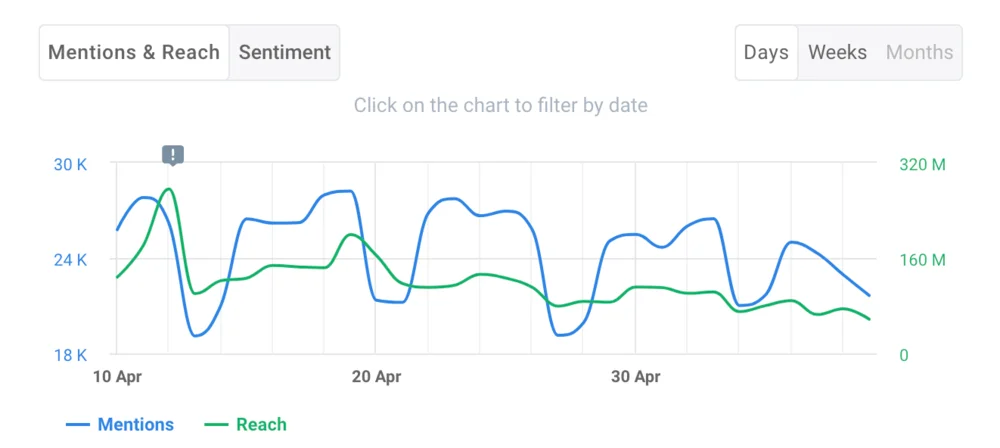
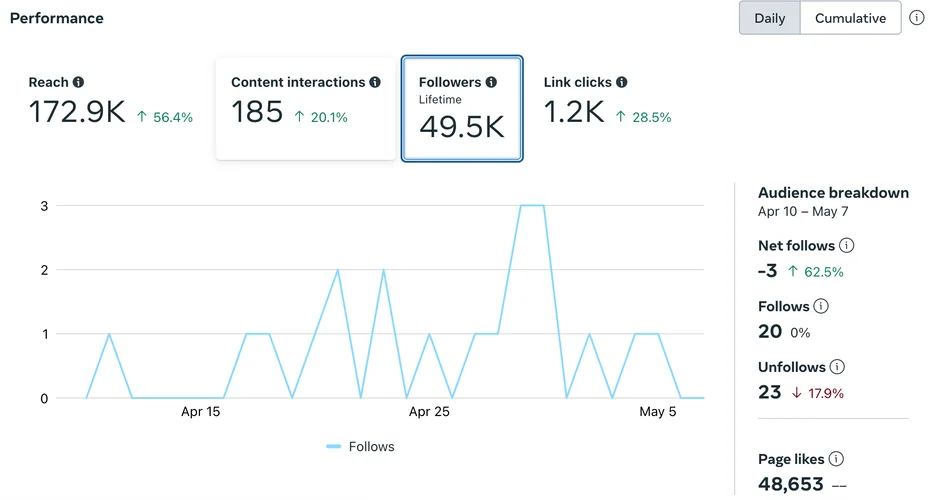
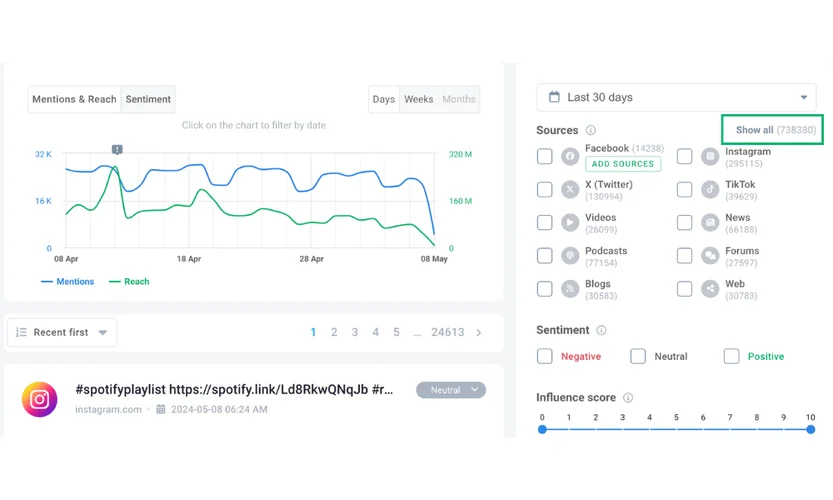
Brand24 can monitor social media (Instagram, LinkedIn, X, Tikok, YouTube) and non-social (from news, forums, blogs, and podcasts) reach and present this data in a simple way.
I asked the tool for data about Spotify, and this is a general overview of its reach:
I can also manually filter the results and get the analysis of a specific source.
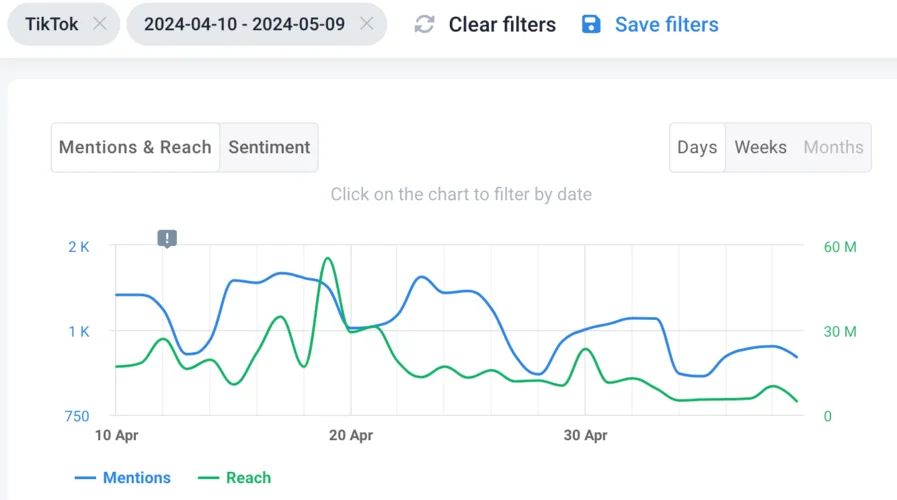
It’s a useful feature for getting details, but if you want to understand the reach in general, go for the AI functions.
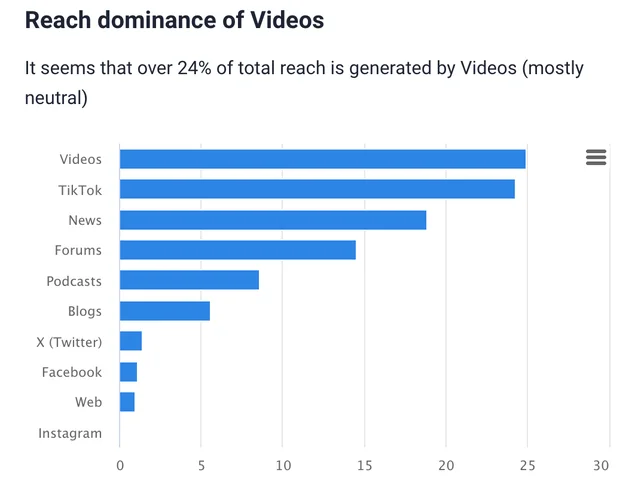
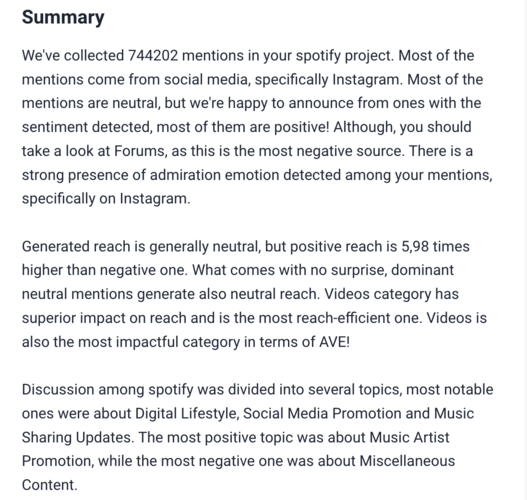
I went to the “Metrics Analysis” tab and received amazing social media insights!
With just one click, I have the most reach efficient source and an amazing project summary:
02 Impressions
Impressions count the total number of times your content has been seen. This metric is important because it gives you a sense of how attractive your content is.
High impressions lead to increased brand awareness and indicate engagement potential.
You can find stats related to your impressions in the social media analytics tools tab.
The difference between reach and impressions can be tricky.
But here’s an example:
I loved TikTok and rewatched it 4 times.
This means that my views will count as four impressions… But I’m the only one who created those four views, so I will still be just one person reached.
Note: It’s important to track both to improve your brand’s popularity and image.
02 Engagement Rate
Engagement rate shows how well your audience interacts with your content through likes, shares, comments, and clicks.
Note: A high engagement rate suggests that your audience finds your content valuable. It indicates loyalty and trust.
It is crucial because it reflects directly how effectively your content resonates with your audience.
To measure the average engagement rate use this formula:
[total engagement (every like, share, and comment) ÷ by total views] x100
03 Followers Growth
This metric tracks how many new followers you gain over a given period. It’s a good indicator of how your online community is growing!
A growing follower count indicates increasing interest in your brand, which can directly result from successful marketing strategies.
You can find data about your audience’s growth rate using the app analytics tools.
Just go to your profile and look for the “analytics” or “insights” tab.
This is what it looks like for the most popular social media channels:
- Instagram:
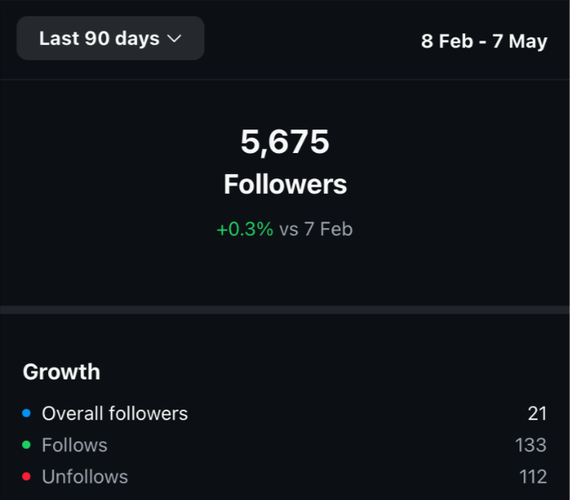
- LinkedIn:
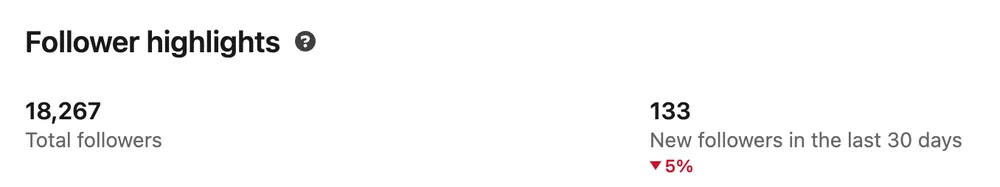
- Facebook:
04 The volume of mentions
The volume of mentions is a key social media metric that tracks how often your brand is talked about online.
Short answer: it measures how frequently people mention a specific keyword (your brand name, hashtag, campaign slogan) across the web.
This metric is essential for understanding your social media performance analytics.
Thanks to tracking mentions, you will find out:
- Which social media platform is generating the most mentions of your brand?
- What topics or content types get your audience to discuss your brand?
- Opportunities to enhance your SEO through potential influencer collaborations.
Using a specialized media monitoring tool is the most effective way to keep tabs on brand mentions.
Social listening tools track the volume of mentions and, thanks to AI technology, provide you with a ready-to-use analysis.
You can access information about:
- Which platforms are driving most of the conversations?
- What emotions do they associate with it?
- Which source generates most of the negativity?
To summarize, this information shows where the brand’s engagement strategies are most effective and can help guide future social media marketing efforts.
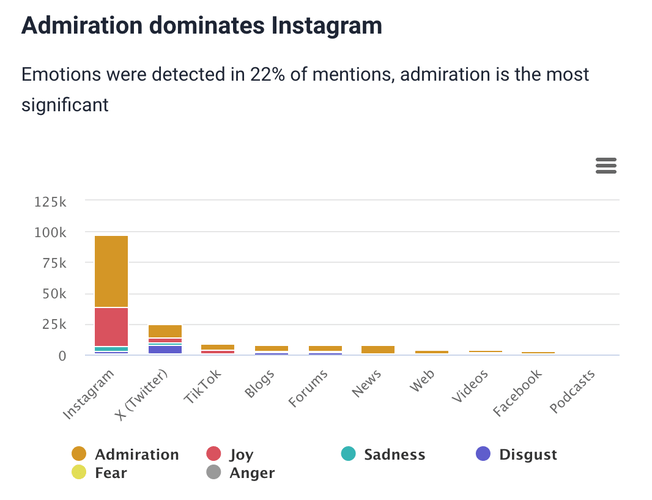
For example, for Spotify, Instagram generates the most conversations.
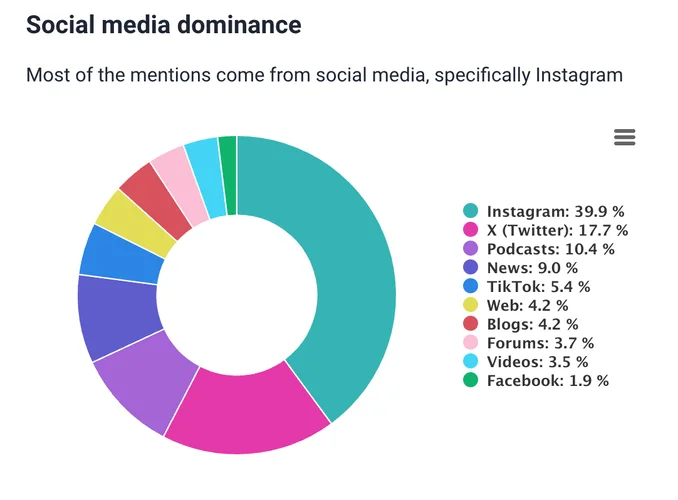
And it is also the source of most of the positive emotions:
Another important feature is the negativity detection. For Spotify, the main source of negativity is Forums.
Perhaps it’s time to do a special campaign there?
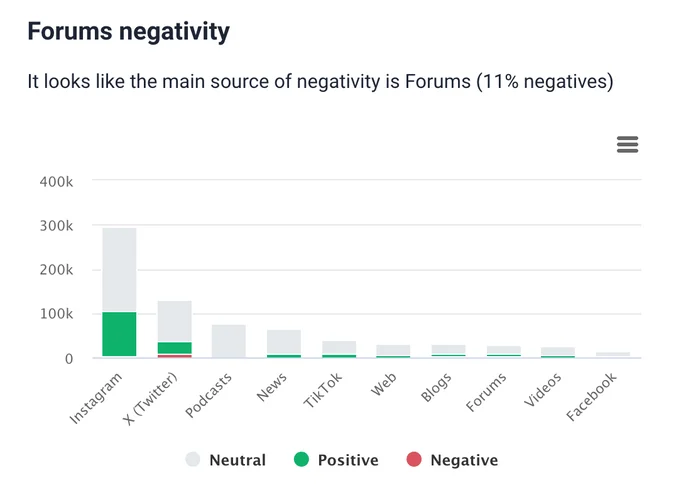
And this is an overall look at the Spotify’s mentions:
03 Share of voice
Share of voice compares your brand’s market visibility to your competitors.
Important: A higher SOV can indicate a stronger market presence and influence.
Share of Voice (SOV) is an essential social media tool. It shows how much your brand stands out compared to your competitors, helping you understand your position in the market.
Brands don’t operate alone, so it’s important to know how visible you are compared to others. Share of Voice (SOV) helps you:
- see how your brand measures up against competitors
- evaluate how effective your social media strategy is
- compare your marketing results with others in your market
Thanks to measuring the share of voice, you will find out:
- How well your social media campaigns perform.
- Which social media channels boost your brand, and which ones need more work?
- What tactics are working for your competitors and might work for you, too?
Key fact: Using AI-powered tools like Brand24, you can quickly get an idea of how often your brand is mentioned.
As we keep talking about Spotify – let’s stick to it.
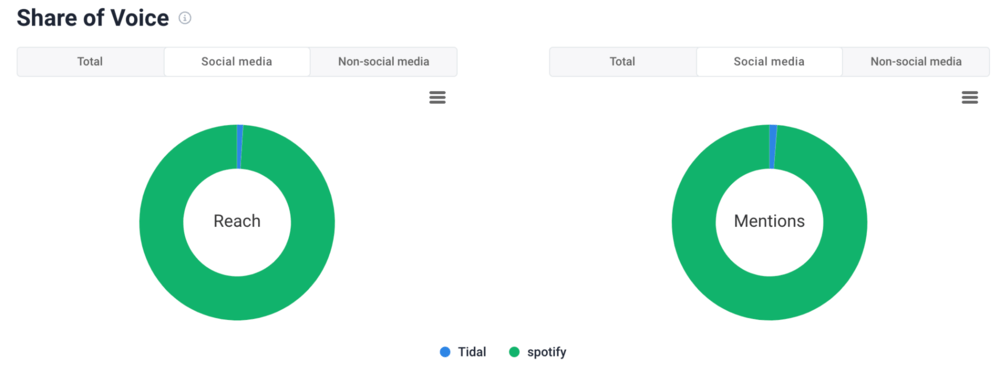
I’d like to compare how their SOV looks compared to one of their most important competitors – Tidal.
I go to Brand24 > “Comparison” and select the projects to compare.
This is what I got:
- Spotify clearly leads with a wider reach on social media. It means their content and social media campaign hits a broader audience.
- When it comes to social mentions, Spotify also maintains a higher volume compared to Tidal. This indicates that people talk about Spotify more frequently.
These insights reveal that Spotify’s social media efforts are more effective, giving it a stronger presence and influence in the market than Tidal.
For anyone keen on boosting their social media marketing, observing these metrics can highlight which channels are working well and what competitive tactics you could potentially use.
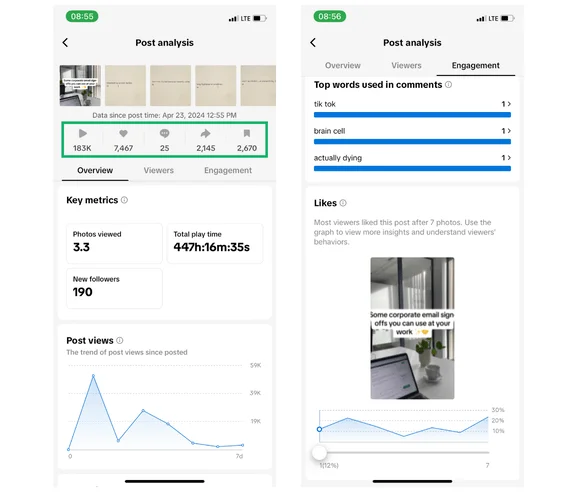
05 Video Engagement Rate & Watch Time
Would you rather look for product reviews in the form of an article or video?
Key fact: 75% of people prefer video over text for learning about products or services.
Short video engagement tracks how much people interact with your videos via TikTok, Instagram Reels, or YouTube Shorts. This includes views, likes, comments, and shares.
Why focus on short video engagement?
- 1 Engaging videos are shared more, helping your content reach more people.
- 2 Videos with high engagement help more people notice your brand.
- 3 Interesting videos make viewers want to engage more with your content, like visiting your website or asking about your products.
It’s important to monitor how your short videos are doing. Pay attention to:
- Watch time: How long do people watch your videos?
- Interaction rates: How many viewers like, comment, or share your videos.
- Video completion rate: How many people watch the whole video?
- Click-through rates: How many viewers visit your website or follow your call to action after watching.
Understanding these details helps you make better videos that people want to watch and interact with, boosting your social media results.
07 Click-Through Rate (CTR)
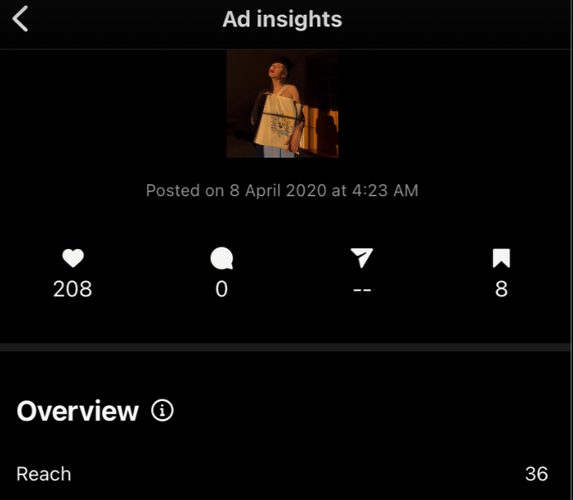
Click-through rate (CTR) measures how often people click on a link in your post compared to how often it’s seen. A high CTR means that your content is noticed and prompts action. This indicates driving traffic to your site or conversions.
When the pandemic started, I decided to be more creative and sell totes with my art.
I even ran an Instagram account for this small business and did several mini social media campaigns.
It was more about the fun and less about the profit… but I think it perfectly illustrates the CTR.
One of my posts reached 36 people, and 15 of them clicked on the link to buy. This gave me a CTR of around 40% (15 clicks / 36 views x 100).
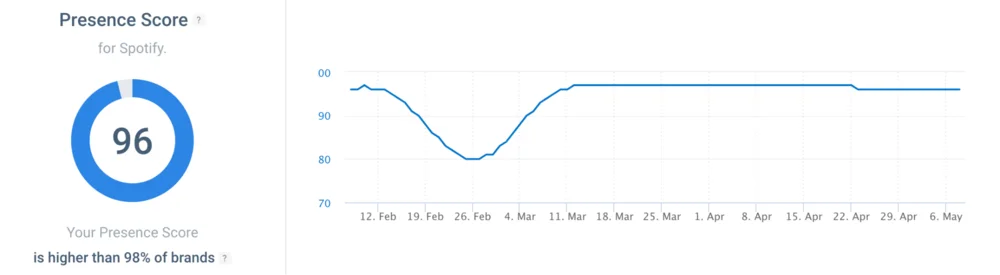
08 Presence Score
Online Presence Score is an overall rating of how visible your brand is online. A higher Presence Score means you’re more noticeable in the digital crowd.
Thanks to measuring Presence Score, you will find out:
- Whether your brand awareness is increasing or decreasing
- The significant impact of events on your brand’s popularity
- Whether it’s time to reassess your PR strategy
Below, you can find Spotify’s Presence Score and how it has changed over the last three months.
As you can see from the chart below, Spotify usually has a very high Presence Score of 96.
It shows that it’s very popular online.
But there was a drop in the score around late February before it went back up.
If I were in charge of Spotify’s social media, I would look into what caused that drop and consider adjusting the social media strategy to keep Spotify’s popularity from falling again.
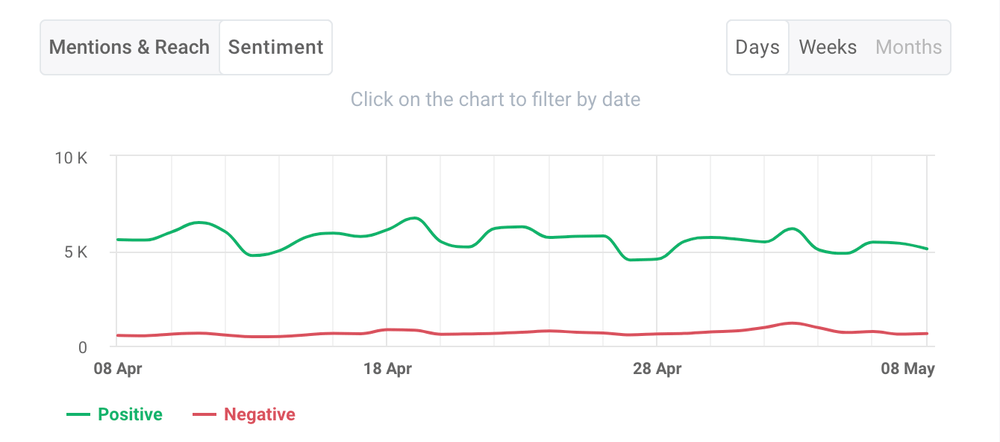
09 Sentiment
Sentiment analysis lets you see how people feel about your brand based on what they say online—positive, negative, or neutral. It helps you spot rising frustration early, understand what’s driving praise or complaints, and react faster with the right message or support.
Key fact: By understanding the sentiment behind the conversation, you can quickly spot potential PR crisis, calm down upset customers, and see which of your marketing efforts are hitting the mark.
This is an invaluable tool for boosting your social media performance!
With sentiment monitoring, you can:
- see which platforms bring the most positive reactions and where sentiment is slipping
- understand how people respond to your campaigns—what they love and what frustrates them
- catch early warning signs of a PR issue and adjust your strategy before it escalates
How to track the sentiment of your brand? Short answer: with an advanced social listening tool.
Brand24 lets you see how people feel about your brand in real time.
Plus, you can use different filters to:
- Find out the sentiment in posts on specific social media platforms.
- Browse only positive or negative mentions.
- Check how the sentiment changed over a specific period of time.
Tip: Benchmark the social media performance
Think about running a race without knowing the time or seeing the other runners. How would you know if you’re ahead or need to speed up?
That’s why I recommend regularly benchmarking your social media performance. It’s like finding a reference point.
Why should I benchmark my social media performance? Here’s a list of benefits:
- Track how far you’ve come and where you must go to hit your goals.
- Discover what strategies work for your competitors, and consider how to use similar approaches.
- Focus your time and budget on what truly works, reducing wasted effort.
- Keep up with the pace of your industry and ensure you’re not falling behind.
How to compare social media performance of brands?
You can use the Comparison tab by Brand24. It quickly analyzes your key metrics and gives you a chart like the one below:
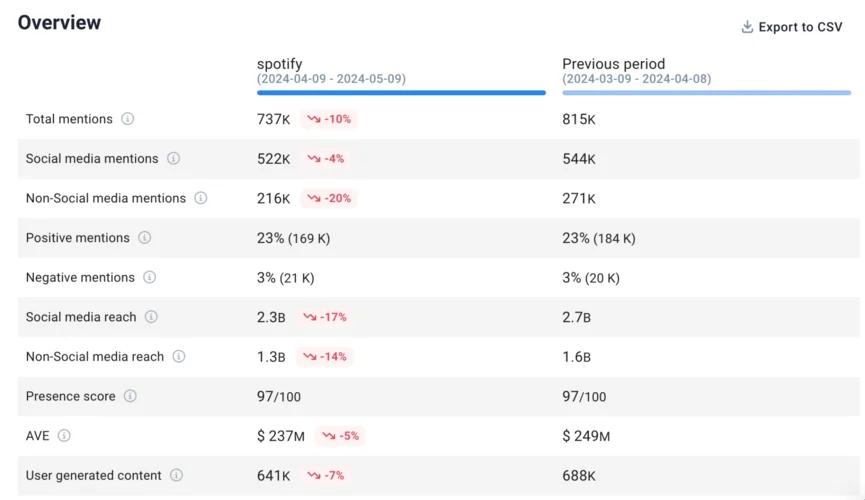
As you can see, Spotify’s performance has slipped since the last period.
While the brand is still doing quite well overall, there’s a clear drop in how often people mention and reach out to it.
I suggest that Spotify should really think about a new campaign to raise brand awareness and maintain a positive image.
By boosting its visibility and engagement now, Spotify can get back on track and keep its impressive performance going.
Conclusion
Knowing whether your marketing efforts are successful or falling short is nearly impossible without social media monitoring. Analyzing and adjusting your strategy based on the right metrics is key.
In the digital age, data is king.
If you want to turn all mentioned metrics into action, use this simple checklist—review them on a set schedule and make one small improvement each time.
| What to check | Where | How often | What to do next |
|---|---|---|---|
| Reach + Impressions | Native analytics / Brand24 | Weekly | Find your top 3 posts by reach → repeat the topic + format next week |
| Engagement rate | Native analytics | Weekly | If low: sharpen the hook + CTA. If high: turn it into a series |
| Follower growth | Native analytics | Weekly | Spot what drove spikes (post/day/topic) → repeat the cadence |
| Mentions volume | Brand24 | Weekly | If mentions rise: join the conversation + amplify UGC. If drop: publish a “conversation starter” post |
| Share of voice | Brand24 | Monthly | If competitor spikes: review what they pushed → test one similar angle |
| Video watch time + completion | TikTok/Reels/Shorts analytics | Weekly | If people drop early: cut the intro, start with the payoff, shorten the video |
| CTR | Link tracking/UTMs + platform | Weekly | If CTR is low: rewrite CTA + test 2 creatives + adjust link placement |
| Presence Score | Brand24 | Weekly | If it dips: check what happened that day → adjust content and comms |
| Sentiment | Brand24 | Weekly | If negative rises: respond fast, address the root issue, publish help/clarification content |
Want to maintain a strong, positive brand presence? Start with a Brand24 trial.
FAQ
01 How to measure social media marketing performance?
Measure social media marketing performance by linking your content to a clear goal, then tracking the few metrics that prove progress.
Start with one question: what should social media do for you right now?
- Awareness goal: Reach, impressions, video watch time, share of voice
- Community/engagement goal: Engagement rate, saves, shares, comments, follower growth
- Traffic goal: CTR, link clicks, landing page sessions, bounce rate/time on page
- Brand health goal: Mentions volume, sentiment, presence score, topic/emotion shifts
- Competitive goal: Share of voice, reach vs competitors, sentiment vs competitors
Then set a rhythm: check weekly, learn one thing, change one thing. Social media performance isn’t about “perfect reporting.” It’s about tight feedback loops.
02 How to track social media performance?
Track it in two layers, because organic performance happens in two places:
Layer 1: On-platform performance (what happens inside the app)
Use native analytics to track:
- reach + impressions
- engagement rate
- follower growth
- watch time + completion rate (especially for short video)
- CTR (if the platform supports it)
Layer 2: Off-platform performance (what happens around your brand online)
Use a social listening tool to track:
- mentions volume
- sentiment and emotion
- share of voice
- PR spikes / negativity triggers
- “where the conversation is happening” (source + context)
That’s how you stop guessing. Native analytics tells you what your content did. Listening tells you what your brand triggered.
03 What are key performance indicators for social media?
The best KPIs are the ones you can actually improve with a content decision.
A solid KPI set usually includes:
- 1 visibility KPI: reach or impressions
- 1 interaction KPI: engagement rate (or saves/shares for IG/TikTok)
- 1 growth KPI: follower growth rate
- 1 impact KPI: CTR / website sessions / conversions (if traffic matters)
- 1 brand health KPI: sentiment or mentions volume
- 1 competitive KPI: share of voice
If you track 20 KPIs, you’ll feel productive and change nothing.
If you track 5–7 KPIs, you’ll see patterns and move faster.
04 How to analyze social media performance?
Analyze performance by turning metrics into decisions.
Use this simple method:
Step 1: Pick one time frame (weekly works best).
Social moves fast. Monthly is fine for strategy, but weekly is where improvement happens.
Step 2: Find winners (not “best posts,” but repeatable patterns).
Look for:
- posts with unusually high reach
- posts with unusually high engagement rate
- videos with unusually high watch time or completion
- posts that triggered a spike in mentions
Step 3: Ask “what caused it?” (context > numbers).
Was it:
- the topic?
- the hook?
- the format?
- the timing?
- the creator angle (UGC vs brand voice)?
- a trend or external event?
Step 4: Repeat the pattern once, then test one variable.
Same topic, new hook. Same format, new CTA. Same style, shorter video.
That’s how you improve without reinventing your strategy every week.
05 What’s the difference between reach and impressions?
Think of it like a room vs footsteps.
- Reach = how many unique people saw your content.
- Impressions = how many total times it was shown (including repeats).
If one person sees your post 5 times:
- reach = 1
- impressions = 5
Why it matters:
- High reach = you’re expanding visibility
- High impressions with low reach = you’re showing up repeatedly to the same group (good for reinforcement, not great for growth)
Track both because together they tell you whether you’re growing the audience or hammering the same one.
06 Which social media metrics matter most for my goal (awareness vs traffic vs sales)?
Metrics only matter in context — otherwise it’s just a scoreboard.
Use this cheat sheet:
If your goal is awareness:
Reach, impressions, video views, watch time, share of voice, presence score
If your goal is engagement/community:
Engagement rate, comments, shares, saves, DMs, follower growth
If your goal is traffic:
CTR, link clicks, landing page sessions, scroll depth/time on page
If your goal is leads/sales:
Conversions, assisted conversions, cost per lead (if paid supports organic), CRM/source data + UTMs
If your goal is brand health / PR risk:
Mentions volume, sentiment, negative spikes by source, topic triggers
Pick the smallest set that proves progress — then optimize content around it.
07 How often should I track social media performance metrics?
Weekly is the sweet spot.
- Weekly: reach, impressions, engagement rate, follower growth, watch time, CTR, mentions volume, sentiment
- Monthly: share of voice, competitive benchmarks, “what content themes win,” channel strategy decisions
- After every campaign: compare against baseline (before vs during vs after)
The point isn’t to track constantly — it’s to track consistently. The best teams win because they don’t “randomly post.” They run small experiments and learn fast.
08 How do I benchmark social media performance against competitors?
Benchmarking is how you avoid two classic mistakes:
- thinking you’re doing great because numbers go up (while competitors grow faster)
- thinking you’re failing (when the whole market is down)
Here’s what to compare:
Visibility (market presence):
- share of voice
- total mentions
- reach (where possible)
- presence score / visibility index (if your tool supports it)
Conversation quality:
- sentiment vs competitors
- what topics drive positive/negative buzz
- which channels are fueling conversation (TikTok vs forums vs news, etc.)
Momentum over time:
- who’s trending up this month?
- what content or event likely caused their spike?
Then do the useful part: steal the lesson, not the format.
If a competitor spikes because of an influencer collab, don’t copy the post — test the tactic in your own voice.
09 How can I measure organic social media ROI (traffic, leads, conversions)?
Organic ROI is real — it’s just not always “last click.”
To measure it without lying to yourself, use three layers:
Layer 1: Direct response (easy wins)
- UTMs on links
- GA4 sessions + conversions from social
- landing page conversion rate
Layer 2: Assisted impact (the hidden value)
Social often influences decisions but doesn’t get credit. Look for:
- assisted conversions in analytics
- branded search lift (more people Googling you)
- spikes in direct traffic after viral posts or campaigns
Layer 3: Brand value (the long game)
- sentiment trend over time
- share of voice growth
- mentions volume + quality (who is talking? where?)
If you combine native engagement + traffic tracking + social listening, you get the full story:
- what performed,
- what it drove,
- and what it changed in how people talk about your brand.
That’s ROI you can actually act on.

Article Reviewed by