Table of contents
How to Create a YouTube Analytics Report? Template + Guide
Creating a YouTube analytics report often takes more time than you planned. Collecting data, analyzing it, and presenting it in a clear and concise format – this process can quickly become overwhelming. But here’s the good news: AI reporting tools can handle it for you.
A YouTube analytics report provides an overview of your channel’s, videos, and brand’s performance on YouTube. Depending on the report’s purpose, it will present different metrics, such as watch time, subscriber growth, or the number of mentions and their reach.
Presenting YouTube data in the form of a report gives you the most critical insights to make informed decisions.
Ready to learn how to effortlessly create a YouTube analytics report with the help of AI?
Let’s go!
What is a YouTube analytics report?
A YouTube analytics report is a document that gives you a comprehensive look at the performance of your YouTube channel, specific videos, or, more broadly, your brand presence on this platform.
It includes key metrics and insights that help you see what’s working and what’s not during a specific period and how to improve.
It’s a helpful tool for making better decisions to grow effectively on YouTube.
You can generate it through YouTube Studio or use external marketing reporting tools like Google Analytics or Brand24.
A YouTube report is for anyone who wants to understand and improve their YouTube performance. For example, it’s handy for:
Video content creators
Marketing teams
Agencies
Businesses
Start using analytics today and create your first YouTube report!
YouTube analytics report template
Let’s be honest – using templates is the quickest and easiest way to create a great report!
Starting today, you won’t have to struggle with it!
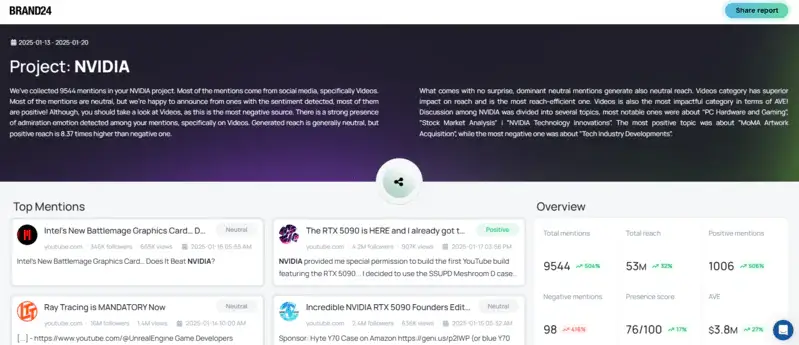
Brand24 is an AI media monitoring tool that generates shareable YouTube analytics reports.
It performs analysis based on YouTube mentions.
But it’s worth noting that it also monitors other social media platforms and various websites, including news sites, forums, and blogs.
The reports above are just examples made with Brand24. But you can create similar ones or a custom report specifically for YouTube.
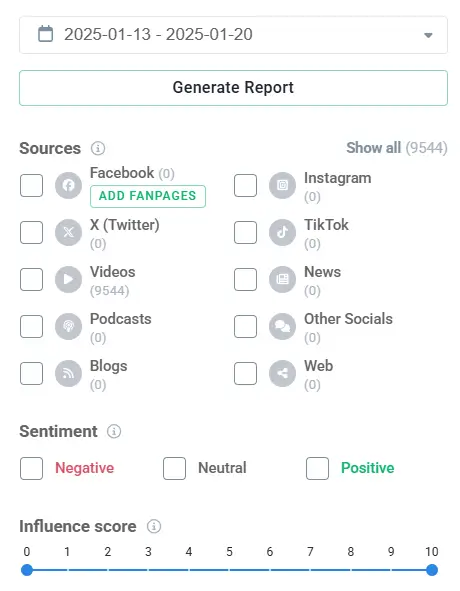
All you need to do is:
Set up a project with your brand name 💻
Type youtube.com in the domain section ⌨️
Choose the reporting period 📅
Click “Generate Report” ✅
Want to create this kind of report for your brand? Try Brand24!
Here are some questions Brand24’s YouTube analytics reports can answer:
How many times was [name of the brand] mentioned on YouTube?
How many people did [name of the brand]-related YouTube content reach?
What is the sentiment of [name of the brand] on YouTube?
How does the sentiment of [name of the brand] on YouTube compare to other platforms?
What is the AVE of YouTube videos mentioning [name of the brand]?
What are the key topics of discussion related to [name of the brand]?
Which YouTubers have the highest reach when mentioning [name of the brand]?
What are the most common keywords and hashtags in [name of the brand]-related video content?
What are the peak days for [name of the brand] mentions and reach on YouTube?
What is the geolocation of the audience reached by [name of the brand]-related YouTube content?
Create a professional YouTube report in minutes!
How to create a YouTube analytics report? 7 steps
You’ve just got perfect YouTube analytics report templates, but wait…
There are a few important things you should keep in mind:
01 Choose your goals
First and foremost, you need to determine the purpose of your YouTube report and for whom you are creating it. Ask yourself:
What is the main goal of your report?
Are you analyzing the performance of a recent YouTube campaign or evaluating how another campaign impacted YouTube users? Or maybe you are just tracking channel growth?
Who is the report for?
Is it for your marketing team, C-level management, or a client? This determines how detailed the report needs to be and which insights to focus on – client reports will look quite different from the ones you created for a CEO.
You’re probably wondering what the goal of a YouTube analytics report might be; here are the most common ones:
Measuring YouTube channel performance
Measuring brand performance on YouTube
Understanding audience behavior
Tracking YouTube campaign
Optimizing posting schedules
Comparing performance with competitors
Monitoring brand reputation on YouTube
02 Choose key metrics
If you have already established the goal of your report, you can choose the metrics you will include in it based on that.
Here are the key YouTube metrics you should include in your report:
Watch time
The volume of mentions
Average view duration
Engagement metrics (views, likes, dislikes, and subscriptions)
Reach
Audience retention metrics
CTR (Click-Through Rate)
- Online presence score
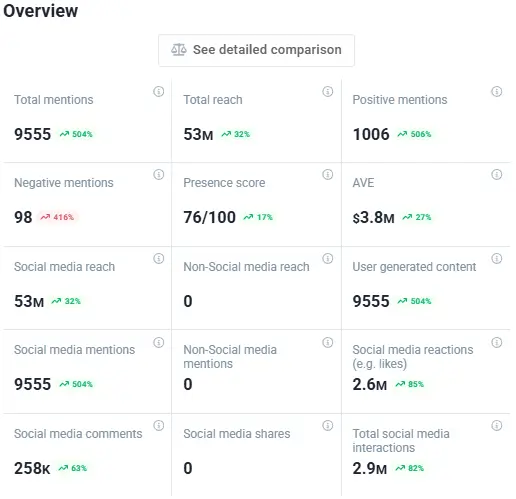
Below, I’ve matched the specific most important metrics to the most common YouTube analytics report goals (I listed them in the previous step):
Measuring YouTube channel performance 👉 key metrics: views, watch time, YouTube subscriber growth
Understanding audience behavior 👉 key metrics: audience retention, demographics, engagement (likes, dislikes, comments)
Tracking YouTube campaign 👉 key metrics: volume of mentions, reach, engagement, CTR
Optimizing posting schedules 👉 key metrics: watch time, user behavior patterns based on the volume of mentions, its reach, and engagement
Comparing performance with competitors 👉 key metrics: share of voice, the volume of mentions
Monitoring reputation on YouTube 👉 key metrics: sentiment, the volume of mentions
Get started with YouTube analytics and create your report now!
03 Remember about data visualizations
Every report should include data visualizations. Without them, the report might feel overwhelming or hard to follow.
Visualizations (charts, graphs, diagrams, word clouds, tables, heatmaps, etc.) help represent complex data in a way that’s easy to understand.
Imagine this: you’re trying to figure out when NVIDIA is most mentioned on YouTube.
Would you rather scroll through a long list of numbers or look at a heatmap highlighting this data?
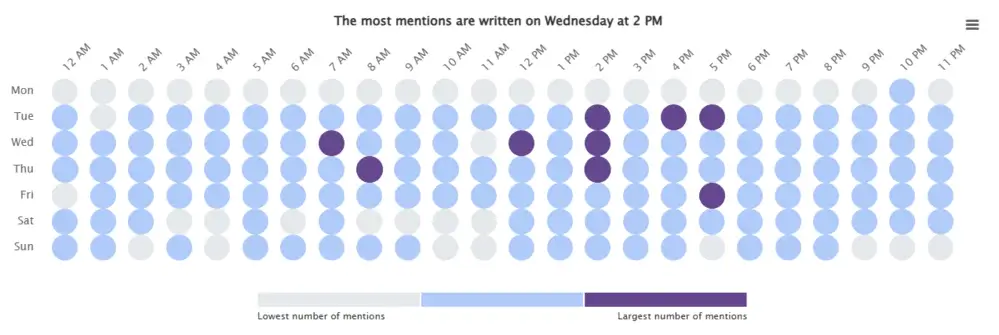
The choice is obvious – heatmap provides the information at a glance!
04 Compare data with previous periods
To truly understand your progress, you need a reference point: your past performance.
By comparing current metrics with past results, you can see whether your YouTube marketing strategy is on the right track or needs to be refined.
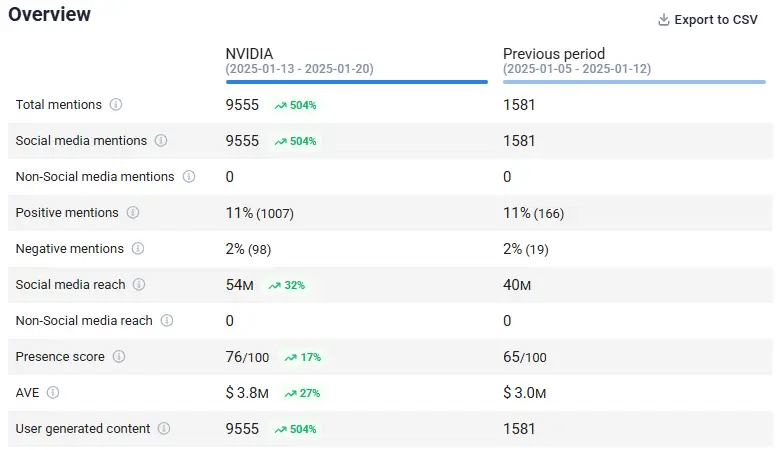
As you can see in the comparison provided by Brand24, NVIDIA is recording an increase compared to the previous period.
Compare your YouTube performance!
05 Compare data with rivals
Another reference point can be your competitors and their performance on YouTube.
How to do it?
In addition to setting up a project in Brand24 for your own company, you’ll need to create a project with your competitor’s name as well.
Then, use the Comparison feature to see who the king of the jungle is… Oh, sorry, I meant YouTube! 👑
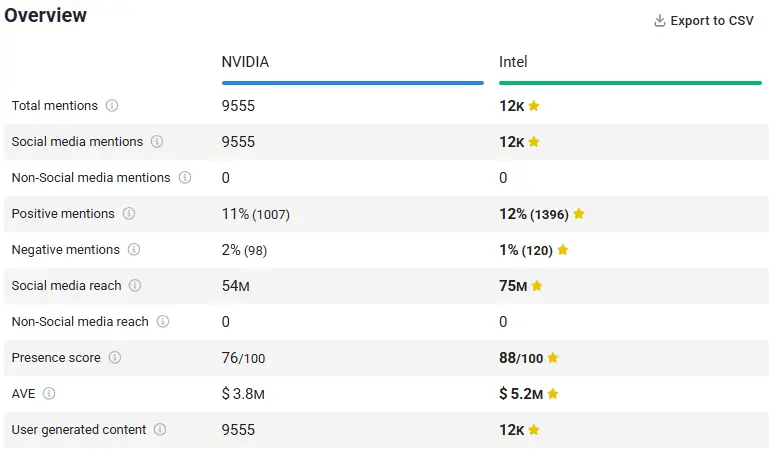
In the battle of NVIDIA vs. Intel, the winner is… Intel!
See how GoPro nails it! Dive into YouTube competitor analysis with a real case study.
Discover YouTube analytics data of your competition!
06 Include plans and recommendations
Of course, the YouTube report includes current data, but it should also contain recommendations for the future.
Writing recommendations can be pretty tricky! Thankfully, we have AI to make it easy!
It analyzes the data and, based on that, gives actionable insights to guide you and your company!
Let’s go back to our NVIDIA example – here’s what Brand24 recommends for this brand to do next:

07 Add summary
The summary is a crucial part of any report.
YouTube reports can sometimes be very complex, and your boss might not have time to read the entire document. In such cases, they’ll focus on the summary.
A well-written summary:
Provides a quick snapshot of performance
Highlights key data trends
Outlines what worked and what needs improvement
It ensures your boss (or anyone else) gets all the essential information.
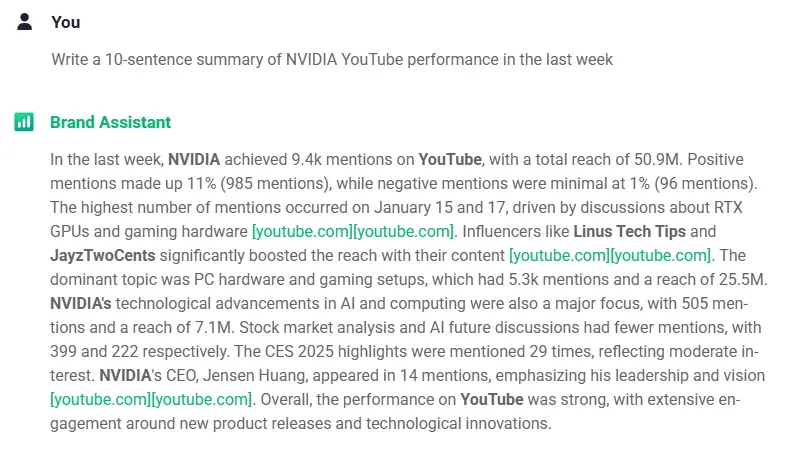
AI Brand Assistant, a true master of writing summaries, created the summary above.
It uses data from your Brand24 project and combines it with knowledge from its big brother, ChatGPT!
So, you can rely on it not only for summaries but also for more advanced tasks.
Create a comprehensive YouTube analytics report!
Good practices
Let’s face it – most people, especially those in higher positions, often don’t read reports in detail.
Sad but true😔
So, what can you do to change this?
Here are my tips to increase the chances of your YouTube report being read from cover to cover:
01 Start with a summary
The summary should always be at the beginning, never at the end.
The reader should immediately see the key insights without digging into detailed analyses.
02 Keep it simple
Remember, a YouTube analytics report is a document based on data.
Use straightforward, clear language and avoid fluff.
03 Use visualizations
Wherever you can insert charts, graphs, and other elements to make the data easier to read.
Readers are more likely to engage with visual elements than a full page of plain text.
04 Incorporate the data from other sources
I know you want to create a YouTube analytics report specifically.
However, it can be valuable to include data from other marketing channels to provide a broader perspective.
05 Customize the report
When preparing a YouTube report for a client, tailor it to their branding. Add their logo, use the right colors, and, if possible, match their font style.
Even for internal reports, maintain a consistent branding for a professional look.

Generate customized reports!
06 Focus on the most important data
YouTube reports often delve into in-depth analyses but shouldn’t include every metric.
It is better to create multiple reports with specific goals and relevant metrics instead of one massive report with no clear focus.
07 Add context
Data alone isn’t enough. Add explanations and context to help the reader understand the numbers.
Use data storytelling to clarify insights and explain anything that requires additional interpretation.
08 Choose the correct format
Before delivering a YouTube report, confirm the recipient’s preferred format.
It doesn’t always have to be a dashboard that monitors data in real-time; it could be an interactive report or even a simple PDF.
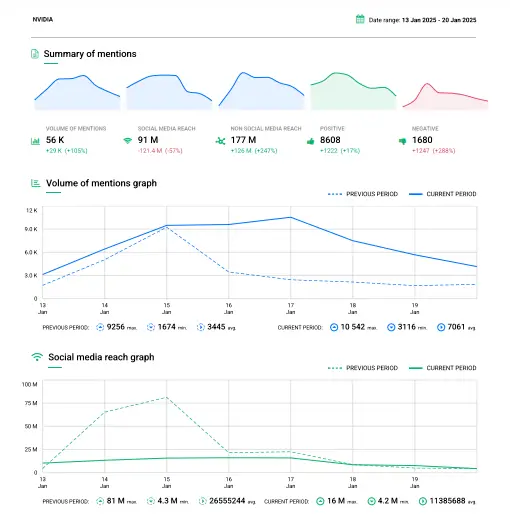
09 Plan regular reporting
Reports shouldn’t be delivered randomly. Schedule them consistently to compare data over time and provide updates regularly.
Tools like Brand24 offer automated report delivery.

10 Schedule a presentation
While most YouTube analytics reports won’t require a formal presentation, some key reports might.
In those cases, present the data with slides and provide an interactive report or just a PDF version for those interested.
11 Follow up
Once the report is delivered, don’t stop there.
Reach out to the recipient to discuss their thoughts, answer questions, and plan the next steps. A report should lead to a further action plan.
Grow your YouTube channel with analytics!
Conclusion
A YouTube analytics report is a MUST for anyone aiming to succeed on the YouTube platform.
Dashboards provide access to monitored metrics in real-time. Unfortunately, the amount of data can sometimes overwhelm users, especially those who do not use the analytics tool daily.
That’s where YouTube reports come in – they’re designed to present the most important YouTube data in a clear, structured way that’s easy to understand and share.
Such reports highlight the most important insights, making it easy for decision-makers to focus on what truly matters.
Final thoughts:
A good YouTube analytics report isn’t about listing data; it’s about making it meaningful and visually engaging.
Reports should save time for their readers – they can’t be overly long.
With AI-powered tools like Brand24, creating professional YouTube analytics reports is easy. You barely have to lift a finger – the report generates itself!
Create an outstanding report with Brand24, a tool that tracks various data and transforms it into insightful, easy-to-read, and fully customizable reports 👉 Try it for free!


