Table of contents
2M Marketers

With over 2 billion monthly users, YouTube remains the 2nd most popular website (and search engine) worldwide. Achieving success on this platform is not a matter of luck. It’s a matter of strategy based on quality content and tracking key metrics.
Do you know what’s the secret behind literally every successful YouTube channel? It’s a data-driven approach.
Sure, you might be a highly talented creator making great videos. Still, you’ll not fully succeed on YouTube without mastering YouTube analytics. How to do it in practice?
At first glance, YouTube analytics may seem difficult. But everything is getting easier when you know which key metrics you should prioritize. In other words, you should break the whole process into small pieces.
I want to be completely honest with you. You won’t find all the metrics in this article. Nah, you won’t even find half of them! But I have a fair excuse – there are so many that no one truly measures every single one.
Instead, I present to you seven key YouTube metrics to track. Mastering them will upgrade your channel performance to a new, higher level.
Okay, let’s dive in!
Key YouTube metrics to track:
01 Watch time
Watch time indicates the total accumulated time people spent watching your videos on YouTube.
YouTube’s algorithm interprets the higher watch time as an essential and positive signal. That’s because it supports the platform’s primary goal – keeping people on YouTube. Thus, the more time people spend watching your video content, the more likely the algorithm will promote it (i.e., in suggested videos).
Watch time is definitely one of the most influential YouTube metrics. YouTube explicitly wrote about it on its support page.
How to measure?
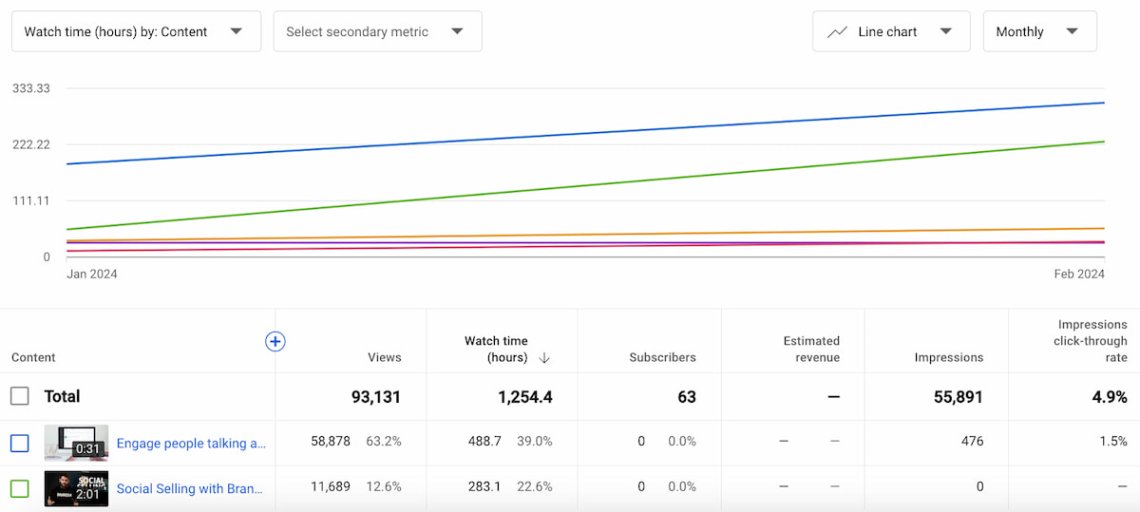
The most convenient way to measure watch time is by using native YouTube analytics.
Visit your YouTube Studio and click “Analytics” in the column below your profile picture. Then, choose the Advanced Mode. Now, you should see the detailed YouTube analytics dashboard.
To see the list of your top videos by the watch time, select this option in the Content tab. Set up other dimensions if needed (the type of chart, the period, etc.).
Track key YouTube metrics!
02 The volume of mentions
The volume of mentions refers to the frequency at which your brand is discussed or mentioned across various platforms and media.
With access to this data, you can discover trending topics in your niche, problems your audience faces, questions they ask, and sources of information they use.
Thus, the volume of mentions is a critical metric for planning your YouTube content and analyzing your target audience’s behavior & expectations.
How to measure?
The best way to track mentions volume (and YouTube analytics in general) is by supporting YouTube Studio with external YouTube analytics tools. I recommend you try a social listening platform like Brand24.
To track the volume of mentions, just identify keywords and set up the project. The keyword can be your brand, product, service, or the name of your YouTube channel.
Once done, you gain access to mentions published on YouTube, other video sites, social media platforms, news, review websites, podcasts, blogs, and so on.
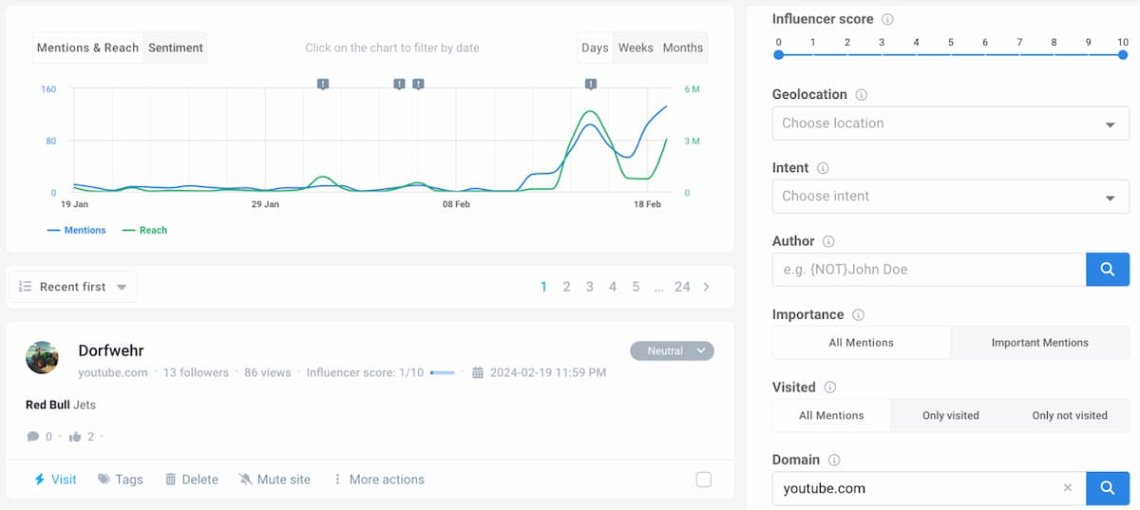
You can analyze the volume of mentions in time (blue line on the chart below) and identify top sources for your brand awareness.
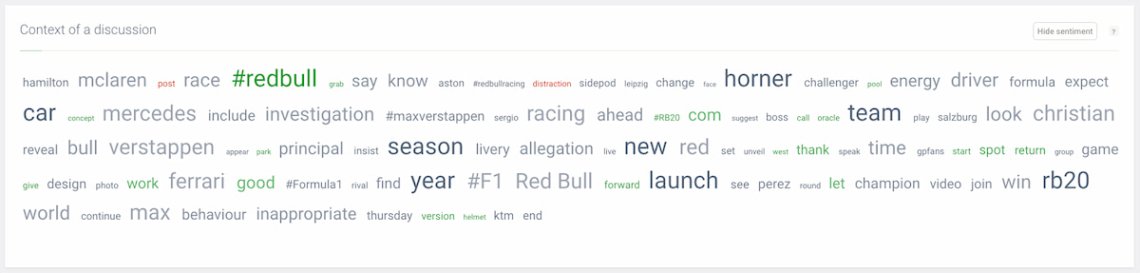
This knowledge lets you improve your video marketing strategy by discovering the most frequently repeated keywords regarding your niche or brand.
How? For example, by using popular keywords in the titles of your future videos.
Moreover, you can adjust your content to a particular location by knowing the most active countries.
Here is a quick example.
Red Bull is a recognizable brand known for… well, a lot of things. What comes first to your mind?
Most probably their energy drink. But the company engages in many spheres like F1 (the Red Bull team is currently top in the world), soccer (they own successful clubs in the US, Austria, Germany, and Brazil), or extreme sports – just to name the most recognizable.
With such diversity, Red Bull might use the volume of mentions to identify topics generating the most buzz and engagement among their audience. Thus, they could tailor their video content to match their audience’s interests.
As you can see below, the most popular YouTube mentions correlated with Red Bull are those related to Formula 1.
Besides, Red Bull sponsors and organizes a lot of exciting events. The volume of mentions gives valuable insights into the effectiveness of their promotional efforts and overall reception of events. This can help Red Bull refine its future event marketing strategies and content creation to maximize impact.
03 Engagement
YouTube engagement metrics refer to the number of interactions with your videos or YouTube channel. Your audience can engage with your content with likes, dislikes, comments, shares, and subscriptions.
Tracking engagement metrics informs you about your audience’s reception of your video or channel’s overall popularity. People’s reactions tell which videos perform well and which do not, the sentiment towards your content, and help choose your YouTube strategy’s direction.
I’ll put it this way: the more engaging the video, the happier the YouTube algorithm.
How to measure?
Go to your YouTube Studio, access YouTube Analytics, and click Advanced Mode again.
Look at the table at the bottom of your screen. Can you see the blue “+” symbol? Great, we’ll use it to add engagement metrics to your table view.
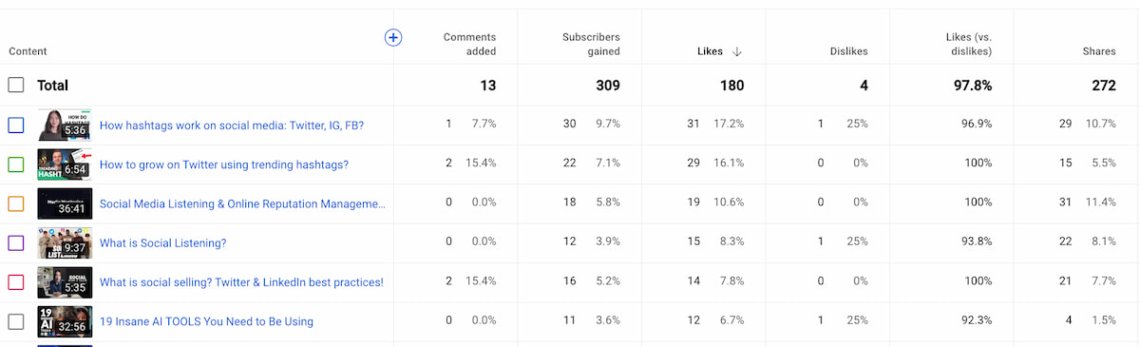
Click on the blue “+”, scroll down to the “Interactions” section, and choose “Subscribers gained”. Repeat the whole procedure with all the engagement metrics: likes, dislikes, shares, and comments.
Now, you can analyze all your engagement metrics in one table.
Additionally, you can use Brand24’s Mention tab to identify the most engaging content mentioning your brand.
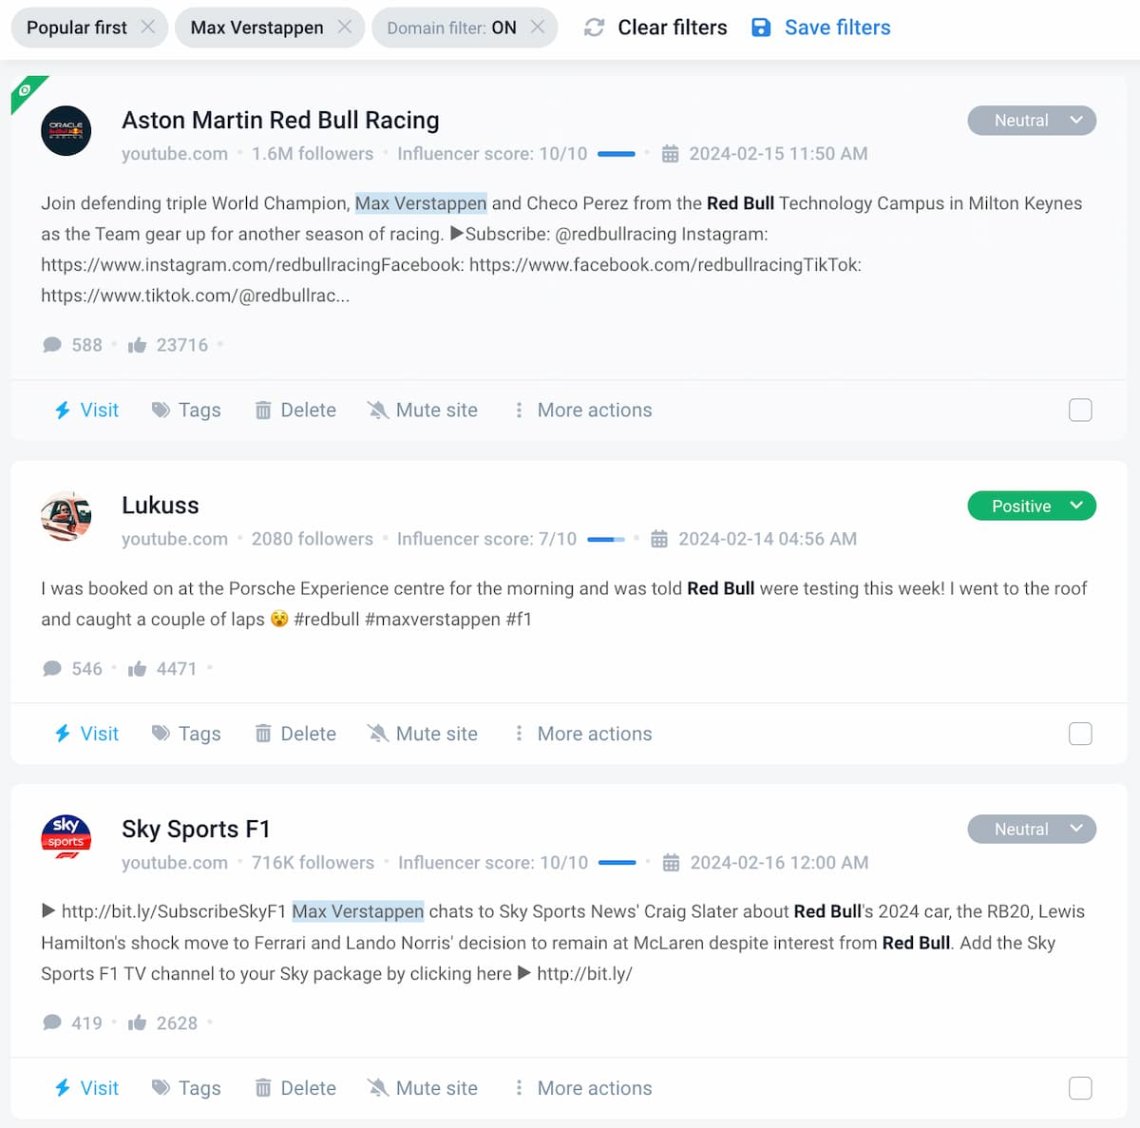
Once at the Mentions tab, apply the “Popular first” filter, and you’ll see a list of mentions ordered according to the most influential YouTube videos (by number of comments and likes).
See the example below.
Bonus: Read the complete guide to YouTube engagement and uncover 10 effective strategies.
04 Sentiment analysis
Sentiment analysis is a metric for judging the emotions and attitudes towards your brand. It identifies if the general feeling about a brand or topic is positive, natural, or negative. In essence, sentiment analysis reveals the emotional stance of the person mentioning a specific topic.
In the case of YouTube analytics, recognizing and understanding the sentiment gives you insights into improving your YouTube video content and – more broadly – your product or service. Besides, it can help you quickly react to negative sentiment and prevent potential brand crises.
How to measure?
The invaluable source of sentiment-related insights is a good social listening tool.
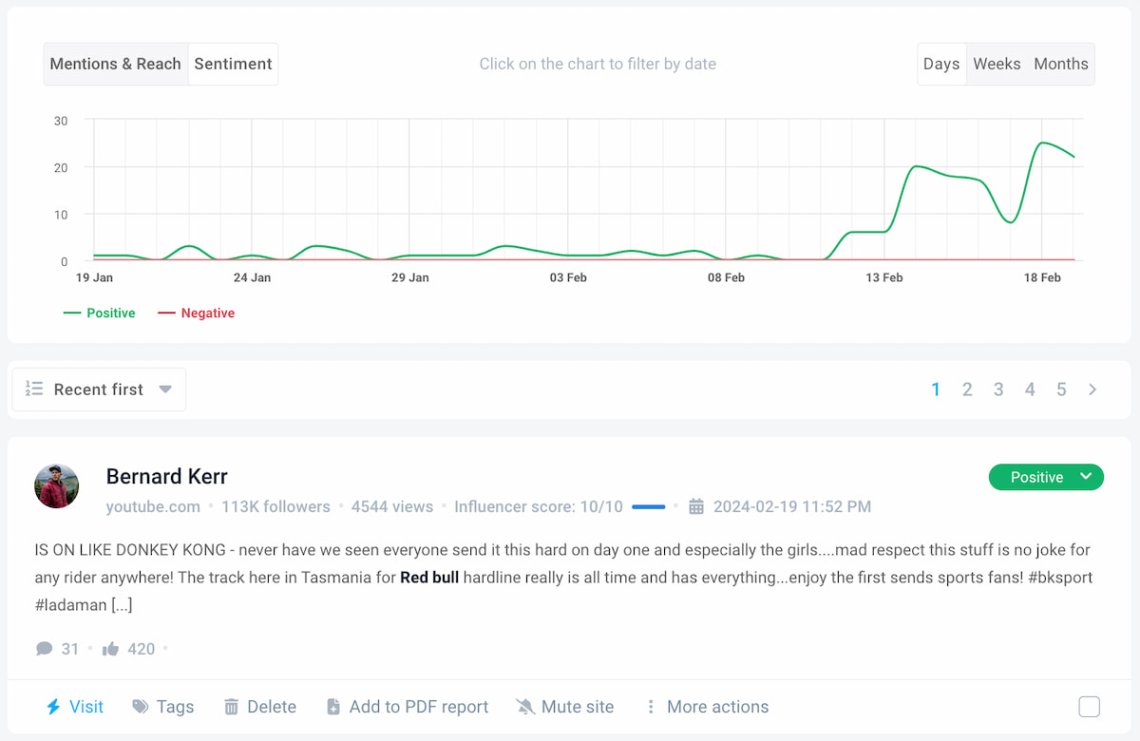
Brand24’s AI sentiment analysis identifies the emotional context of each mention. You can see the overall rate on the right side (it can be positive, neutral, or negative).
At the top of the Mentions tab, you can switch the chart view to sentiment and analyze the feelings towards your brand on YouTube over time.
A quick example
Let’s go back to our Red Bull example. Below, you can see the brand’s sentiment analysis chart, including all the sources (YouTube, social media platforms, websites, and so on).
You can easily spot a sudden spike of both negative and positive sentiment on February 15th.
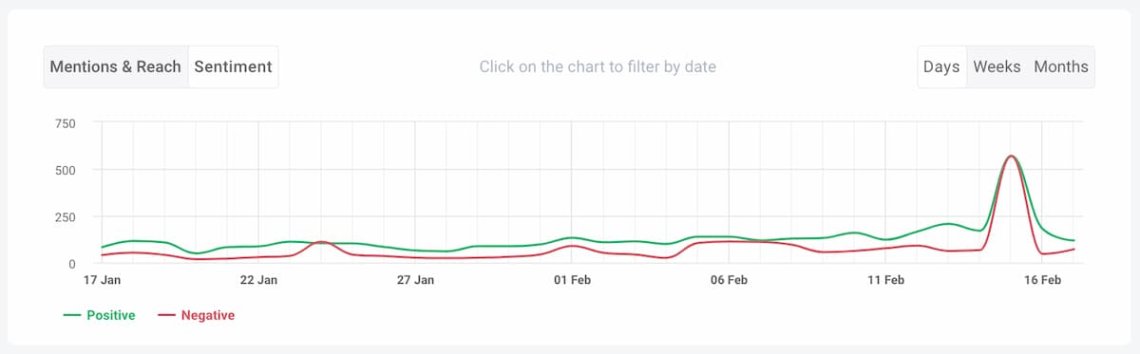
On that day, Red Bull held an event to show off their new F1 car for the 2024 season, which most people felt good about.
However, at the same event, the head of Red Bull’s F1 team (Christian Horner) addressed accusations of him mobbing an employee, which led to a noticeably negative response.
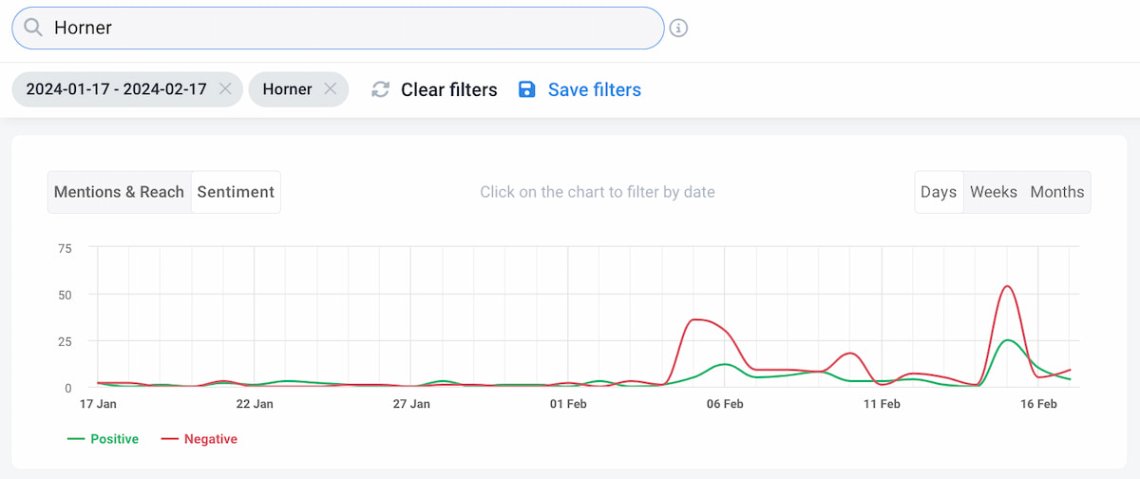
Now, see the sentiment analysis chart for YouTube only.
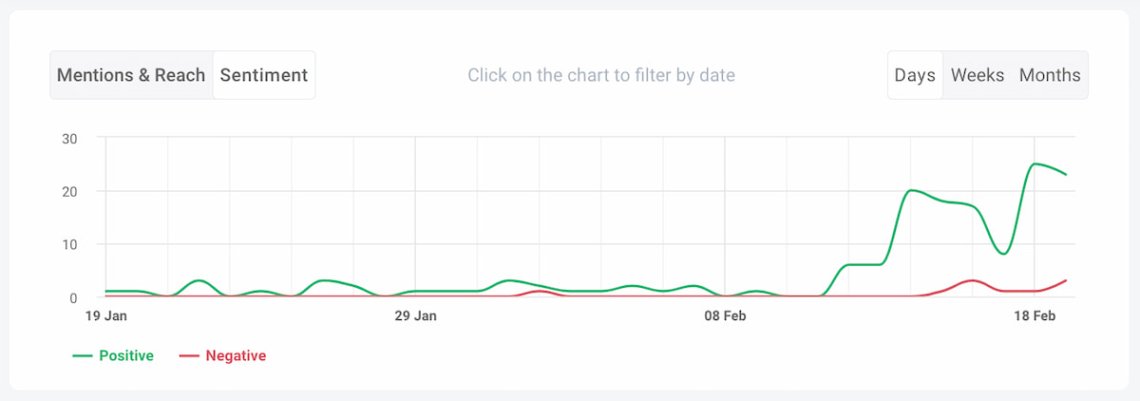
Conclusion 1: The YouTube audience doesn’t care about what’s happening behind the Red Bull F1 team’s scenes. They were interested in a new car release, not the allegations against Horner. It proves Red Bull’s sport and event-based brand image strategy works well.
Conclusion 2: Monitoring only one source (YouTube) is insufficient to recognize and respond to a brand crisis. To have a full picture of your brand reputation, you need to perform media monitoring of as many sources as possible.
05 Audience retention
Audience retention means the average percentage of a YouTube video that viewers watch. In other words, it indicates how many percent of people continue watching the video throughout its duration.
Audience retention is one of the key metrics for YouTube creators because it shows how well a video keeps viewers’ attention. A high audience retention rate suggests that viewers find the video interesting.
Moreover, the audience retention chart gives wonderful insights into your video performance. You can identify which parts of the video are the most engaging and which parts people skip. This knowledge lets you draw accurate conclusions and improve your future video strategy.
Last but not least, high audience retention is a powerful positive signal to the YouTube algorithm. We can summarize it this way: the higher the average view duration, the better.
How to measure?
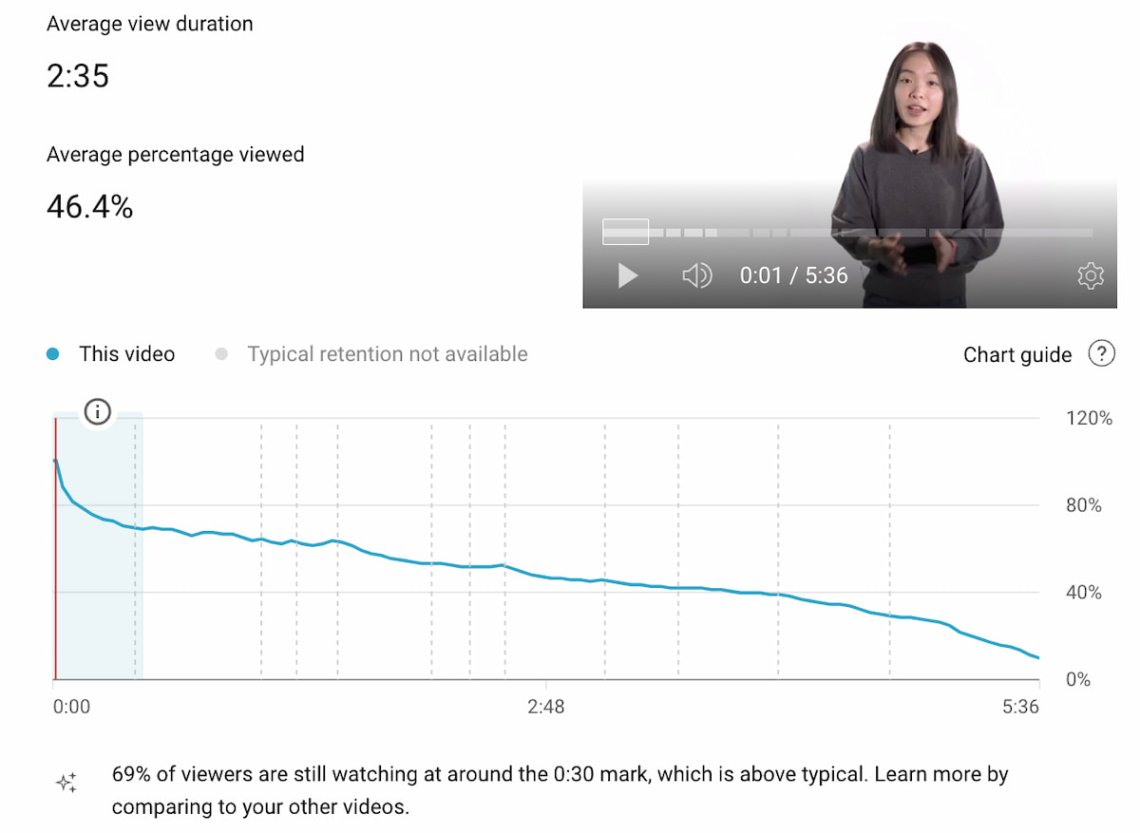
Go to YouTube Studio and select the video to see its analytics.
You’ll see the graph at the bottom of the overview page (or in the Engagement tab). It shows what percentage of your audience keeps watching the video throughout its duration.
The blue line shows the video performance over time. Generally speaking, the flatter the line, the better! Spikes on the graph mean people return to these parts of your content more frequently.
For further explanations, click the question mark next to the Chart guide.
06 Share of voice
Share of voice (SOV) is a metric measuring the awareness of your brand, product, service, or YouTube channel compared to competitors in the same niche.
To calculate the SOV, you must divide your brand’s metrics by the total market metrics.
Share of voice is one of the best metrics to know the results of your PR campaigns. It also allows you to understand your brand’s performance and benchmark it with your niche competitors.
As for YouTube, understanding your SOV is crucial to knowing how your videos are noticed and watched compared to other channels in your niche. This metric is key to figuring out how well your YouTube videos grab viewers’ attention and keep them on the platform.
How to measure?
At first glance, measuring the share of voice may seem complicated. Thankfully, external tools like Brand24 can do it for you.
There are two ways to check the SOV metrics: by benchmarking with a competitive project or by comparing data with the whole market.
So let’s do it!
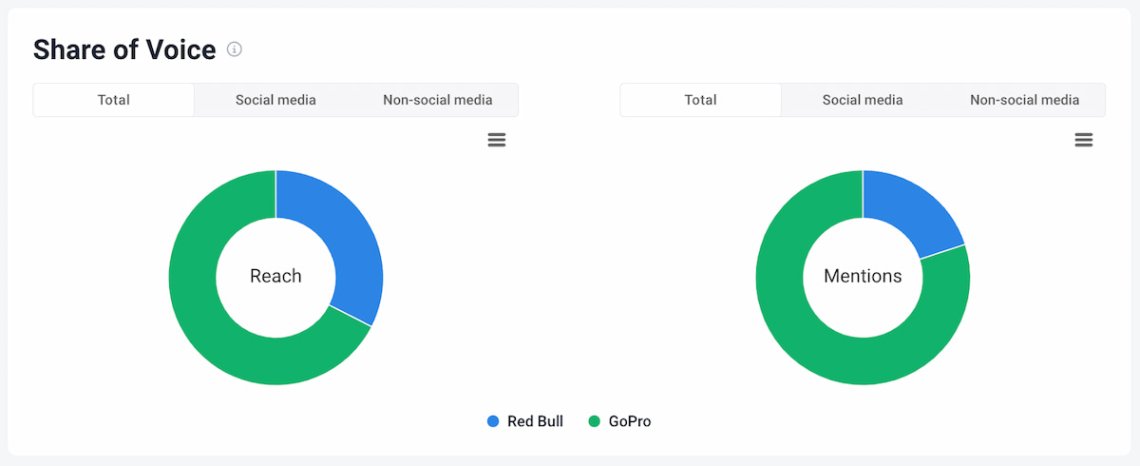
To show you how it works, I decided to benchmark Red Bull’s YouTube share of voice in the extreme sports niche with GoPro. You probably heard about their flagship product – a sports camera. Sometimes, I feel like GoPro has become a synonym for a sports camera.
Go to the Comparison tab, click “Compare projects”, and select a project (or projects) to compare. Choose the period you’re interested in and set the domain filter by inserting “youtube.com”.
Under the overview and mentions analytics, you’ll see two pie graphs presenting Red Bull’s and GoPro’s share of voice regarding mentions reach and mentions volume.
As you can see, GoPro has a more significant YouTube presence than Red Bull. To be honest, I am not surprised at all.
Now, I’ll show you the second way to use SOV for your YouTube analytics.
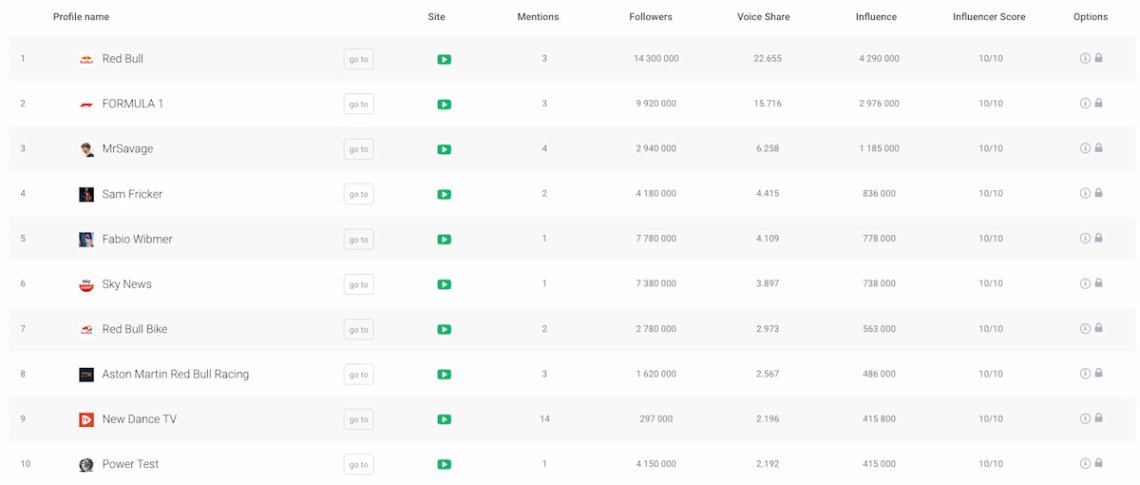
Go to the Analysis tab and scroll down to the “Top public profiles” table. Here, you’ll see 10 YouTube channels with the highest share of voice metrics regarding your brand.
Click “More” (or directly choose the Influencers tab on the right column) to see the complete list of YouTube creators with the highest share of voice.
This is an excellent method to benchmark your YouTube channel share of voice. Or to discover channels with the highest SOV that are talking about you.
07 Impressions click-through rate (CTR)
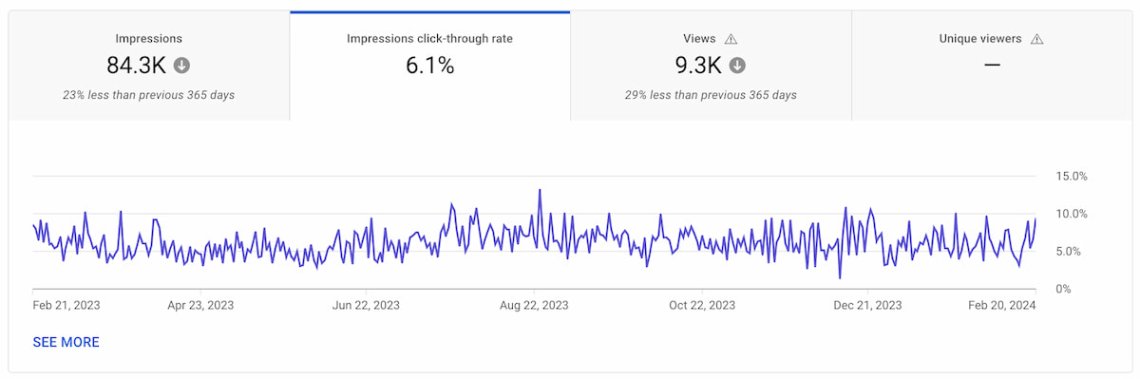
According to the YouTube support page, the impressions click-through rate measures how often viewers watch a particular video after seeing an impression on YouTube.
YouTube impression occurs when someone sees a video’s thumbnail as a suggestion to watch. YouTube counts impressions only if they meet two conditions at the same time:
1. The impression is displayed for a minimum of 1 second
2. At least 50% of the thumbnail is visible
To put it simply, impressions CTR measures if people click your thumbnail. Therefore, knowing your impressions’ click-through rate gives you insights into the efficiency of your thumbnails and video titles. Thanks to this, you can find your perfect formula.
How to measure?
Log in to your YouTube account and revisit YouTube Studio. Choose one of your videos and click on Analytics. Now, go to the Reach tab. As we discuss the CTR metric, tap on Impressions click-through rate over the line chart.
You can track how much your CTR changes over time, enter advanced mode to get deeper insights and scroll down to check more details about your YouTube performance.
Above all, you can discover how viewers find your videos and which YouTube search results bring you the most traffic.
Tip: Advanced tools can analyze metrics for you
I know what you may think: “There are only seven metrics, but tracking them all must be so time-consuming!”.
No worries, I have good news! You don’t need to do everything manually.
The blessing of living in the AI era is that many analytical tasks are automated. You just need appropriate tools to process data, provide actionable insights, and draw accurate conclusions.
Brand24 offers a variety of AI-boosted features. They are created to improve your workflow by saving time on various analytics tasks. My favorite one is a Metrics Analysis tab.
The first thing you’ll notice is the Summary. It’s an AI-generated text that gathers all the most important data from the project and presents them in a few brief sentences. Personally, I always start my analysis by reading the summary.
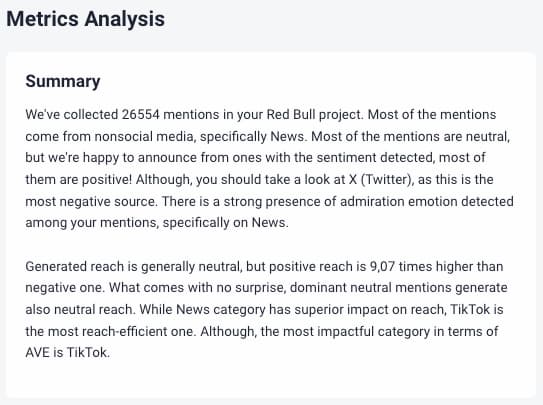
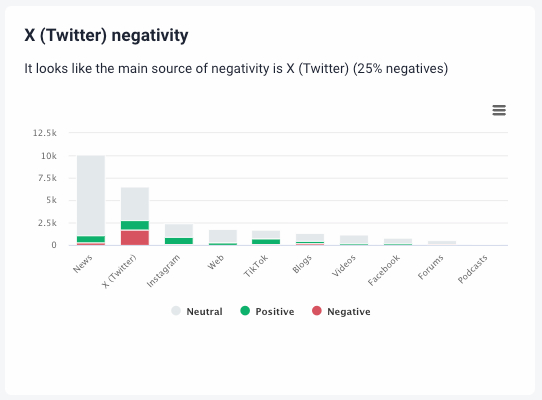
Moreover, this feature automatically analyses positive & negative mentions and presents which source is the most harmful to your brand reputation.
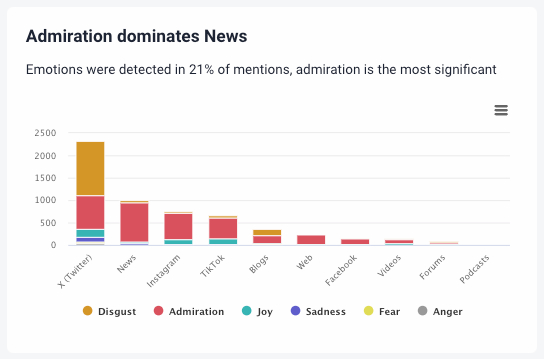
Metrics Analytics also gives great insights into the dominant emotions in your brand mentions. As you can see below, admiration is the main feeling towards Red Bull. Except for the X platform.
That’s not all!
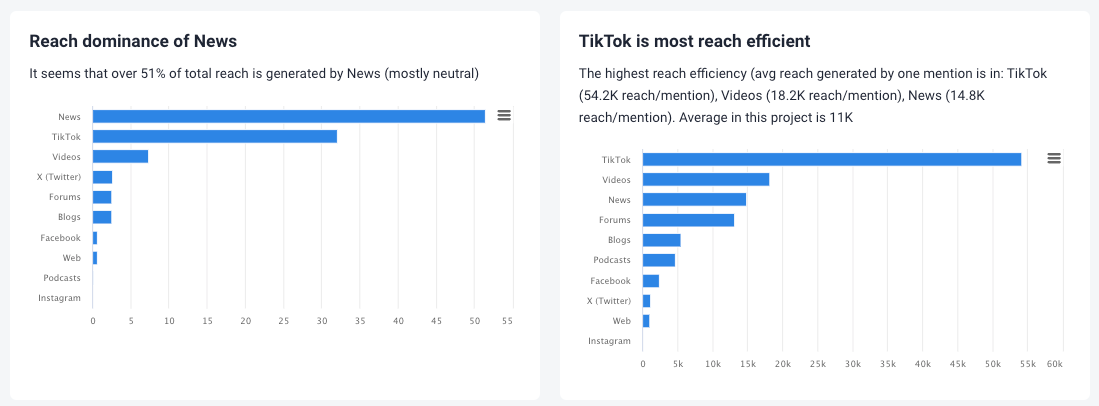
With Metric Analytics, you can discover your most reach-efficient sources. It counts how many people can see an average mention posted on a single source. As you can see, a single Red Bull mention on TikTok reaches much more people than on other platforms.
Conclusion
Knowing the key metrics is crucial to maximize your YouTube effectiveness. As this video platform doesn’t exist in a vacuum, you should have a comprehensive approach to YouTube analytics.
It means that you must track your video & YouTube channel parameters, as well as take care of your brand awareness & reputation management. Moreover, you must strengthen the share of voice in your niche with a well-thought YouTube marketing strategy.
Key takeaways:
- Watch time, engagement, audience retention, and impressions CTR are the top metrics regarding your YouTube videos.
- But you shouldn’t analyze YouTube performance in isolation from other sources.
- The volume of mentions, sentiment analysis, and share of voice are key metrics to analyze your YouTube niche and environment.
- Tracking key metrics requires supporting native YouTube Studio analytics with a professional media monitoring tool.
- AI-boosted features save your time and increase your YouTube analytics efficiency.
Want to effectively track key YouTube metrics? Try Brand24 for free!