Table of contents
The 7 Best Business Intelligence Reporting Tools to Try
According to Straits Research, the global adoption rate of Business Intelligence tools reached 26% — meaning that one in four employees regularly uses them. BI tools now play a key role across multiple areas of an organization, from marketing and sales to product development. Their growing presence supports smarter decisions and stronger collaboration at every level.
In this article, I’ll show you 7 top media and BI tools (business intelligence tools) that can help you track results and improve your sales and processes.
See which fits you best and take your strategy to the next level!
Let’s dive in!
What are media and business intelligence reporting tools?
Can you imagine your job today without automation?
As a content manager, I would not have time to write articles like this if I had to create all the reports myself.
Quick Summary:
- Good marketing reporting tools are those that help you quickly (and preferably completely automatically) create a transparent summary of your work’s impact so that you can immediately analyze, draw conclusions, and make the necessary changes.
- Business intelligence reporting tools allow you to gather information from many different sources in one place. They then help you analyze, visualize, and report on the information, automating some of your work.
- Media analytics tools are similar solutions but focus on collecting and processing brand information from external sources (social media, forums, websites, etc.). They improve company reputation management and optimize marketing strategies.
Why do you need these tools?
Imagine that you are in charge of promoting the TV series White Lotus.
The first episode aired on 16 February 2025. Since then, the phrase’s social media reach has reached almost 460,000,0000 and 28,500,000 interactions, and almost 46,000 online mentions have been generated. The AVE was $63 MLN, even before the series’s end.
This is the data you need to show transparently to your team, your bosses, and probably future advertisers.
That’s what media and business intelligence tools are for: to make your job of collecting and visualizing data as easy as possible.
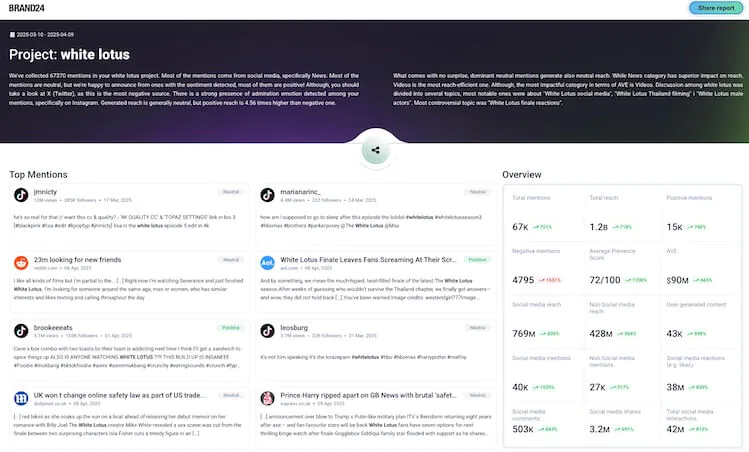
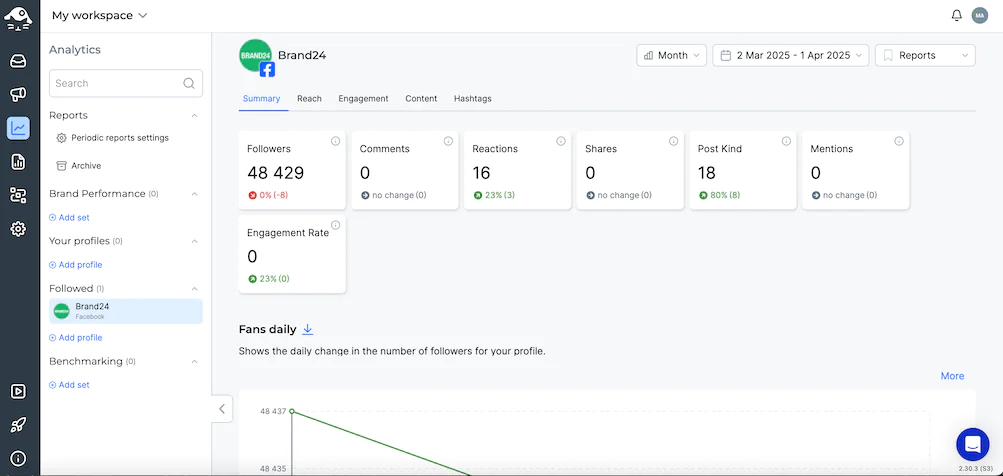
Staying with the White Lotus series example, see how you can transparently generate a report in the Brand24 tool. With just a few clicks, all the information is available at a glance in the form of easy-to-read charts and tables.
With just one click, you can generate an advanced report about your brand visibility and share it with anyone! Go to the Mentions tab, and above the filters, you will find the “Generate Report” button.
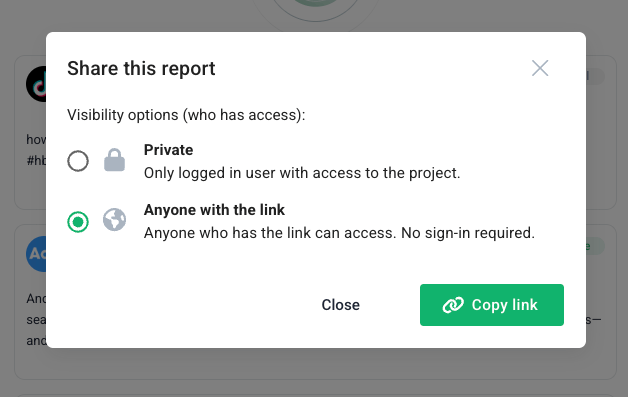
Then click the button with the share icon or the ‘Share report’ button in the top right corner. Now, you can choose the sharing option and copy the link to the report.
Top media and business intelligence (BI) reporting tools
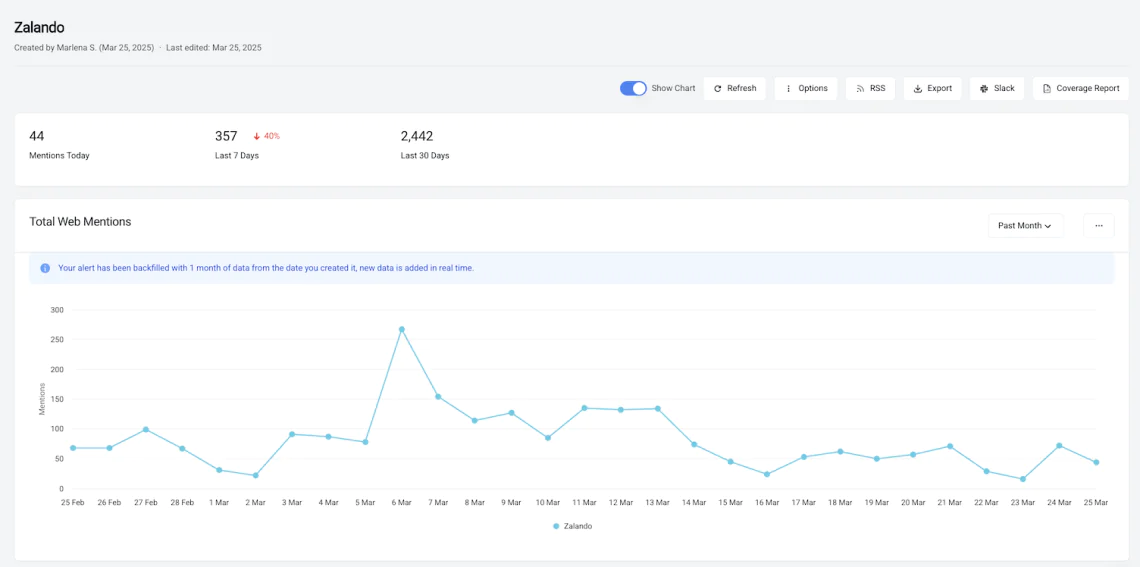
01 Brand24
Brand24 is a social listening and one of the best media monitoring tools that helps brands track online mentions, analyze sentiment, and understand how they are perceived online.
Brand24 monitors a wide range of online sources, including:
- Social media (Facebook, Instagram, Twitter/X, YouTube, TikTok, Telegram, LinkedIn)
- News sites and online publications
- Blogs and forums
- Podcasts and videos (selected platforms)
- Review sites
- Reddit and other community platforms
- Web comments and user-generated content
The types of reports you can create with the Brand24 tool:
- Quick Share Report you can send to anyone
- PDF reports
- Excel reports
- Email summaries
- Infographics
- Real-time storm alerts via email or SMS
- Real-time storm alerts delivered to a Slack channel
Social media metrics easy to find
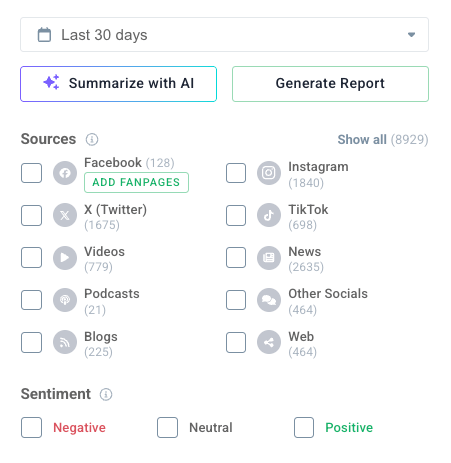
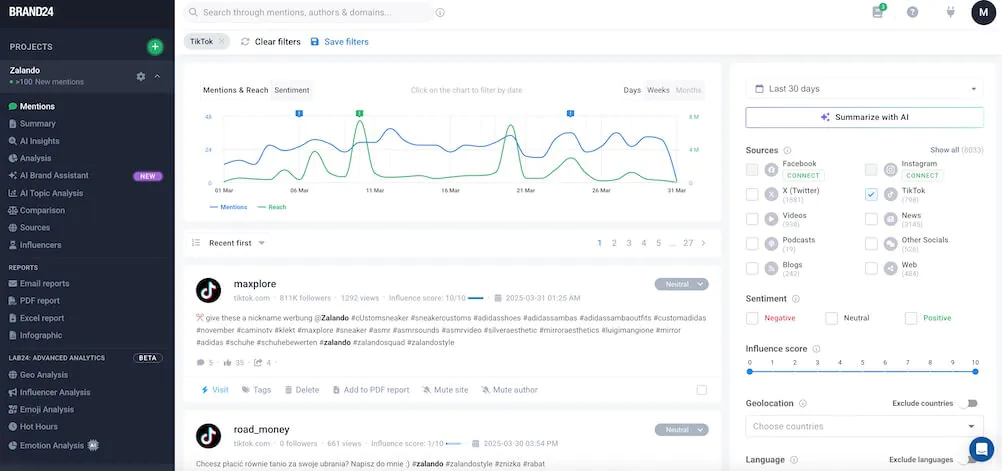
In this one of the best social media analytics software, it’s easy to find the social media analytics data you need. Simply go to the “Mentions” tab and, on the right-hand side, select the social media apps you’re interested in. You can choose all of them or filter mentions, for example, to show only those from TikTok.
Strengths:
- Multiple options for generating automated reports
- AI features that help interpret data
- A wide range of insights in one app
- 7 different ways to report
What could be better:
- Separating social media reports from other types of data for easier access
02 Napoleon Cat
NapoleonCat is a comprehensive social media analytics tool for managing social media profiles and advanced analytics capabilities.
It allows you to schedule posts, moderate comments and messages, and assign tasks within your team. You can also follow the profiles of other brands.
The platform supports Meta (Facebook & Instagram), X (Twitter), YouTube, LinkedIn, TikTok, Google Play Console, and Apple App Store. With NapoleonCat, you can monitor both organic activities and paid social media campaigns.
The interactive dashboards also make it quick and easy to generate custom reports.
You decide which data and time range to include in each report. It is easy to schedule recurring reports, so NapoleonCat automatically sends you performance summaries of your marketing activities.
The types of reports you can create with the NapoleonCat tool:
- PDF reports
- CSV reports
Basic analytics and more
This social media analytics tool can be a real game-changer if you want to save time switching between many platforms. It is very helpful for analyzing data from many social media channels and gaining meaningful insights.
It simplifies the analysis of campaign performance and organic activity while giving you easy access to historical data.
Strengths:
- Analytics for organic activities and advertising campaigns in one place
- Low price
What could be better:
- Faster report generation
03 BuzzSumo
BuzzSumo is a data analytics tool designed to monitor your brand mentions and online trends rather than track your brand’s performance. It helps you discover the most engaging content, spot emerging topics, and identify influential voices in your industry.
It’s an excellent resource for developing a data-driven social media strategy and creating timely, relevant content. I find it helpful as a data visualization tool to generate clear and easy-to-read reports for business users. Intuitive also for non technical users!
The platform tracks online activity around selected keywords, helping you quickly identify negative feedback, prevent potential crises, and actively engage with your audience.
It delivers clear insights into the number of mentions, social media shares, and the exact sources where your brand is being talked about.
The types of reports you can create with the BuzzSumo tool:
- PNG reports
- JPEG reports
- PDF reports
- SVG vector image reports
- CSV reports
- E-mail alerts
Comprehensive analytics tool
BuzzSumo is a valuable social media analytics tool for marketers who want to monitor conversations around their brand and stay ahead of communication trends.
It’s especially well-suited for brands looking for strategic insights without the need for overly detailed analytics.
Strengths:
- Simple, intuitive interface
What could be better:
- More in-depth data and detailed analytics
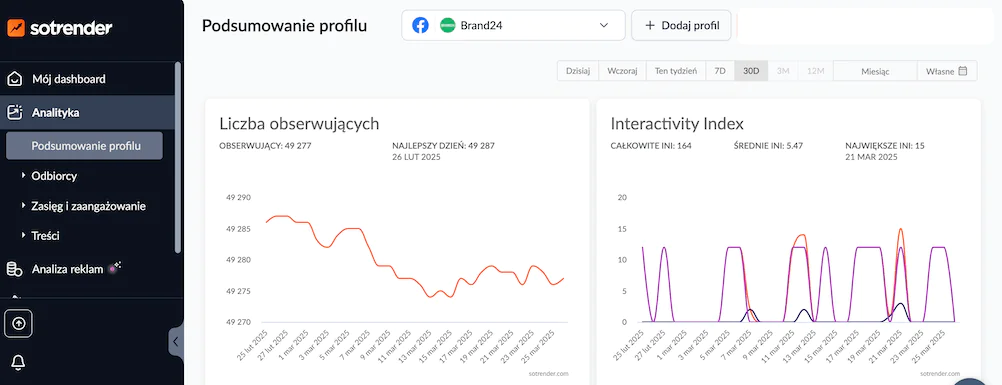
04 Sotrender
Sotrender allows you to monitor your brand or competitors and build social media presence. It tracks ad performance and using data analysis helps optimize your budget and promotional strategy based on data.
It’s a brand intelligence and social media analytics tool that doesn’t offer profile management or content publishing features.
One of Sotrender’s key strengths is data insights. There is also ability to analyze and optimize ad campaigns. To do this, it uses AI algorithms that evaluate your brand’s performance and that of your competitors.
Sotrender provides standard reporting features. You can schedule recurring reports, but you cannot customize their content. There are basic data visualization capabilities.
The types of reports you can create with the Sotrender tool:
- PDF reports
- CSV reports
- PPTX reports
All your data in one place
It’s an excellent social media analytics tool for business users who manage large advertising campaigns and want to optimize their budgets efficiently.
Sotrender provides precise, easy-to-read aggregated data analysis and actionable insights that are ready to implement.
Strengths:
- AI solutions
- Campaign analysis
What could be better:
- Customizable reports
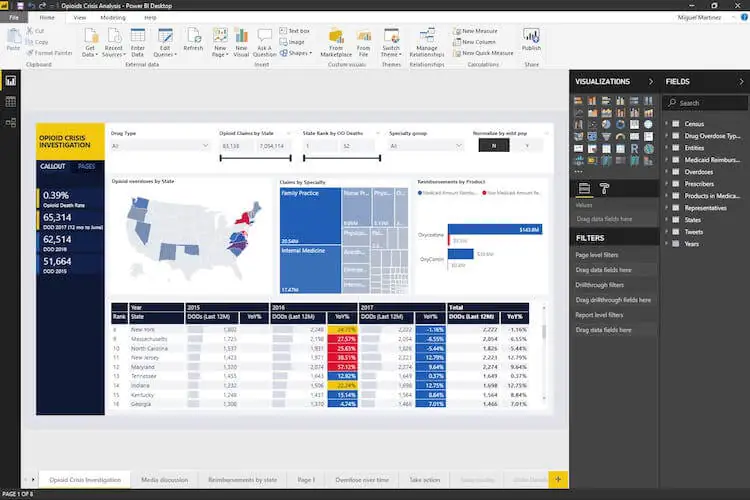
05 Microsoft Power BI
It is one of the most popular business intelligence tools. It quickly creates reports from data from many different sources, such as files, databases, or web applications. Power BI focuses on analyzing business, organizational, and marketing data.
Power BI gives you a real-time view of all your information in a single dashboard. This is a huge time saver! You can share and export reports from this business intelligence tool in various formats.
The types of reports you can create with the Power BI tool:
- PDF reports
- Excel reports
- Power BI interactive dashboards
- Embedded web reports
- Real-time/live reports
Big data analysis in a simple dashboard
What makes Microsoft Power BI one of the most popular BI tools? I think access to a lot of data visualization and data modeling capabilities. It allows you to aggregate quickly and segment data from different sources.
It also has predictive analytics capabilities, such as predicting sales performance in the coming months based on historical data.
From my experience, Power BI is useful business intelligence software for corporations that need advanced analytics, automation, and real-time data visibility across departments.
Why? You need access to large amounts of data from multiple sources to realize its potential. Then, you can analyze data, use interactive dashboards, and transform raw data into advanced reports.
Strengths:
- Predictive analytics
- Microsoft system integration
What could be better:
- No report sharing and team collaboration features in the free version of Power BI (Power BI Desktop)
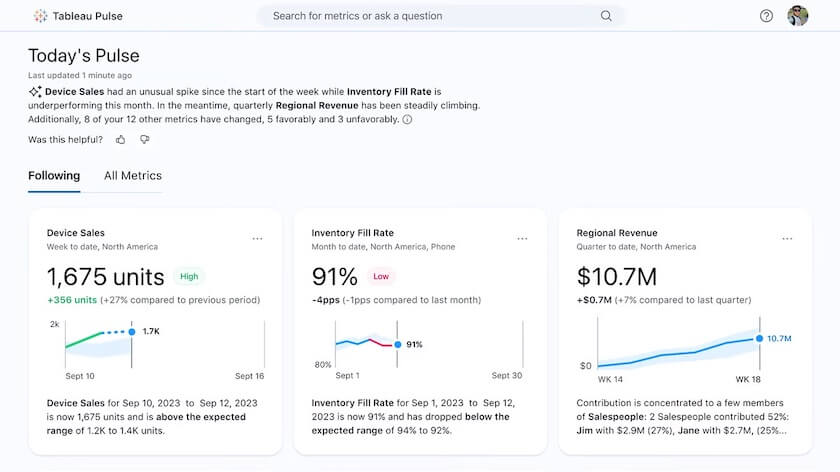
06 Tableau
This is one of the most popular BI tools developed by Salesforce and is well-known to all marketers. It is used for data analysis and visualization.
You can work with any data in it, including marketing, business, finance, or HR, making it a good choice for both data teams and business users.
Tableau has a very intuitive dashboard where you can create clear and visually appealing reports.
With its intuitive drag-and-drop interface, even non-technical users can create complex analyses. Like Microsoft Power BI, Tableau lets you view all data from integrated sources in one place, in real-time.
The types of reports you can create with the Tableau tool:
- Interactive dashboards
- PDF reports
- Excel data exports
- Real-time/live data reports
- Forecasting reports
- Story reports (narrative data presentations)
Creative data storytelling
Tableau is all about visualizing data in a personalized and interactive way. You can create reports that tell an engaging story to the viewer.
This is especially important if you present much data to a large audience, such as at a board meeting or in a publicly available e-book report. With this data visualization tool, you can take dull information and create inspiring and engaging content.
Strengths:
- Multiple data visualization features
- Intuitive interface (drag & drop)
What could be better:
- Less beginner-friendly
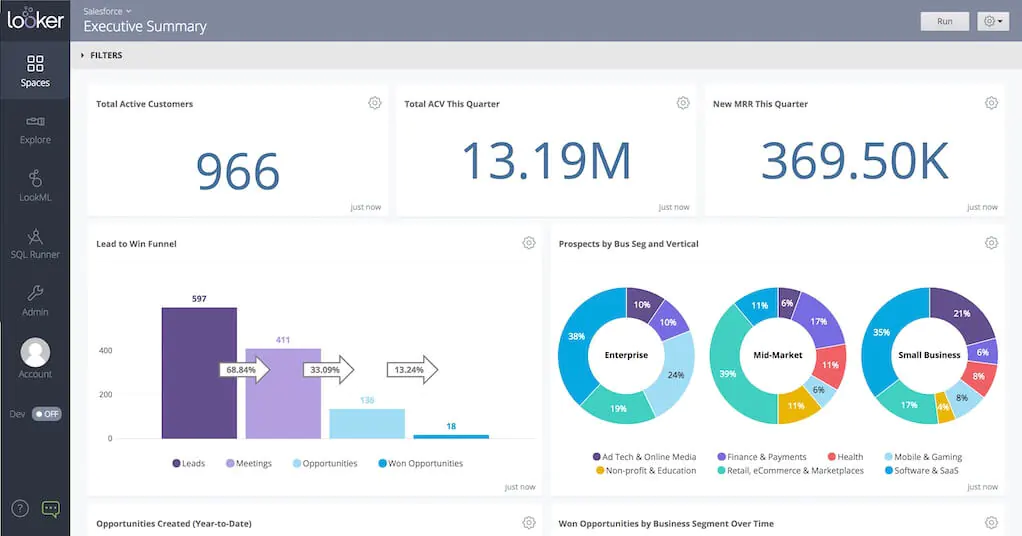
07 Looker Studio (Google)
Data analysis has never been more straightforward! This is my favorite for marketing and small business tasks. It’s very easy to use, very intuitive, and free.
Looker Studio supports add-ons from several sources (e.g., Facebook Ads, Shopify, SEMrush, HubSpot), which makes things much easier.
The business intelligence tool doesn’t have as many customization options for data visualization as Tableau and doesn’t handle large data sets or Power BI.
But it has a super-simple interface, the ability to work in a team, and quickly create interactive dashboards and easy-to-read reports. Sometimes that’s all you need.
The types of reports you can create with the Looker Studio tool:
- Interactive dashboards
- Real-time/live reports
- PDF reports (via export or print view)
- Embedded web reports
- Reports with Google Data source integration
- Custom visual reports with filters and time selectors
The simpler, the better
If you are starting your adventure with data analysis and visualization or know you will not be using very advanced features, this is your solution. It allows you to clearly present the results of a marketing campaign, for example. The reports are interactive, so you can filter the information you are interested in.
Looker Studio is tightly integrated with Google Analytics 4, Ads, Search Console, and YouTube, making it a market favorite.
Strengths:
- Accessible from a browser
- Real-time team collaboration (like Google Docs)
What could be better?
- No native AI, predictive, or advanced analytics capabilities
- It is more difficult to integrate with data outside the Google ecosystem (though possible via connectors).
How to choose business intelligence reporting tools?
As you’ve probably noticed, the variety of media and business intelligence tools and their features is vast!
Every company and marketing or data team has different KPIs (key performance indicators), which require data analysis and reporting capabilities.
That’s why it’s worth exploring various solutions and choosing the business intelligence software that best fits your specific goals, data modeling, and reporting needs.
Choose a media and business intelligence reporting tool that is a fit for your needs:
- If you use large amounts of internal data (e.g., CRM, sales reports, financial results), you will need one of the more advanced business intelligence tools, e.g., Power BI, or Tableau.
- Suppose you need a solution that allows you to perform fundamental data analysis and create clear reports. In that case, choose a solution that automates some of the work and provides the information you need but does not complicate the task, e.g., Looker Studio.
- If you want to monitor external information and data about your company (social media, websites, forums), you should choose a media intelligence tool such as Brand24.
- If you want to automate data analysis related to marketing campaigns and internal marketing data, consider Sotrender, NapoleonCat, or BuzzSumo.
- If you are looking for the broadest tool integration and business process automation, choose Power BI and Brand24. These solutions are best suited to the needs of large organizations.
Conclusion
With so many powerful media and business intelligence (BI) reporting tools available, finding the right one depends on your brand’s goals, the scale of your operations, and the depth of analysis you need.
Honestly, I believe that today, with the help of business intelligence tools, data analysis is more accessible than ever — and much easier to use.
Test different solutions, explore free trials, and remember — reporting isn’t just about collecting data, but about turning it into action. Find a business intelligence tool that delivers the insights you actually need — and make the most of them!
If you found this useful, you’ll love our deep dive into Business Intelligence.
Final thoughts:
- Choose tools based on the indicators and features you need. Not the other way around.
- Use automation features to create reports, such as cyclical auto-generation.
- Use the information the reports provide. Draw conclusions, make better decisions, and gain a competitive advantage.
Regularly track your key metrics, analyze results based on your defined goals, and then apply what you’ve learned to adjust your business strategy. Data-driven plans delivers far better results.
If you want to have all your key data in one place — try Brand24 free for 14 days!

Article Reviewed by