Table of contents
12 Key TikTok Metrics You Should Track in 2026
TikTok is expected to hit over 2.2 billion users by 2027. Understanding and measuring TikTok metrics is essential if you want to stand out on this crowded platform. This article explores essential metrics to increase your video views and reached audience. I’ll dive into what each metric measures and why it is important. Plus, I’ll provide instructions on how to access TikTok analytics. Interested? Let’s dig in!
Tracking TikTok metrics can help you understand your performance on the platform and improve your marketing strategy for better results. At the same time, analyzing this data is invaluable to getting to know your traffic sources and audience so that you can reach new potential users.
Key TikTok metrics to track:
01 Video views
Video views measure the total number of times your TikTok videos have been watched.
High view counts and the percentage of people who watched the full video can signal trending potential.
So, to put it simply: The more people watched the whole video, the better.
How to measure?
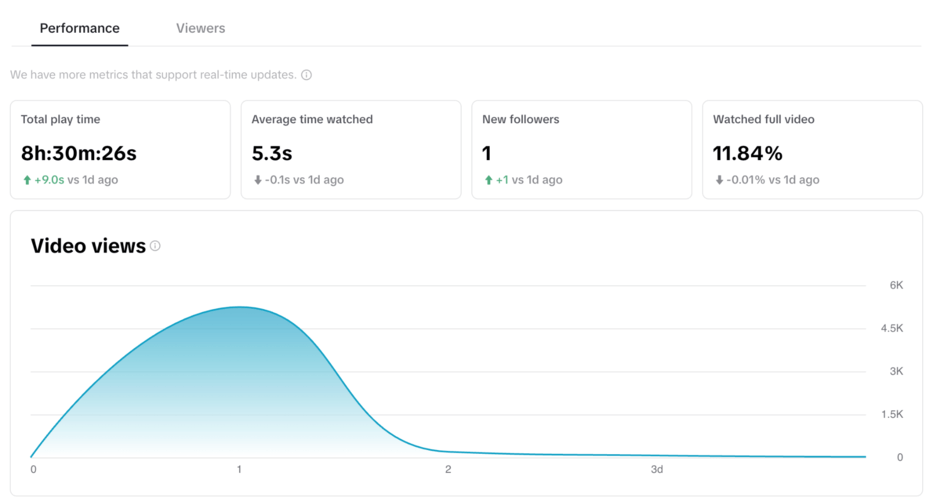
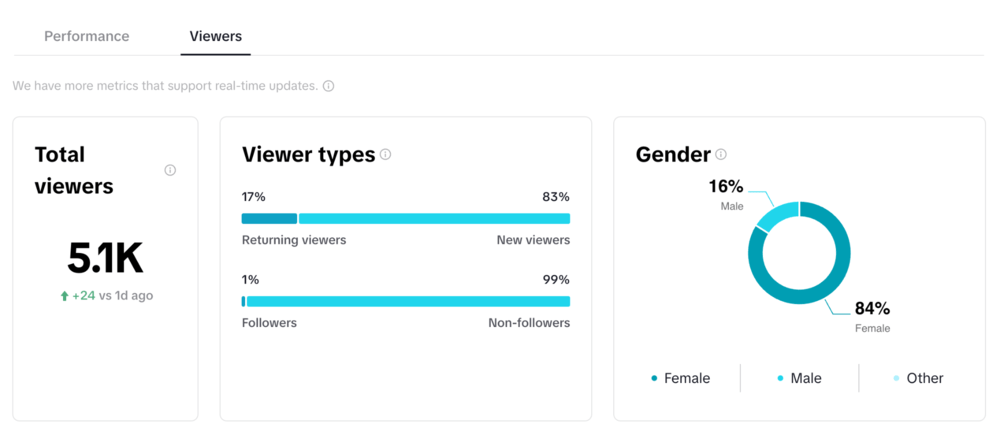
You can find information about your views in the Profile Overview tab > Content tab in a TikTok analytics tool called “Creator Center”. There are two tabs to choose from – video performance and viewers.
In the Performance tab:
- the average time people watched your video
- how many people watched the entire video
- the number of followers that came after watching this particular content
- the total amount of time people watched the video
In the Viewers tab:
- the total number of viewers
- viewer types (followers/non-followers and returning viewers/new viewers)
- viewer gender
- video views by region
With this feature, you can monitor how various content and promotional strategies drive traffic to your profile so you can adjust your strategy and create successful content.
02 The volume of mentions
An often underrated yet essential TikTok metric is the volume of mentions. It will tell you:
- Who talks about your brand?
- How often do these people talk about your brand?
- How do they feel about your brand?
By monitoring TikTok mentions, brands can control conversations about them and adjust the message if needed.
Sometimes, we think our campaign is perfect, and everyone will love it, and then… the reality kicks in.
Tracking mentions allows you to respond quickly.
Plus, you can get to know your audience and improve the TikTok marketing strategy.
How to measure?
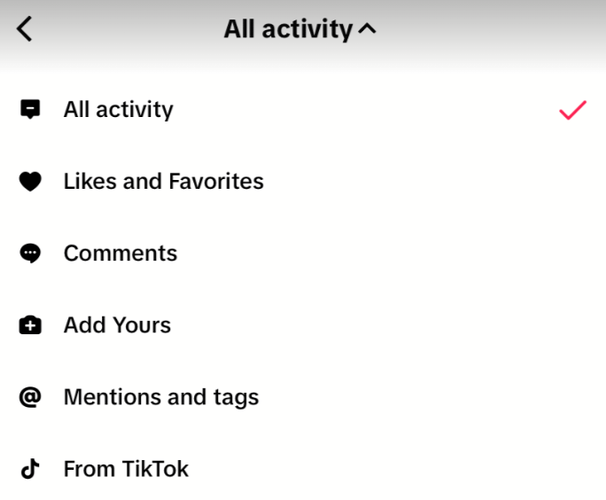
You can find social mentions in your TikTok profile. The ones added with “@” will appear in your notification list.
The platform Creator Center enables you to filter notifications, so you can get just the ones about mentions and tags listed in one place.
However, measuring them manually can be time-consuming and create room for errors. Plus, you get to see just the ones added correctly (as clickable links with the “@” symbol).
And whether we like it or not – there are many more to find.
That’s why I suggest using social listening tools. They can catch mentions of your brand from all over the internet (also those not tagged directly).
For example, this is an untagged mention detected by Brand24:

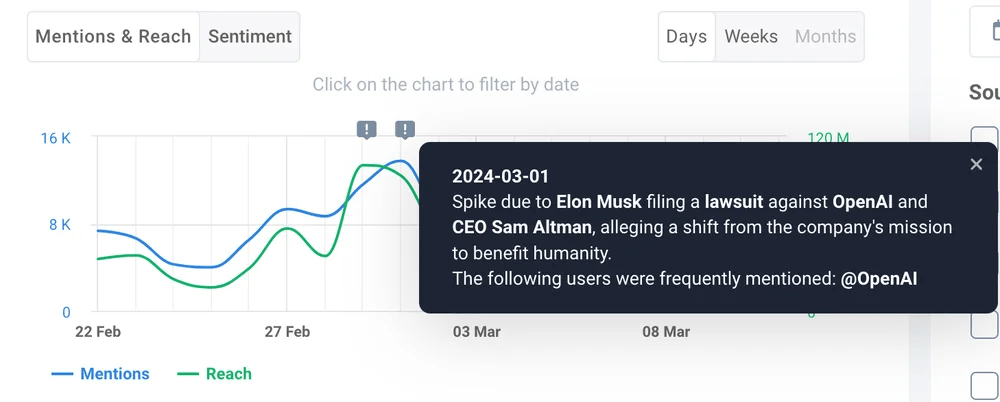
And here’s the game changer. Some more advanced tools use AI to simplify the process of analyzing data.
Check this one out – it’s an Anomaly Detection feature that identifies any spikes in your brand mentions and instantly explains the “whys” behind it:
03 Followers
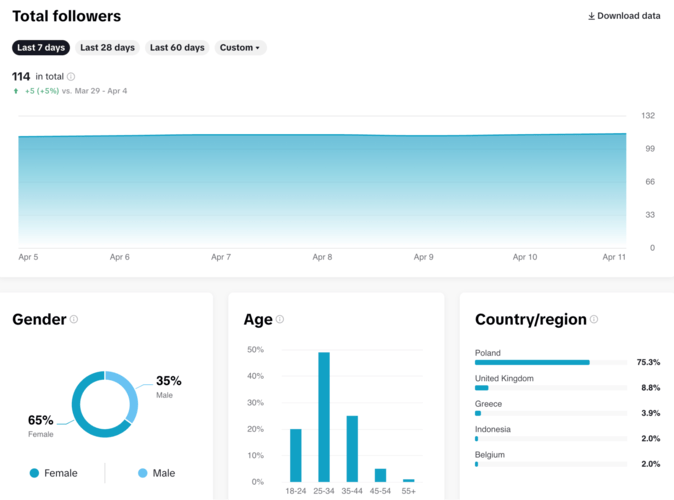
TikTok follower metrics are pivotal for optimizing your TikTok strategy and achieving long-term growth and engagement. They help you get to know your followers so you can refine strategies and enhance engagement.
Continuous follower growth indicates content resonance.
Here are the TikTok followers metrics:
- Total followers – the total number of users who follow your account, including any changes that occurred in the selected period.
- Gender – this metric shows the distribution of your followers by gender.
- Country/region – This metric shows where your followers are from and is ranked by country.
- Follower activity – here, you’ll find insights regarding times your followers are most active on TikTok (it’s usually the best time to post)
- Age – here’s the breakdown of your follower’s age.
How to measure?
You can access your follower’s metrics internally through TikTok Analytics, and it’s possible to filter the data by time.
04 Profile Views
Profile Views on TikTok show the number of times users have visited your TikTok account.
This metric strongly indicates interest in your brand and reveals if the content attracts the user to explore more about you beyond the video that popped out on the “For you” page.
Many profile views can signify an effective content strategy that prompts viewers to engage more with your videos.
How to measure?
You can easily access profile views statistics in the ‘Key metrics’ tab in your TikTok analytics dashboard.
This metric should be monitored regularly to evaluate how different content or promotional efforts affect interest in your profile.

05 Unique Viewers
This metric measures the number of times a distinct individual has watched your videos. It provides insights into how well the content attracts new users and helps you monitor audience growth effectively.
How to measure?
Find unique viewer statistics in your TikTok analytics’s ‘Content Insights’. It’s possible to access data from a selected date range.
Fun fact: I had a viral video. That’s why the peak is so high from 4 to 6 of April on the chart below. Crazy huh?

06 Social media reach
Social media reach on TikTok is directly linked to viewers. This metric is all about counting the number of unique accounts that see content linked to your brand.
It is one of the most important TikTok metrics as it shows you how far your message is spreading.
How to measure?
Unfortunately, TikTok is very limited in measuring your reach.
You could count the views you got on all of your videos in a given period of time and sum it up, but this method is far from perfect.
If you want to do it right, you should use apps like Brand24, Hootsuite, or Sprout Social. These give you data beyond just TikTok, giving you a broader understanding of your content’s visibility.
For example, other data sources of Brand24 include:
- Social media platforms such as TikTok, Instagram, LinkedIn, YouTube, Facebook, Reddit, Quora, Telegram, and Twitch
- Review sites such as TripAdvisor, Yelp, Booking, App Store, Google Play, Trustpilot
- Blogs
- Video platforms
- Podcasts
- Discussion forums
- Newsletters
- Online news sources
- Other publicly available sources
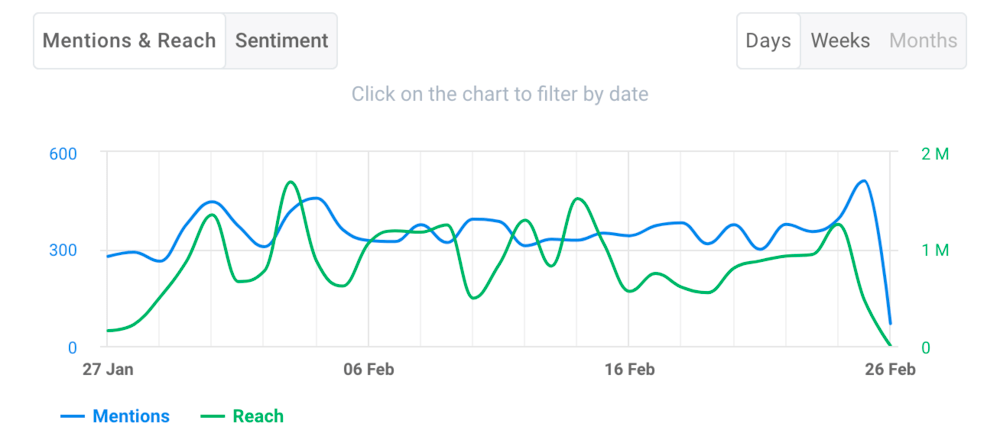
You can access this data in a selected date range.
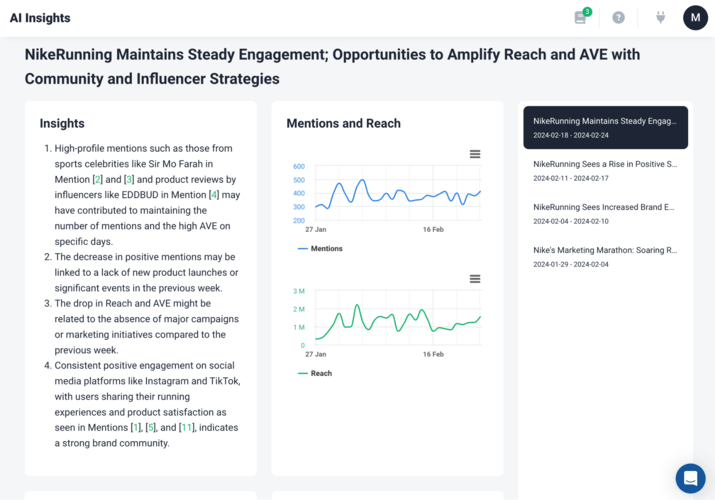
Plus, Brand24 monitors changes in your media reach over time and gives you AI-based insights into what exactly made your community grow.
07 Interactions
Interactions on TikTok are all about how users engage with your video posts. This metric includes the number of comments, likes, shares, and saves.
Keep an eye on this metric, as it directly reflects your TikTok performance and shows how engaging and interactive your content is.
Higher interaction rates usually mean better content performance and more substantial support from the TikTok algorithm.
How to measure?
You can track interactions by checking your TikTok analytics’s ‘Engagement’ section.
Detailed breakdowns help identify which types of content generate the most engagement, enabling strategic adjustments to maximize future interactions.
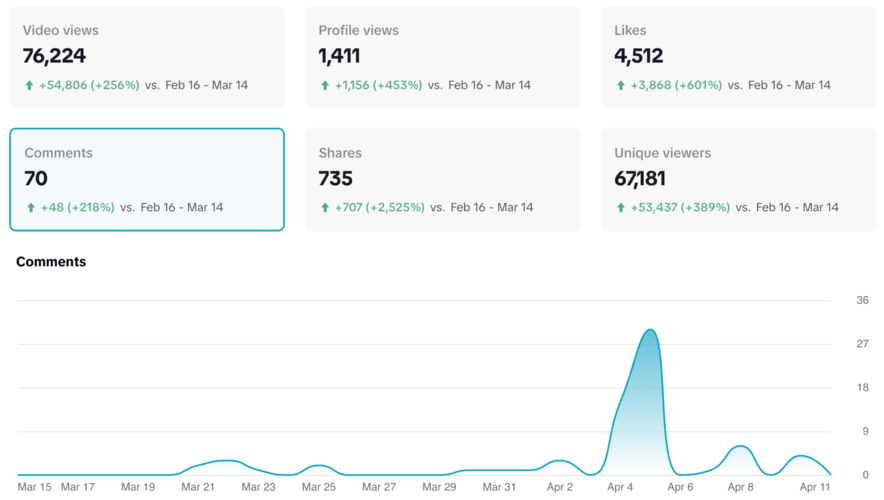
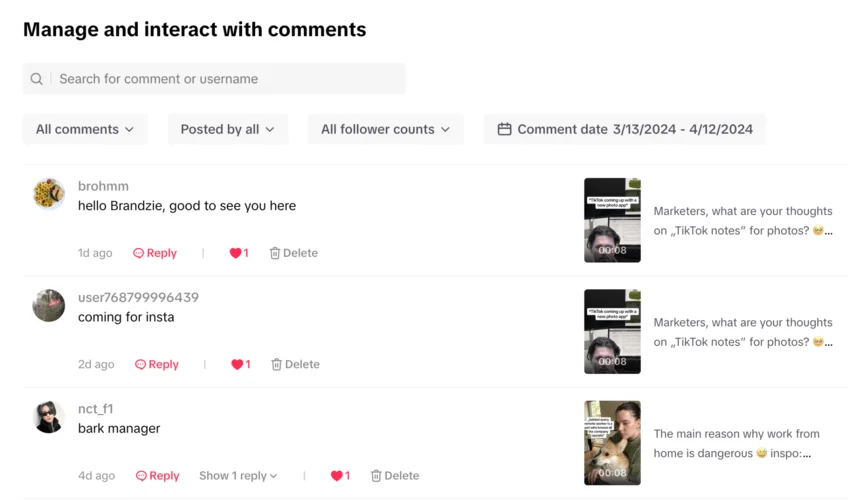
TikTok also offers an interesting feature for comments management. You can check the total number of comments in a given period of time and engage with each directly from the panel.
08 Hashtag Performance
Hashtag performance measures the effectiveness of the hashtags used in your TikTok videos.
Understanding which hashtags lead to increased visibility and engagement can significantly impact your content’s reach and success.
Why?
Effective hashtags help position your video posts in front of the right audiences and within trending conversations – just like in a basic SEO.
How to measure?
Use TikTok’s ‘Discovery’ analytics to track the performance of specific hashtags. This includes views, interactions, and the overall traction that videos using certain hashtags receive.
But if you want more hashtag analytics or inspirations – go to “Analysis” in Brand24.
This tool can monitor hashtags and keywords related to your brand or industry on TikTok and than – help you identify popular trends and topics you can leverage in your TikTok marketing strategy.

09 Live video metrics
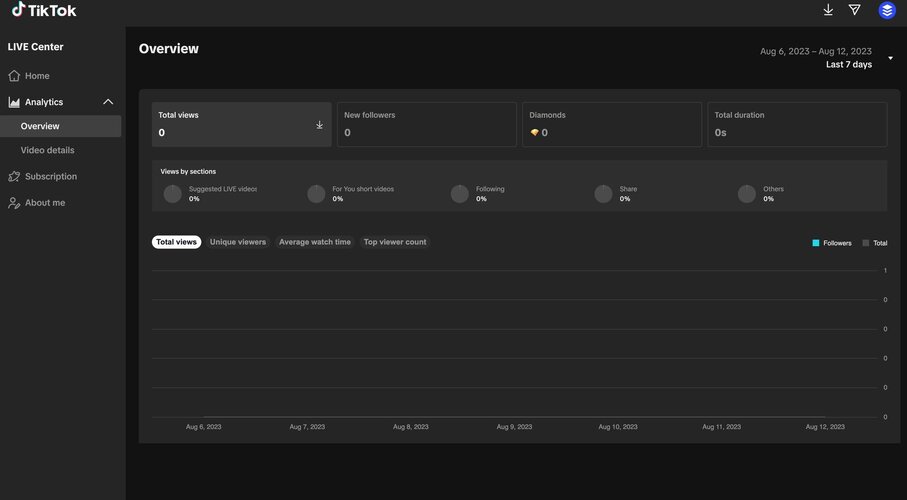
Live videos on TikTok create a whole another category of metrics to track. These include:
- Total duration
The total amount of time you spent hosting live videos. - New followers
The total number of users that discovered your TikTok account due to this particular live and followed you. - Top viewer count
A list of users who watched your Live sessions the most during the selected time period. - Unique viewers
Refers to the number of users who watched your live video at least once. - Diamonds
When you create a live video, users can send you virtual gifts called “diamonds”. You can later exchange these diamonds for real money.
This metric shows the number of times your live got you those gifts.
How to measure?
After switching to a business account and publishing live content, you can access the “Live Center” provided by TikTok. In this place, you can find data about your live performance from a specific timeframe.
10 Engagement rate
Engagement rate is a critical metric on TikTok if you want to evaluate your performance. It reflects how engaging and compelling your videos are to the audience.
How to measure?
Engagement rate is calculated by the number of likes, comments, and shares your content receives and compared to the number of views.
The formula here is simple:
total engagement (every like, share, and comment) divided by total views, multiplied by 100.
11 Presence Score
Presence Score is one of the key metrics to understand your impact. It shows your TikTok account’s overall visibility and activity level.
The Presence Score combines factors such as follower growth rate, content frequency, and engagement levels to provide a comprehensive overview of your brand’s online presence.
How to measure?
Calculating your online presence score requires advanced analytics tools that can compile and analyze data across multiple performance indicators and offer a singular score that will help you understand your brand’s presence.
This is what it looks like in a Brand24 dashboard:

As you can see, you can also check how your Presence Score changes over time.
12 Trending videos
This metric provides an overview of your top nine videos with the fastest growth in views over the last 7 days.
How to measure?
You can check your viral videos in Creator Center > Content > Trending Videos.
And this is what you get:
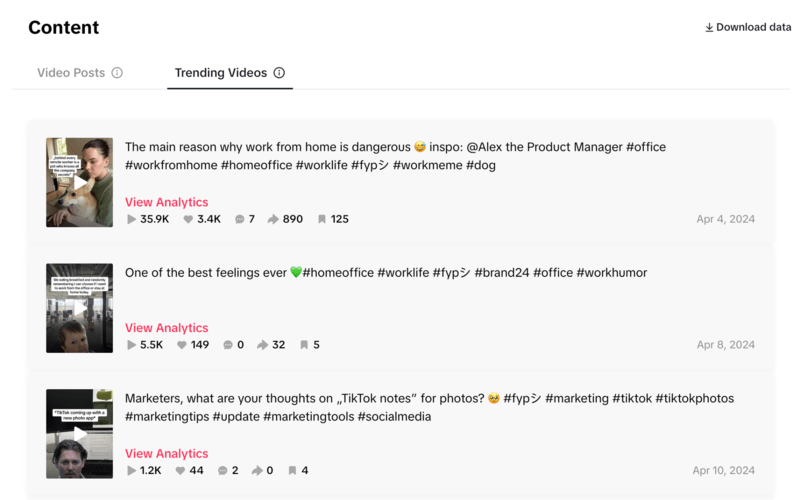
Unfortunately, returning to historical data is impossible – you can view just the videos from the last 7 days.
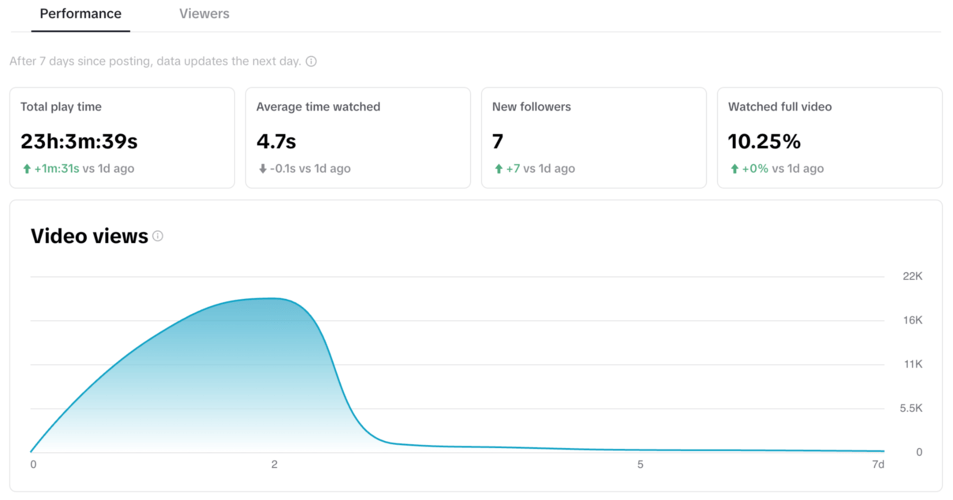
You can also click on each of the videos for more detailed information (average amount of time people watched your content, total play time, how many people watched the full video, and how many new followers you got thanks to that content):
Tip: Advanced tools can analyze metrics for you
Analyzing data can be a time-consuming and tedious task.
But some tools can do the heavy lifting for you.
Sounds good?
Brand24 will gather, analyze, and interpret your data – you get those sleek reports and conclusions. This way, you can focus on the more important tasks than manually counting and analyzing data.
Here’s what the Metrics Analysis tab in Brand24 looks like. It summarizes your project data, offering a clear and concise overview of your TikTok performance.
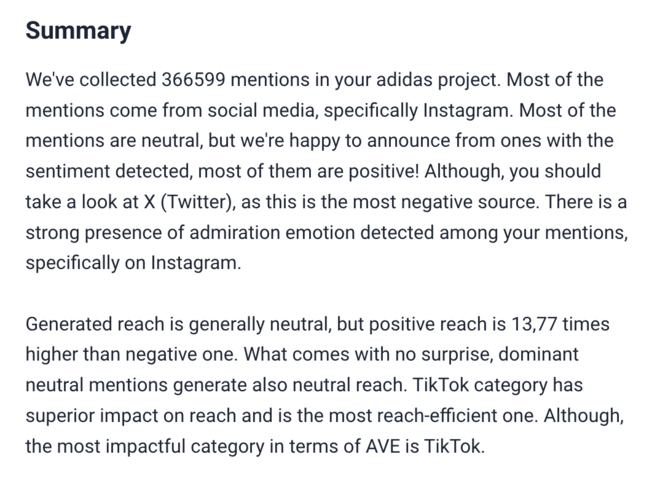
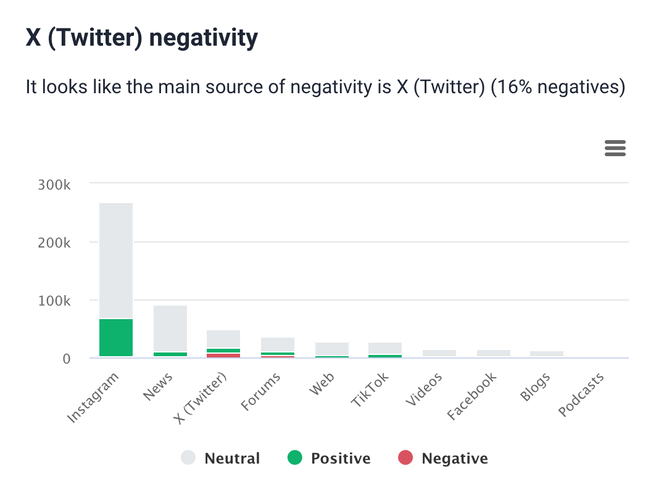
Brand24’s analytics go beyond basic numbers. It delves into the sentiment behind your mentions, categorizing them as positive, negative, or neutral.
This feature is particularly helpful as it automatically detects which sources generate the most negative sentiment, helping you pinpoint areas needing special attention.
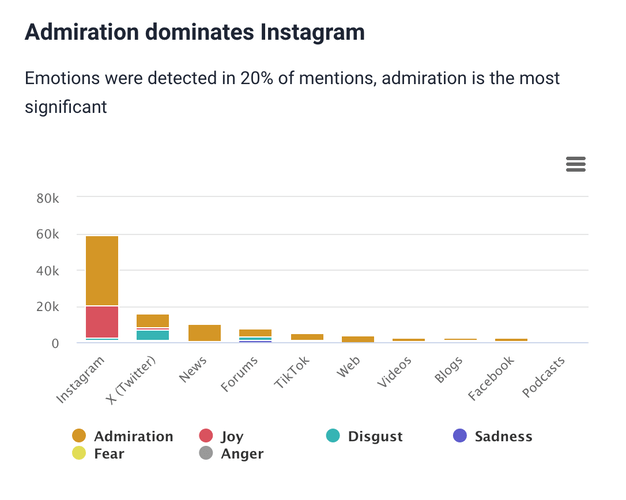
And what if the sentiment analysis is not detailed enough?
You can always take a look at the emotion analysis. The tool can detect exact emotions, giving you a deeper understanding of how your audience really feels about your content.
Plus, it divides it by source:
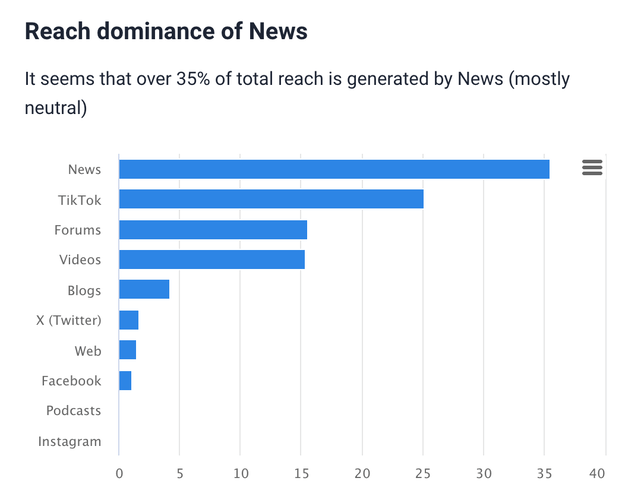
Another standout feature of Brand24 is its ability to detect the most reach-efficient sources.
This means you can easily see where your efforts have the biggest impact, helping you optimize your strategy for maximum effectiveness.
Conclusion
I know it’s easy to get lost in the ever-changing TikTok landscape. You want a lot of views, but all of those trends, weird sounds, and influencers… TikTok’s algorithm is complicated.
Understanding your TikTok metrics will help you find the right direction.
Here’s what to keep in mind as you plot your course:
- Focus on data: Use TikTok analytics to understand how your content performs and areas for improvement. Adjust your plans based on what the data tells you.
- Automatization and AI are your friends: Let advanced TikTok monitoring tools handle the heavy lifting of data analysis so you can spend more time creating content and strategies that resonate with your audience. You can always go for a free trial to test those features.
- Monitor trends: Keep a close eye on how users interact with your content to identify trends that capture their attention and encourage interaction. This helps you fine-tune your approach to maximize engagement.
Ready to take control over TikTok? Start with a Brand24 14-day free trial.


