Table of contents
11 Key Business Performance Metrics You Should Track in 2026
Running a business can feel overwhelming, with an endless to-do list and constant deadlines. Amid this hustle, it’s easy to overlook one critical element: tracking your business performance metrics.
Yet, these key metrics are the foundation for understanding whether your actions are driving the results you aim for.
Business performance metrics provide a clear snapshot of your business’s health and effectiveness across key areas like marketing, sales, human resources, and management. They act as a compass, guiding you toward informed decisions, clear business objectives, streamlined business processes, and better outcomes.
In this article, I’ll walk you through the essential business metrics you should monitor.
By focusing on these, you can refine your strategy and position your business for success.
Key performance indicators to track:
01 Revenue growth
Revenue growth is a key indicator of your business’s financial health and overall success.
It measures how much your company’s income from sales or services has increased over a specific period.
This metric highlights the effectiveness of your sales and marketing strategies and signals whether your business is expanding or stagnating.
Measuring revenue generated in a specific period is one of the key financial metrics reflecting the state of your business.
Consistent revenue growth is essential for sustaining operations, attracting investors, and achieving long-term goals.
How to measure?
To calculate revenue generated, subtract the revenue from the previous period (e.g., month, quarter, or year) from the current period’s revenue.
Then, divide the difference by the revenue from the previous period and multiply by 100 to get the percentage growth.
Example: If your revenue increased from $50,000 to $60,000, the growth rate would be:
(60,000−50,000)÷50,000 × 100 = 20%
Regularly tracking this performance metric allows you to identify trends and spot the most efficient strategies.
02 The volume of mentions
The volume of mentions refers to how often your brand, product, or service is discussed online.
This metric provides insight into your brand visibility and popularity, helping you gauge the effectiveness of your marketing efforts and identify trends in consumer interest.
A high volume of mentions often indicates strong brand awareness, while a sudden spike could signal the success of a recent campaign—or the need to address a potential issue.
How to measure?
Measuring the volume of mentions manually can be incredibly time-consuming, especially with the vast number of social media platforms, blogs, and forums where your brand might be discussed.
Instead, it’s best to use a media monitoring tool like Brand24, which automates the process and provides accurate, real-time data.

With Brand24, you can track mentions across multiple channels, analyze their context, and gain valuable insights to inform your strategy.
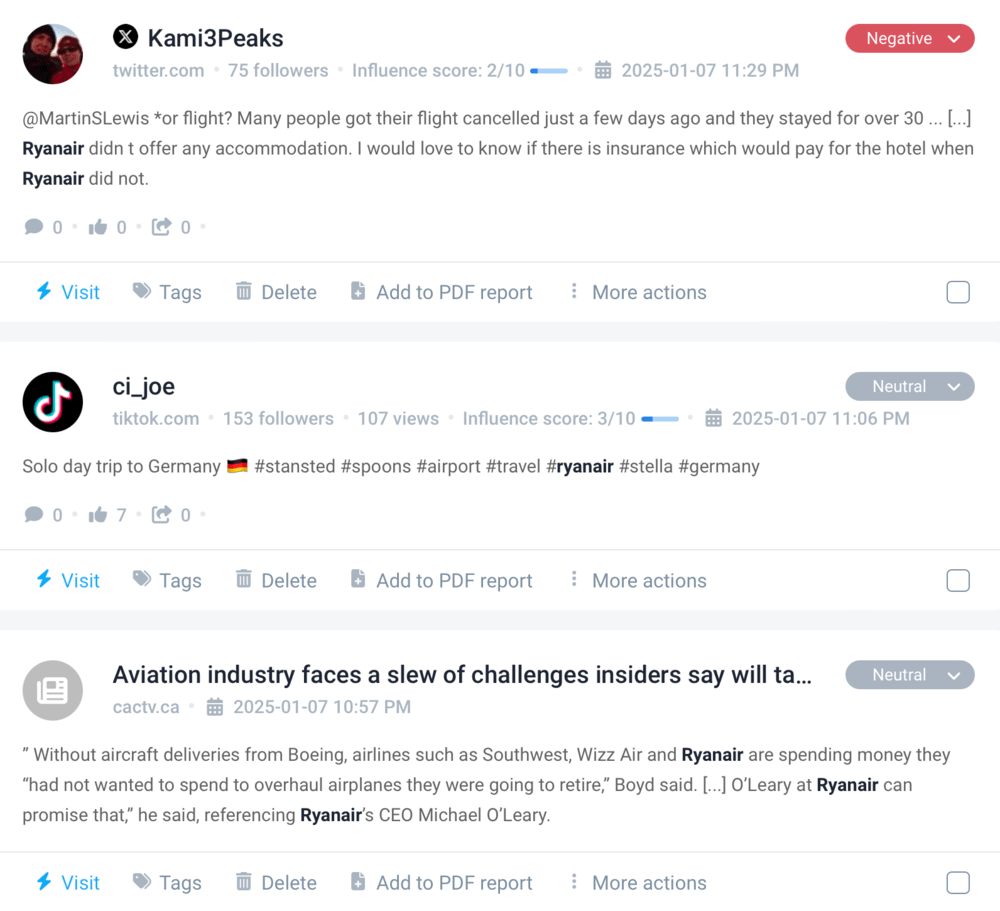
Brand24’s big advantage is its broad platform coverage, which is not available in other media monitoring tools.
Tracked sources include:
- Social Media Platforms: Facebook, Instagram, X / Twitter, YouTube, LinkedIn, Reddit, Pinterest, TikTok, Twitch
- Web
- News
- Forums
- Blogs
- Review Sites
- Newsletters
- Podcasts
You can also check the volume of mentions per source to measure online performance on particular platforms.

Another useful feature is Anomaly Detection, which spots peaks in mentions volume and brand reach, analyzes collected data and indicates the reason behind the anomaly.

03 Return on Investment
Return on Investment (ROI) is a critical business metric that evaluates the profitability of your business operations and activities.
It measures how much return you generate for every dollar spent on marketing campaigns, new products, or business operations improvements.
ROI helps you assess the effectiveness of your strategies and allocate resources to initiatives that deliver the best financial performance.
It is a cornerstone for informed decision-making, leading to accurate marketing investment and excellent financial performance.
How to measure?
To calculate the ROI performance metric, subtract the cost of an investment from the total revenue it generated, then divide that number by the investment’s price.
Finally, multiply by 100 to express it as a percentage.
Example: If a campaign cost $10,000 and brought in $50,000 in revenue, the ROI would be:
(50,000−10,000)÷10,000 × 100 = 400%
Tracking ROI across different initiatives allows you to focus on strategies that maximize profitability.
04 Social media reach
As you can imagine, social media can be a key to business success, especially nowadays, as most people use it daily.
That’s why taking care of this touch point with your audience is so important.
Social media reach measures the number of unique users who see your content across social media platforms.
It’s a crucial performance metric for understanding your social visibility and the effectiveness of your social media efforts.
A wide reach means your content resonates with a larger audience.
This increases the potential for social media engagement, awareness, and conversions, making social reach one of your business’s key performance indicators (KPIs).
How to measure?
On some platforms, such as Facebook, Instagram, and Twitter, you can manually check the reach of individual posts or marketing campaigns using built-in analytics tools.
However, for a comprehensive view of your brand’s social media reach, use social listening tools.
Brand24 is one of them.
It not only measures your own posts’ reach across social platforms but also includes mentions from user-generated content (UGC) and influencers.
This way, it offers a broader picture of your social media reputation that goes beyond your own posting and analyzes your audience’s contribution to your brand’s social reach.
In your Brand24 dashboard, select a social platform you want to check the reach or tick all of them for an overall measurement of social media reach.

This approach ensures you’re tracking not only posts created by your brand but also the organic buzz generated by your audience and collaborators. Thus, it’s a very holistic performance metric.
05 Conversion rate
Conversion rate is a vital metric that measures the percentage of users who take a desired action.
This can be purchasing, signing up for a newsletter, or downloading a resource.
This business metric reflects how effectively your company turns visitors or leads into customers.
It’s a key indicator of the success of your marketing efforts and sales strategies.
A high conversion rate signifies that your marketing and sales strategies are resonating with your target audience and driving meaningful results.
How to measure?
To calculate the conversion rate, divide the number of conversions (desired actions) by the total number of visitors or leads, then multiply by 100 to express it as a percentage.
Example: If 500 people visited your website and 50 made a purchase, the conversion rate would be:
(50÷500)×100=10%
Google Analytics simplifies this process by automatically tracking user behavior and calculating conversion rates for you.
By setting up Goals in Google Analytics, you can define specific actions you want users to take, such as completing a purchase or filling out a form.
The platform then tracks how many users complete these actions and provides detailed reports.
06 Non-social reach
Non-social reach refers to your online visibility outside of social media platforms.
It encompasses all the ways your content, products, or services are seen through other channels, such as organic search, email marketing, traditional media, and even word of mouth.
While social media is a significant driver of brand awareness, non-social reach can often be just as crucial for expanding your audience and reinforcing your brand’s presence across multiple touchpoints.
It’s also important to note that the source of your reach may depend on your industry.
For instance, B2C companies might generate more buzz on social media, while B2B companies may be more present in podcasts, news, forums, or press releases.
Either way, non-social reach is an important performance metric for tracking.
How to measure?
Brand24 measures non-social reach by tracking mentions of your brand across various online sources beyond social media.
These sources include:
- Web
- News
- Forums
- Blogs
- Review sites
- Newsletters
- Podcasts
This tool aggregates data from all these platforms, giving you a comprehensive view of your brand performance across the web.
Brand24 ensures you’re capturing the full spectrum of non-social conversations, from news articles to user reviews and blog mentions.

In addition, Google Analytics can help you monitor non-social reach through traffic sources, such as organic search and referral links.
By analyzing where visitors are coming from—whether through search engines or external websites—you can gain valuable insights into how your content is being discovered outside of social media.
Together, Brand24 and Google Analytics offer a holistic approach to tracking non-social reach for your brand.
07 Net profit margin & gross profit margin
Profit margins are essential performance metrics for evaluating your business’s financial health and efficiency.
The net profit margin shows how much profit your business makes after accounting for all expenses, taxes, and interest relative to your total revenue.
This metric reflects overall profitability and sustainability.
Meanwhile, the gross profit margin focuses on how efficiently your business generates profit from its core operations by measuring the difference between revenue and the cost of goods sold (COGS).
These financial metrics are crucial for identifying strengths, areas for improvement, and the viability of your pricing and cost structures.
How to measure?
Net Profit Margin
To calculate the net profit margin, divide your net profit (total revenue minus all expenses) by your total revenue, then multiply by 100 to express it as a percentage.
Example: If your business earns $100,000 in revenue and has $80,000 in total expenses, your net profit margin is:
(100,000−80,000)÷100,000 × 100 = 20%
Gross Profit Margin
To calculate the gross profit margin, subtract the cost of goods sold (COGS) from total revenue, divide the result by total revenue, and multiply by 100.
Example: If your revenue is $100,000 and your COGS is $40,000, the gross profit margin is:
(100,000−40,000)÷100,000 × 100 = 60%
While these calculations can be done manually, accounting software like QuickBooks, Xero, or FreshBooks simplifies the process by automatically tracking and calculating profit margins for your business.
These tools provide detailed reports, helping you monitor your company’s financial performance, spot changes, and adjust your strategies accordingly.
08 Presence Score
Presence Score is a unique metric that evaluates your brand’s online visibility and reach compared to competitors.
It reflects how often and where your brand is mentioned across various channels, providing a snapshot of your digital presence.
A higher Presence Score indicates strong visibility, helping you understand your position in the market and assess the effectiveness of your marketing and outreach efforts.
How to measure?
Brand24 offers a proprietary metric called the Presence Score, which you can easily find in your dashboard.
This relative metric compares your brand’s performance to other companies, making it especially useful for industry benchmarks and competitive analysis.
By taking into account factors like the volume of mentions and reach, the Presence Score provides actionable insights to help you refine your strategy and maintain a strong online presence.

The Presence Score works on a scale from 0 to 100, where 100 is achieved by globally recognizable brands and very popular topics.
The growth speed of the Presence Score decreases with progress. Increasing this performance metric from 80 to 90 is much more challenging than raising it from 10 to 20.
09 Customer satisfaction
Customer satisfaction is a key indicator of how well your products, services, and overall experience meet customers’ expectations.
It impacts loyalty, advocacy, and your business’s bottom line.
By tracking metrics like Customer Lifetime Value (CLV), Customer Retention Rate (CRR), Net Promoter Score (NPS), and brand sentiment, you gain a holistic view of your customer’s journey and identify areas for improvement.
Customer Lifetime Value
Customer lifetime value measures the total revenue a customer is expected to generate over their lifetime as a paying client.
While CLV can be classified as a customer satisfaction metric, it’s also one of the importnant financial metrics.
It helps you assess your company’s ability to build brand loyalty and maintain cash flow.
How to measure?
To calculate CLV, multiply the average purchase value by the average purchase frequency and the average customer lifespan.
Example: If a customer spends $50 per transaction, makes four purchases a year, and remains a customer for 5 years, the CLV is:
$50 × 4 × 5 = $1,000
Customer Retention Rate
CRR shows the percentage of customers your business retains over a specific period. A higher CRR indicates customer loyalty and strong satisfaction.
How to measure?
Use the formula:
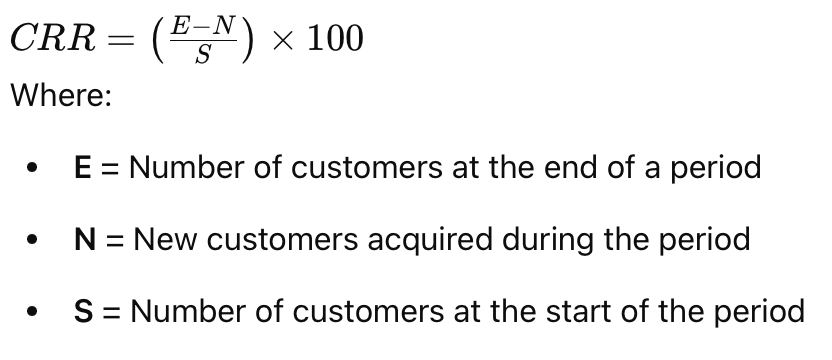
Example: If you started with 500 customers, gained 100, and ended with 550, your CRR is:
(550−100)÷500 × 100 = 90%
Customer retention software like Kissmetrics can simplify this process by providing key metrics and comprehensive dashboards regarding your operational performance in a given period.
Brand Sentiment
The brand sentiment reflects how customers feel about your brand, offering insight into customer satisfaction and PR performance.
Positive sentiment indicates strong customer satisfaction, while negative sentiment highlights areas needing attention. Those can be service quality, brand communication, or delivery on the promise sold.
This performance metric is key as it takes into account all the emotions around your brand expressed online.
This way, it reflects the effectiveness of your business efforts and indicates areas for improvement.
Monitoring brand sentiment also plays a role in early PR crisis detection.
How to measure?
Brand24 simplifies measuring brand sentiment by analyzing mentions of your brand across social media, forums, blogs, and other channels.
The sentiment analysis feature categorizes mentions as positive, negative, or neutral.
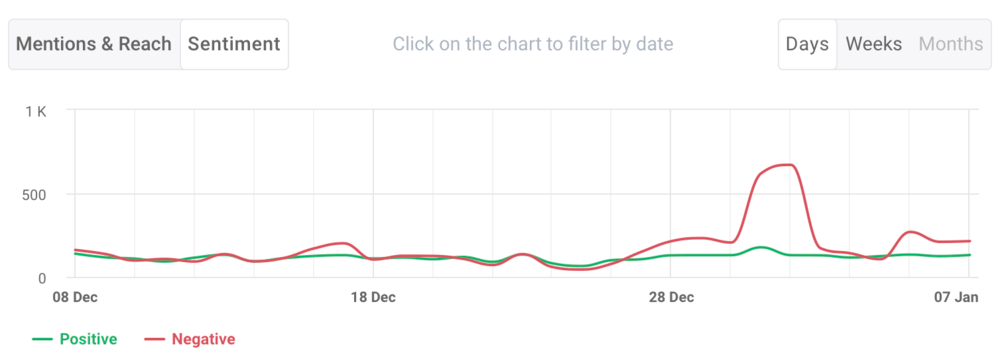
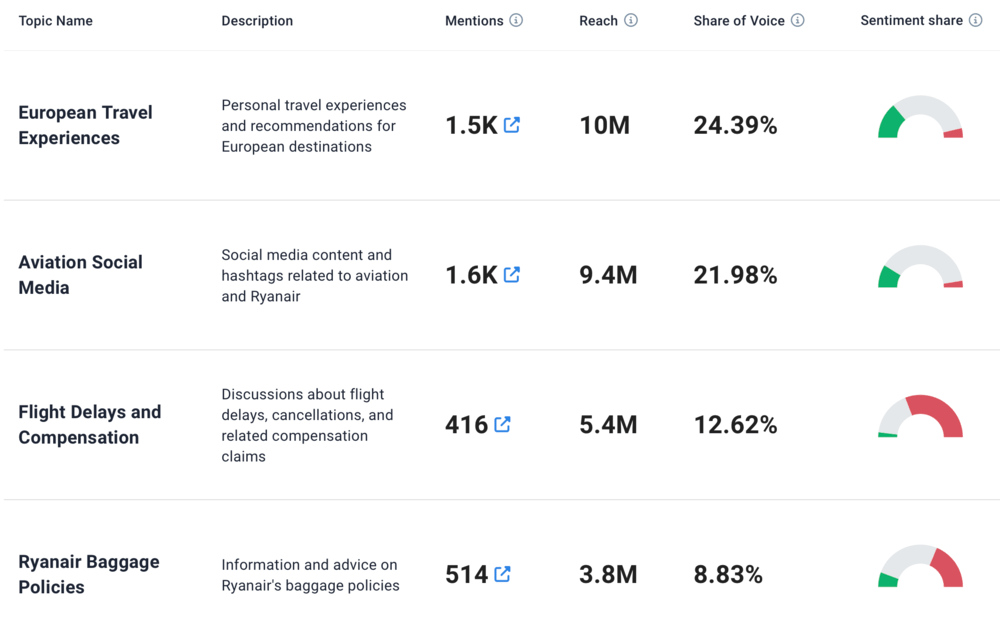
Additionally, Brand24 clusters related mentions in specific topics around your brand.
This helps you pinpoint the aspects of your business that drive customer satisfaction—or dissatisfaction—and fine-tune your strategies accordingly.
Net Promoter Score
NPS gauges customer loyalty by asking a simple question: “How likely are you to recommend our product/service to others?”
Customers respond on a scale of 0–10, divided into:
- Promoters (9–10): Loyal and enthusiastic customers.
- Passives (7–8): Satisfied but unenthusiastic.
- Detractors (0–6): Unhappy customers.
How to measure?
Subtract the percentage of detractors from the percentage of promoters to calculate your NPS.
Example: If 60% are promoters and 20% are detractors, your NPS is:
60 – 20 = 40
Tools like SurveyMonkey, Typeform, or Qualtrics can assist in automating NPS surveys and analysis.
See also: How to collect customer feedback?
10 Share of Voice
Share of Voice (SOV) measures your brand’s visibility in the market compared to your competitors.
It reflects the percentage of conversations, mentions, or coverage your brand receives within your industry.
A higher share of voice indicates stronger brand awareness, more significant market presence, and more effective marketing efforts.
By tracking SOV, businesses can assess their competitive standing, find industry benchmarks, and improve the impact of marketing campaigns.
How to measure?
Brand24 makes measuring Share of Voice straightforward.
It calculates your brand’s SOV by analyzing mentions across various online channels and comparing them to those of your competitors.
You can customize the comparison by selecting any companies or brands you wish to benchmark against.
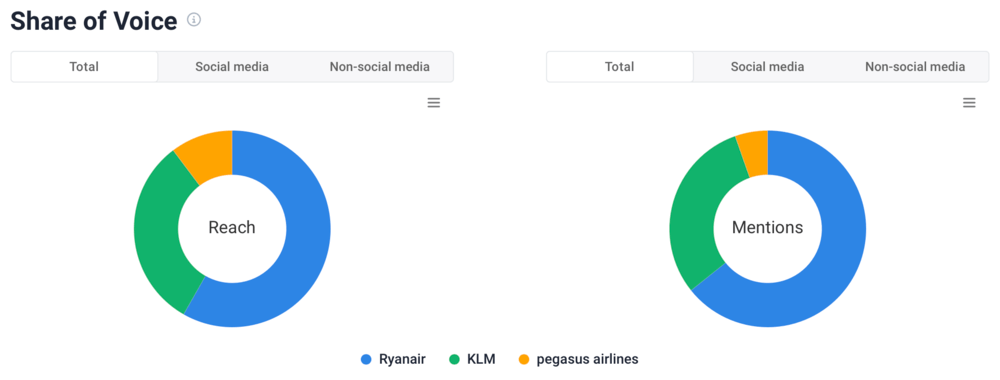
This feature allows you to understand your brand’s position in the market and make data-driven decisions to improve visibility and engagement.
11 Employee satisfaction
Employee satisfaction reflects how happy and fulfilled employees feel about their roles, work environment, and overall experience within the organization.
Satisfied employees are more likely to be engaged, productive, and loyal, directly impacting customer satisfaction, innovation, and overall brand performance.
Tracking this business metric helps identify areas where improvements can be made to foster a positive workplace culture and retain top talent.
Measuring employee satisfaction provides critical insights into your team’s well-being and helps prevent costly issues like burnout, high employee turnover rate, and reduced employee productivity.
A satisfied workforce is essential for maintaining a thriving company culture and achieving long-term success.
How to measure?
- Employee Surveys: Distribute anonymous surveys to gather honest feedback about employees’ perceptions of their roles, management, and workplace environment. Tools like SurveyMonkey or Officevibe can simplify survey creation and analysis.
- Employee Turnover Rate: This metric shows the percentage of employees leaving the company during a given period. Calculate it using:

Example: If 10 employees leave out of 200 in a year, the turnover rate is:
(10÷200)×100=5
A low employee turnover rate typically reflects higher satisfaction.
- Employee Net Promoter Score (eNPS): Ask employees, “How likely are you to recommend this company as a great place to work?” on a scale of 0–10. Group responses into:
- Promoters (9–10): Highly satisfied employees.
- Passives (7–8): Neutral employees.
- Detractors (0–6): Dissatisfied employees.
Calculate eNPS by subtracting the percentage of detractors from the percentage of promoters.
Example: If 70% are promoters and 10% are detractors, the eNPS is:
70 – 10 = 60
Tools like Culture Amp or TINYpulse can help automate this process.
By combining these metrics, you can gain a clear understanding of the satisfaction of your employees.
With this insight, you can make data-driven decisions to improve workplace happiness, business performance, and employee productivity.
PRO Tip: Advanced tools can analyze business metrics for you
Tracking all your business metrics can quickly become overwhelming.
In this article, I introduced you to 10 key performance indicators (KPIs) that every company should monitor.
But what if I told you you can streamline and enhance many of these processes using dedicated business automation software?
Tools like Brand24 remove the guesswork from data analysis by presenting clear, actionable AI insights.
Instead of spending hours analyzing data yourself, Brand24 provides a concise summary of your project, enabling you to assess your business performance quickly.
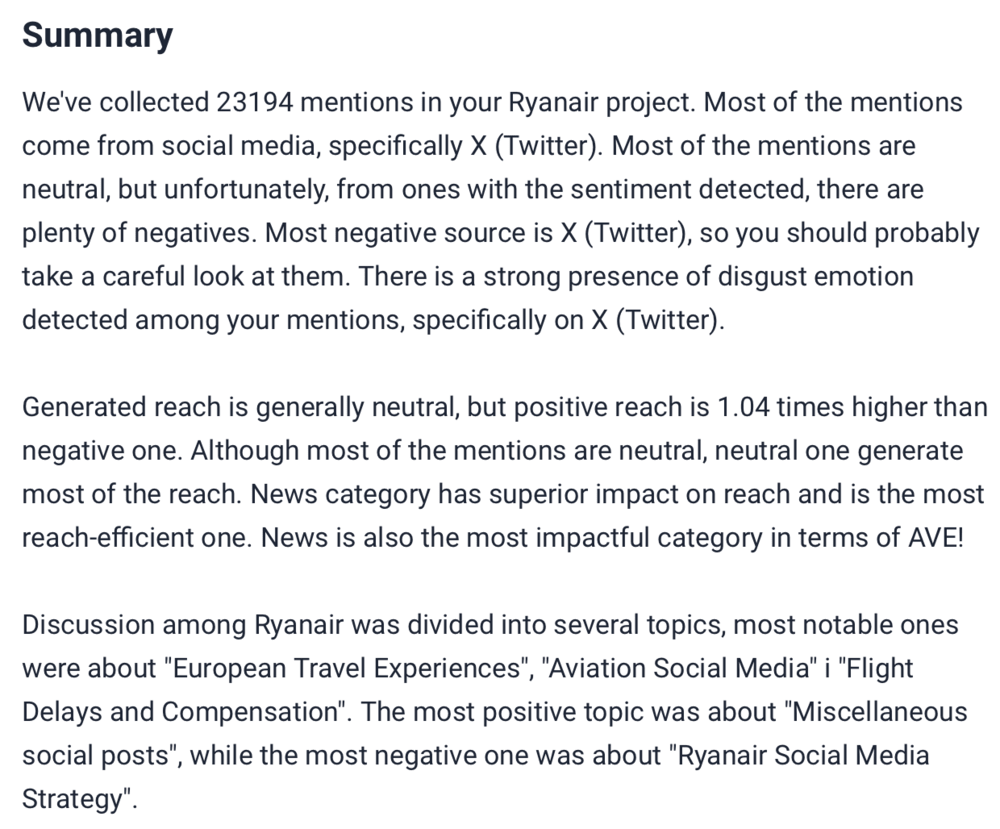
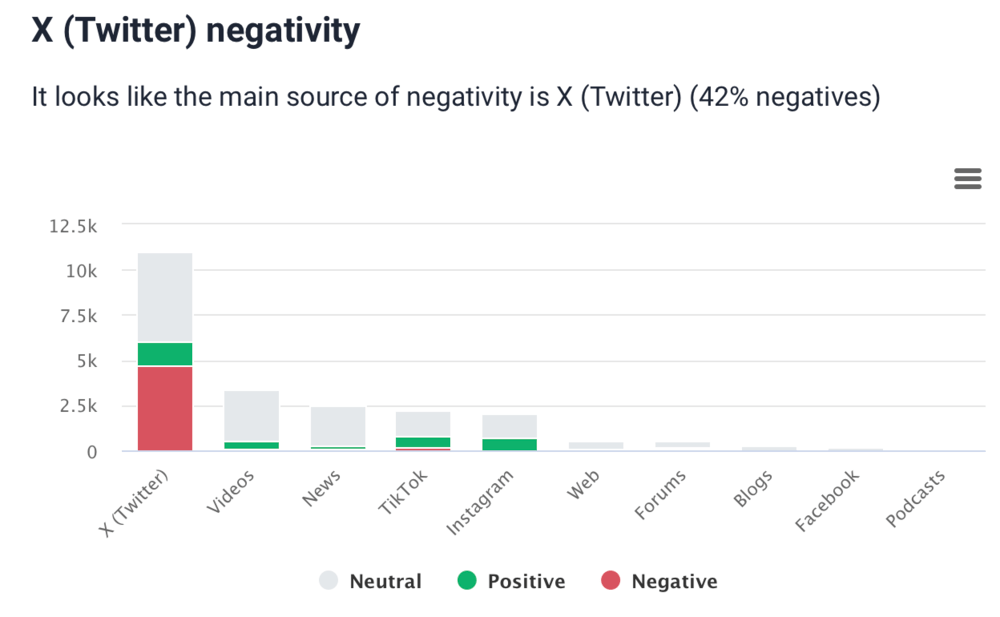
One standout feature is its ability to identify the most negative sources, allowing you to take targeted action where it’s needed most.
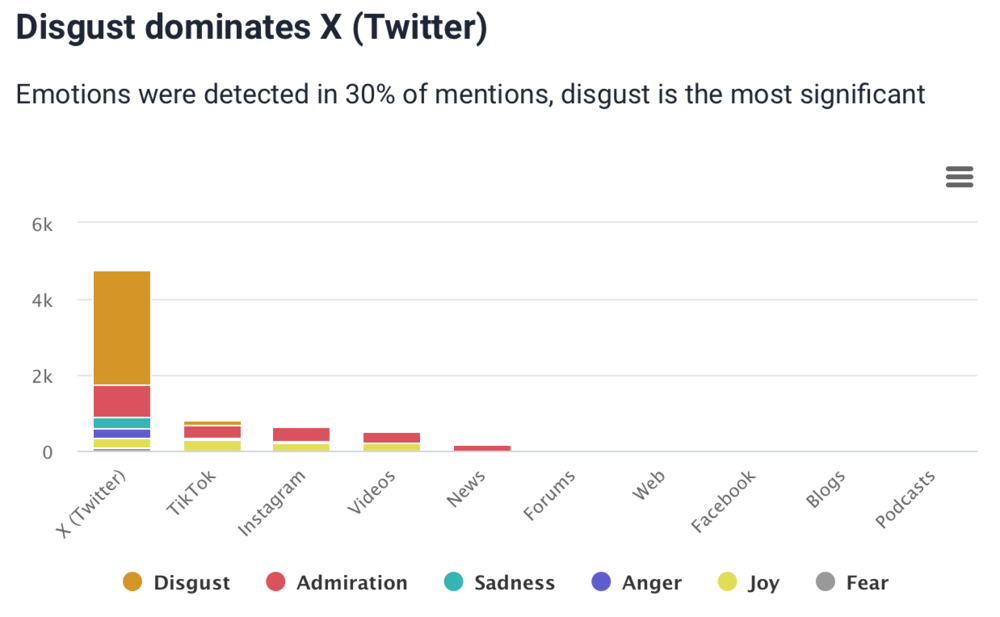
Additionally, Brand24 goes beyond basic sentiment analysis.
It detects a wide spectrum of emotions—ranging from anger and fear to joy—offering you deeper insights into how your audience feels.
This allows you to act accordingly and more precisely address the situation.
Finally, Brand24 identifies the most reach-efficient sources, helping you focus on the platforms that deliver the best results for your business.
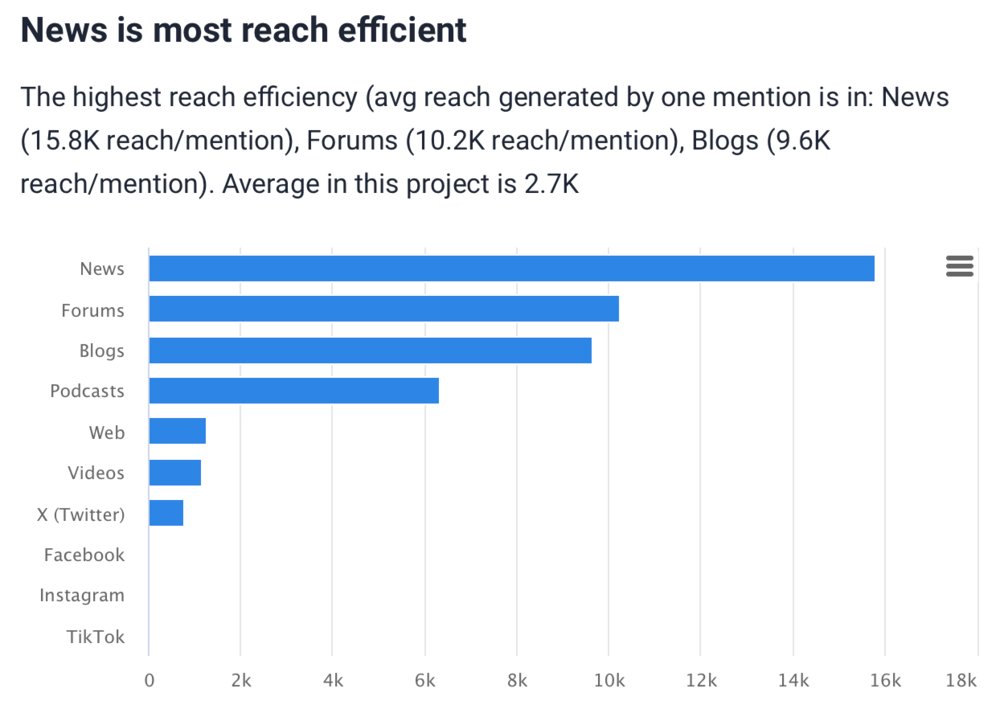
By leveraging these features, you can save time analyzing business metrics without sacrificing the quality of the results.
This way, you gain time to address critical issues and optimize your strategy for maximum impact.
Conclusion
In conclusion, tracking and understanding business performance metrics is essential for making informed decisions and driving growth.
It’s worth investing in tools that automatically analyze data and present actionable insights to maximize efficiency and accuracy.
These solutions eliminate the need for extensive manual analysis, saving time and allowing businesses to focus on implementing strategies that lead to measurable success.
Embracing tools like Brand24 can streamline operations, enhance decision-making, and provide a competitive edge in today’s data-driven world.
Key takeaways:
- Tracking business metrics is crucial for evaluating progress, identifying growth opportunities, and making data-driven decisions. Focusing on actionable performance metrics aligned with your business goals ensures you’re monitoring what truly matters.
- Remember key business metrics:
- Key marketing metrics: the volume of mentions, social media reach, non-social reach, Presence Score, and share of voice.
- Financial metrics: revenue metrics, ROI, and net profit margin & gross profit margin.
- Sales metrics: conversions.
- Customer success metrics include customer satisfaction metrics such as customer lifetime value (CLV), customer retention rate, sentiment, and net promoter score.
- Human resources metrics: employee satisfaction.
- Monitoring performance metrics is only the first step—drawing meaningful conclusions from the data is what truly impacts business performance. The ability to act on these insights effectively sets successful businesses apart.
- Using tools that automatically analyze data and provide actionable insights eliminates the need for time-consuming manual analysis. With streamlined business processes, you can act on conclusions quickly and confidently, improving decision-making and boosting performance metrics.


